The same plot in 14 other libraries — JavaScript: Chart.js, Apache ECharts, Highcharts, MUI X Charts; Python: Altair, Bokeh, lets-plot, Matplotlib, Plotly, plotnine, Pygal, Seaborn; R: ggplot2; Julia: Makie.jl. Compare all 15 side by side: Basic Gauge Chart in Python, R, Julia and JavaScript.
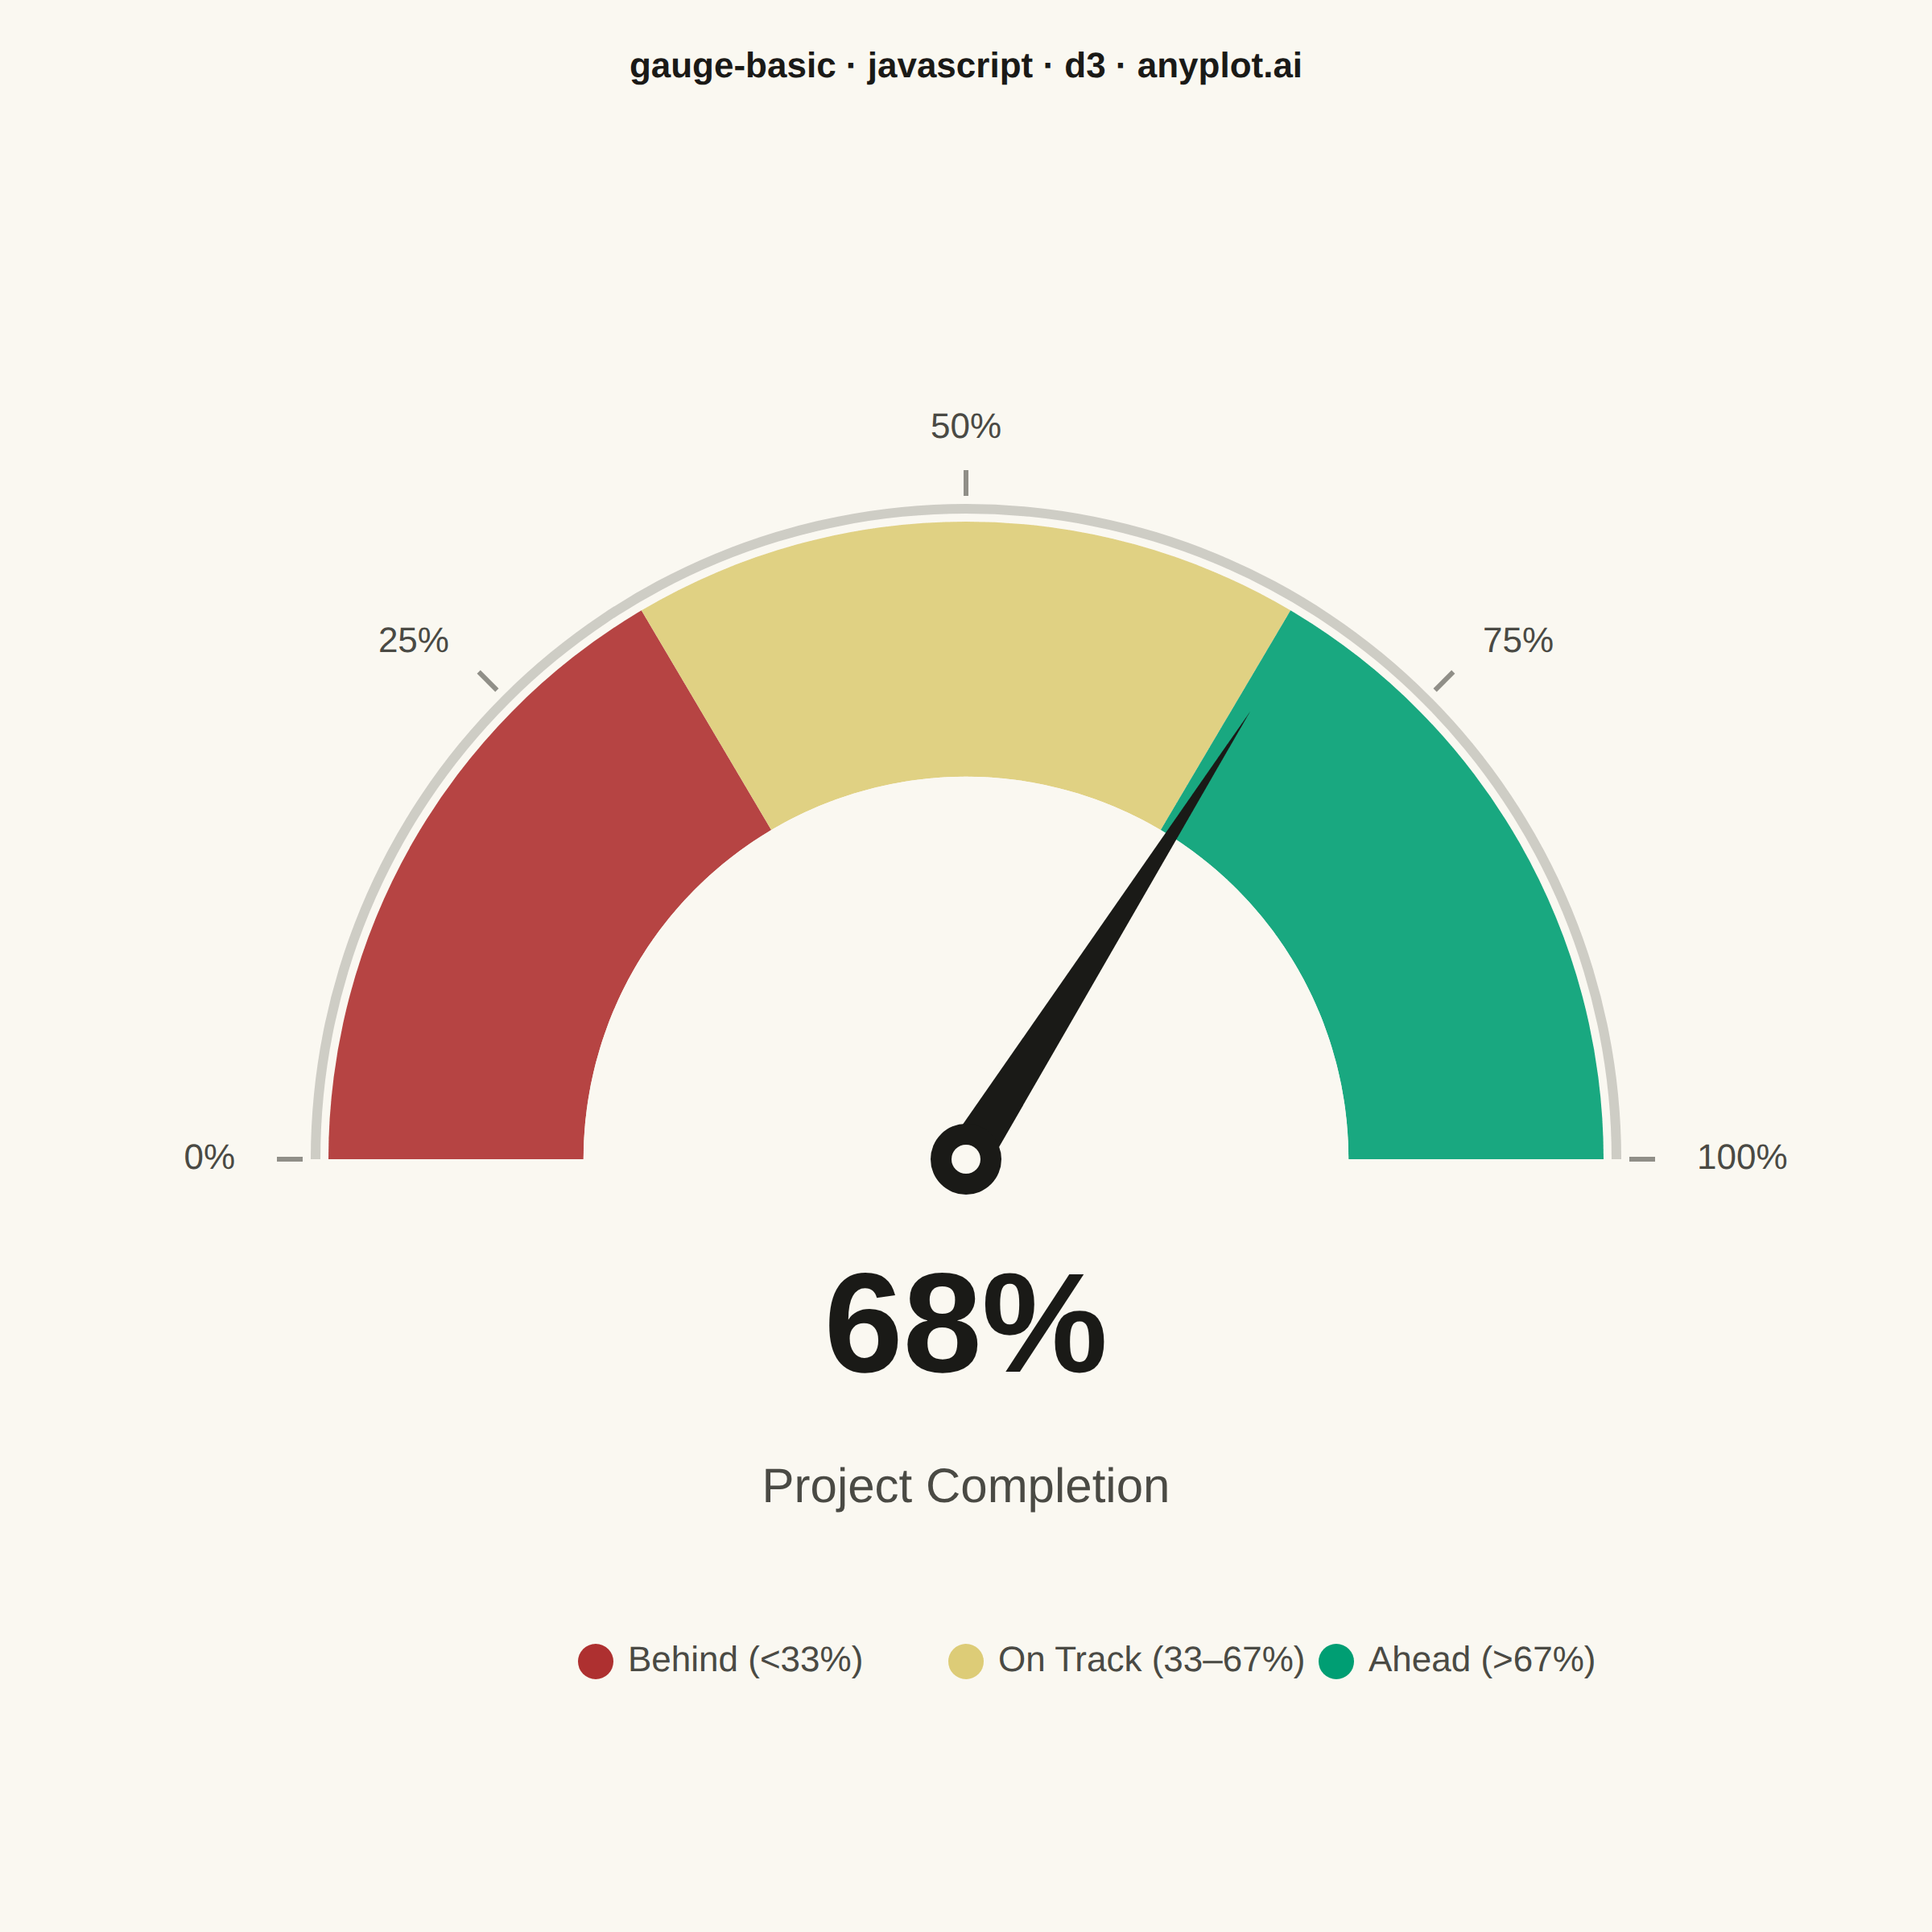
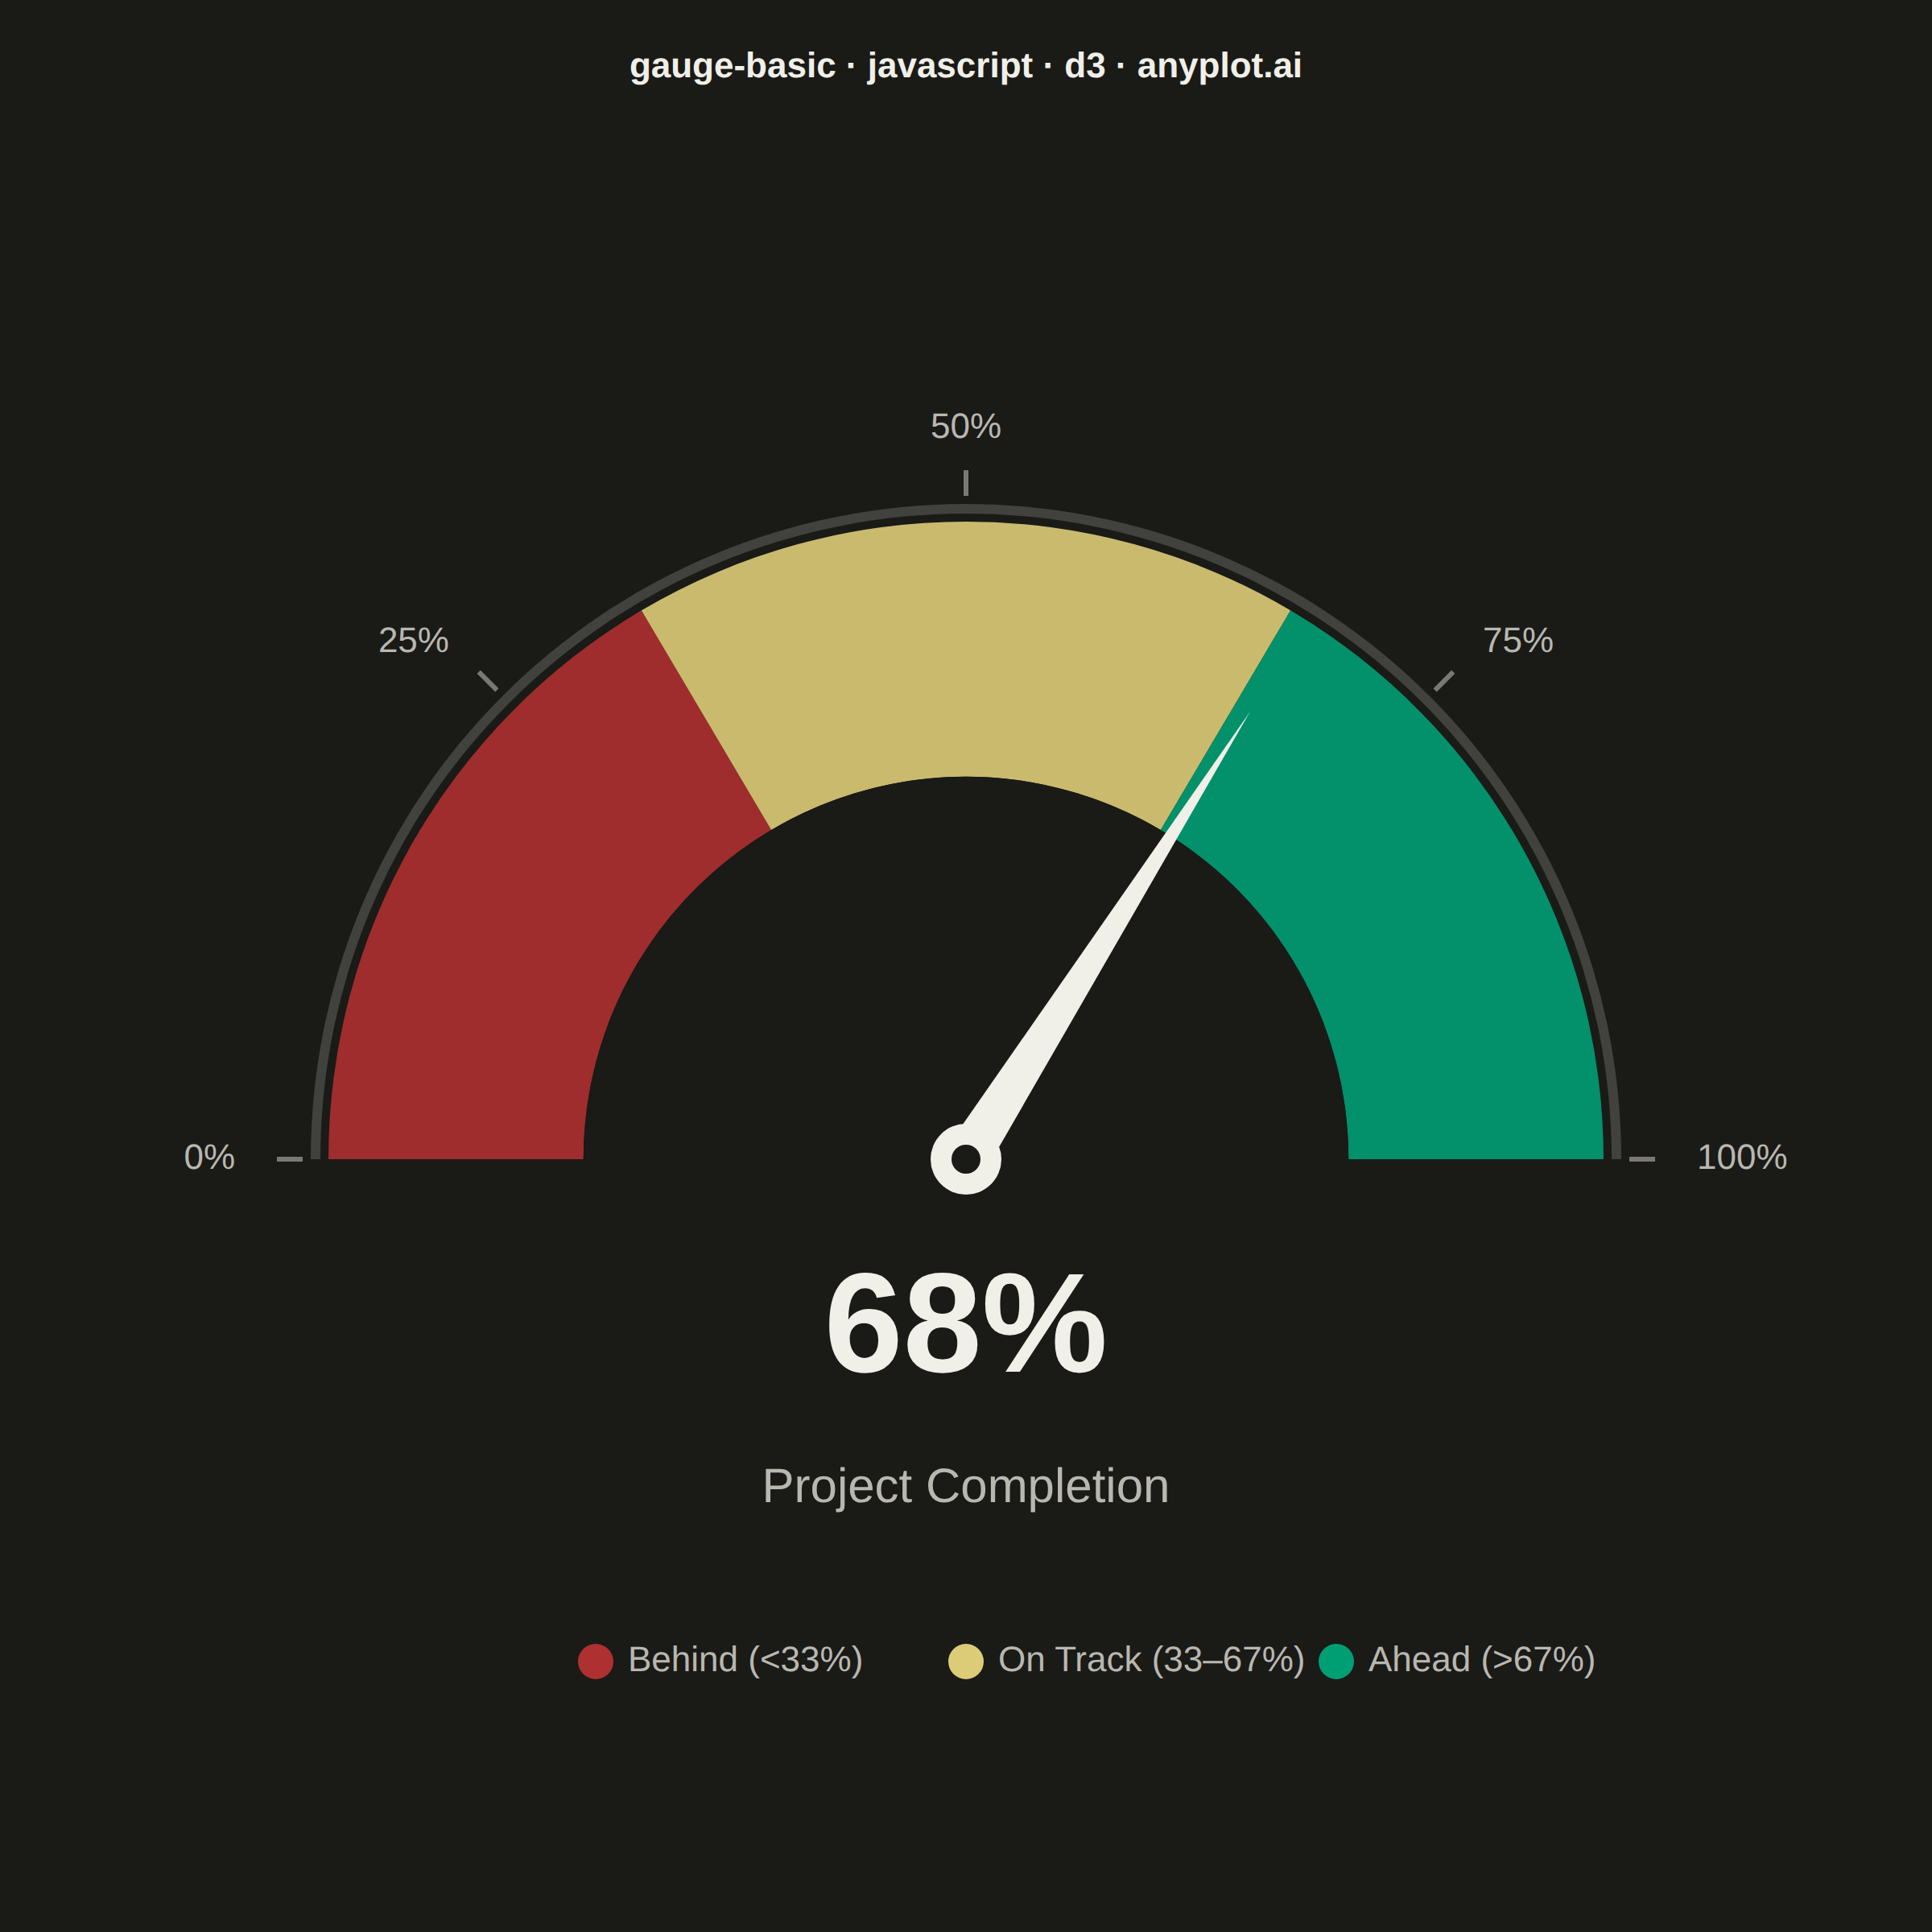
A gauge chart (also known as a speedometer chart) displays a single value within a defined range using a semi-circular or circular dial. It is ideal for showing progress toward a goal, performance metrics, or any KPI that needs to be evaluated against minimum and maximum bounds. The visual metaphor of a speedometer makes it intuitive to quickly assess whether a value is in an acceptable range.
// anyplot.ai
// gauge-basic: Basic Gauge Chart
// Library: d3 7.9.0 | JavaScript 22.23.1
// Quality: 93/100 | Created: 2026-06-30
//# anyplot-orientation: square

// anyplot.ai
// gauge-basic: Basic Gauge Chart
// Library: d3 7.9.0 | JavaScript 22
// Quality: pending | Created: 2026-06-30

const t = window.ANYPLOT_TOKENS;
const { width, height } = window.ANYPLOT_SIZE;

// Project completion: 68% — just entered the "Ahead" zone
const value = 68;
const minValue = 0;
const maxValue = 100;
const thresholds = [33, 67];

// Geometry
const cx = width / 2;
const cy = height * 0.60;
const outerR = Math.min(width, height) * 0.33;
const innerR = outerR * 0.60;

// D3 arc angles: 0 = 12 o'clock, clockwise
// Semi-circle: left (9 o'clock, -π/2) → top → right (3 o'clock, +π/2)
const startAngle = -Math.PI / 2;
const endAngle = Math.PI / 2;

const angleScale = d3.scaleLinear()
  .domain([minValue, maxValue])
  .range([startAngle, endAngle]);

// Zones use Imprint semantic tokens: matte red / amber / brand green
const zones = [
  { start: minValue, end: thresholds[0], color: t.palette[4] },
  { start: thresholds[0], end: thresholds[1], color: t.amber },
  { start: thresholds[1], end: maxValue, color: t.palette[0] },
];

const arcGen = d3.arc().innerRadius(innerR).outerRadius(outerR);

// SVG
const svg = d3.select("#container").append("svg")
  .attr("width", width).attr("height", height);

svg.style("font-family", "'Inter', 'Helvetica Neue', Arial, sans-serif");

const g = svg.append("g").attr("transform", `translate(${cx},${cy})`);

// Zone arcs
zones.forEach(zone => {
  g.append("path")
    .attr("d", arcGen({
      startAngle: angleScale(zone.start),
      endAngle: angleScale(zone.end),
    }))
    .attr("fill", zone.color)
    .attr("opacity", 0.9);
});

// Outer ring guide
const outerRingArc = d3.arc().innerRadius(outerR + 5).outerRadius(outerR + 11);
g.append("path")
  .attr("d", outerRingArc({ startAngle, endAngle }))
  .attr("fill", t.inkSoft)
  .attr("opacity", 0.25);

// Inner background fill — clean donut center behind the needle
const innerFillArc = d3.arc().innerRadius(0).outerRadius(innerR);
g.append("path")
  .attr("d", innerFillArc({ startAngle, endAngle }))
  .attr("fill", t.pageBg);

// Tick marks and percentage labels
[0, 25, 50, 75, 100].forEach(v => {
  const a = angleScale(v);
  const sa = Math.sin(a);
  const ca = Math.cos(a);

  g.append("line")
    .attr("x1", sa * (outerR + 16)).attr("y1", -ca * (outerR + 16))
    .attr("x2", sa * (outerR + 32)).attr("y2", -ca * (outerR + 32))
    .attr("stroke", t.inkSoft).attr("stroke-width", 3).attr("opacity", 0.6);

  const lx = sa * (outerR + 58);
  const ly = -ca * (outerR + 58);
  g.append("text")
    .attr("x", lx).attr("y", ly)
    .attr("text-anchor", sa < -0.3 ? "end" : sa > 0.3 ? "start" : "middle")
    .attr("dominant-baseline", "middle")
    .attr("fill", t.inkSoft)
    .style("font-size", "22px")
    .text(`${v}%`);
});

// Needle — triangle pointing from center toward the arc at the current value
const needleAngle = angleScale(value);
const nsa = Math.sin(needleAngle);
const nca = Math.cos(needleAngle);
const needleLen = (innerR + outerR) * 0.52;
const halfBase = 14;
// Direction vector: (nsa, -nca); perpendicular: (nca, nsa)
const tipX = nsa * needleLen;
const tipY = -nca * needleLen;
const bx = nca * halfBase;
const by = nsa * halfBase;

g.append("path")
  .attr("d", `M ${bx},${by} L ${tipX},${tipY} L ${-bx},${-by} Z`)
  .attr("fill", t.ink);

// Pivot circles
g.append("circle").attr("r", 22).attr("fill", t.ink);
g.append("circle").attr("r", 9).attr("fill", t.pageBg);

// Value display
svg.append("text")
  .attr("x", cx).attr("y", cy + 68)
  .attr("text-anchor", "middle")
  .attr("dominant-baseline", "hanging")
  .attr("fill", t.ink)
  .style("font-size", "88px")
  .style("font-weight", "700")
  .text(`${value}%`);

// Metric label
svg.append("text")
  .attr("x", cx).attr("y", cy + 192)
  .attr("text-anchor", "middle")
  .attr("dominant-baseline", "hanging")
  .attr("fill", t.inkSoft)
  .style("font-size", "30px")
  .style("font-weight", "500")
  .text("Project Completion");

// Zone legend
const legendDefs = [
  { color: t.palette[4], label: "Behind (<33%)" },
  { color: t.amber, label: "On Track (33–67%)" },
  { color: t.palette[0], label: "Ahead (>67%)" },
];
const lItemW = 230;
const lStartX = cx - (lItemW * (legendDefs.length - 1)) / 2;
const lY = cy + 312;

legendDefs.forEach((item, i) => {
  const lx = lStartX + i * lItemW;
  svg.append("circle")
    .attr("cx", lx).attr("cy", lY)
    .attr("r", 11).attr("fill", item.color);
  svg.append("text")
    .attr("x", lx + 20).attr("y", lY)
    .attr("dominant-baseline", "middle")
    .attr("fill", t.inkSoft)
    .style("font-size", "22px")
    .text(item.label);
});

// Title
svg.append("text")
  .attr("x", cx).attr("y", 48)
  .attr("text-anchor", "middle")
  .attr("fill", t.ink)
  .style("font-size", "22px")
  .style("font-weight", "600")
  .text("gauge-basic · javascript · d3 · anyplot.ai");
Runnable source as JSON, for any HTTP client: https://api.anyplot.ai/specs/gauge-basic/d3/code. Any spec id and library id listed in llms-full.txt fit the same URL shape; every URL below is complete and callable.
{
  "spec_id": "gauge-basic",
  "language": "javascript",
  "library": "d3",
  "page": "https://anyplot.ai/gauge-basic/javascript/d3",
  "hub": "https://anyplot.ai/gauge-basic",
  "code_json": "https://api.anyplot.ai/specs/gauge-basic/d3/code",
  "spec_json": "https://api.anyplot.ai/specs/gauge-basic",
  "render_light_png": "https://storage.googleapis.com/anyplot-images/plots/gauge-basic/javascript/d3/plot-light.png",
  "render_dark_png": "https://storage.googleapis.com/anyplot-images/plots/gauge-basic/javascript/d3/plot-dark.png",
  "interactive_light_html": "https://storage.googleapis.com/anyplot-images/plots/gauge-basic/javascript/d3/plot-light.html",
  "interactive_dark_html": "https://storage.googleapis.com/anyplot-images/plots/gauge-basic/javascript/d3/plot-dark.html",
  "quality_score": 93.0,
  "license": "MIT",
  "guide": "https://anyplot.ai/llms.txt"
}
Part of Basic Gauge Chart on anyplot.ai.