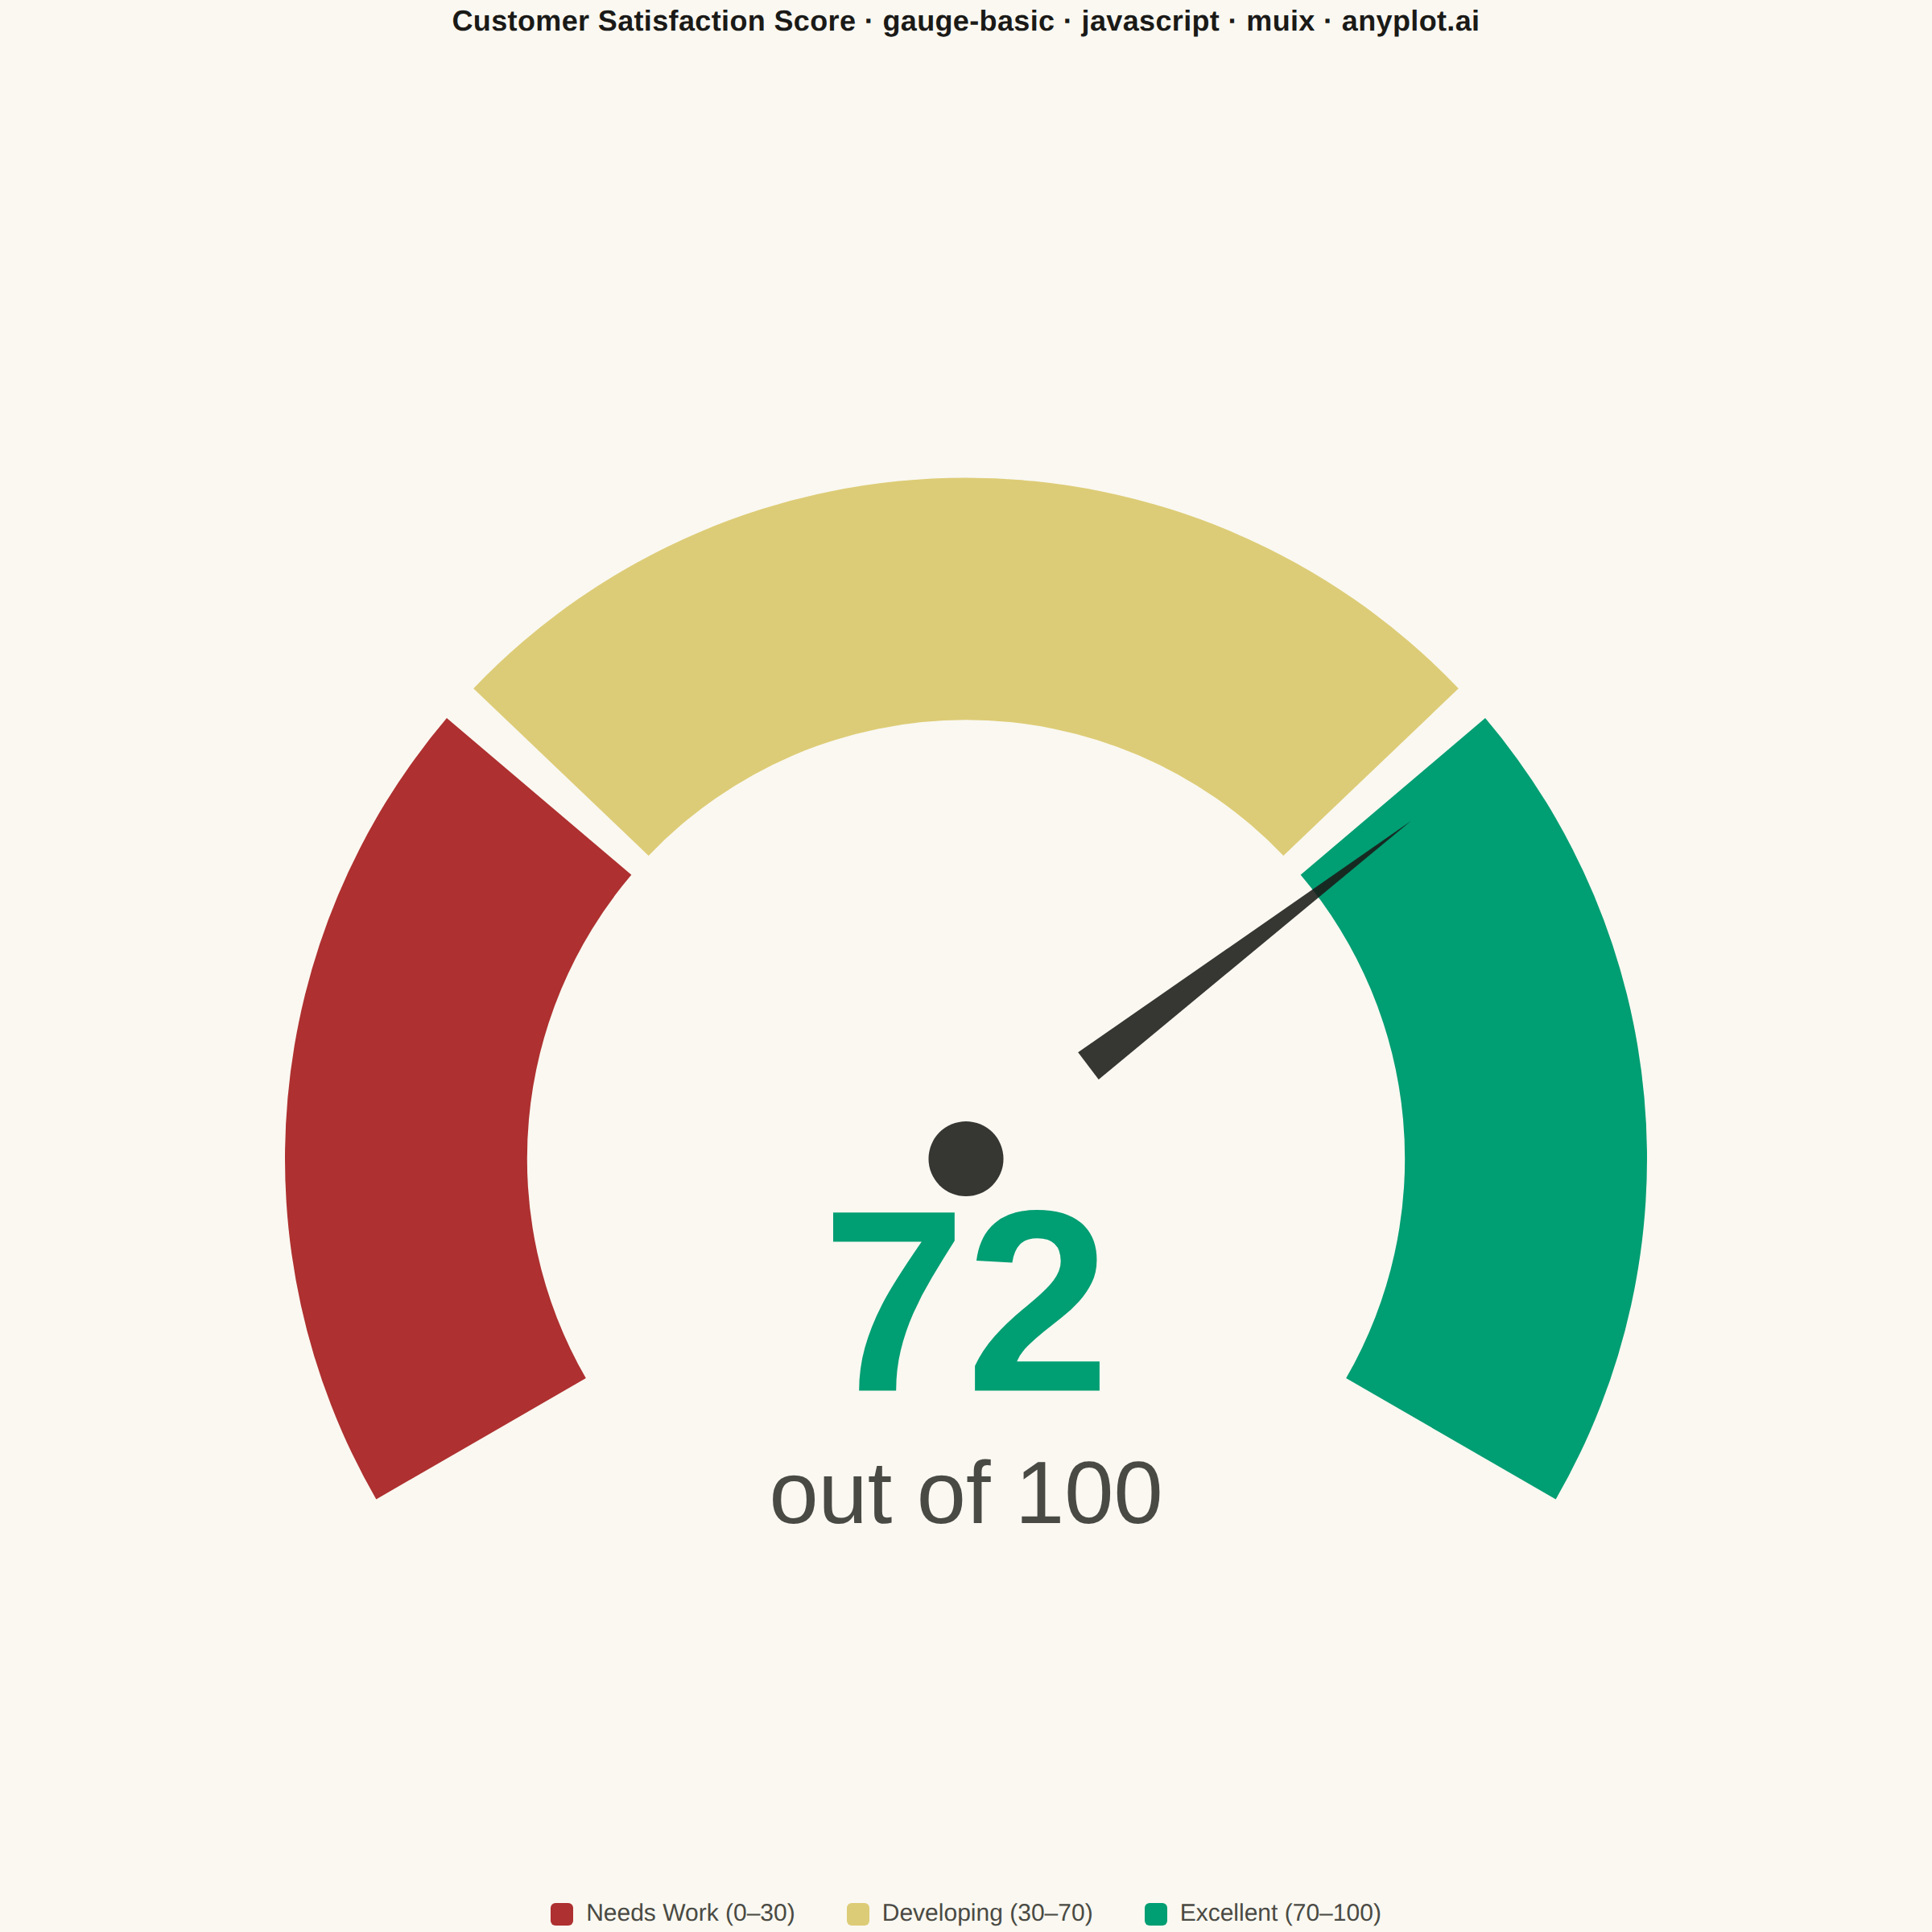
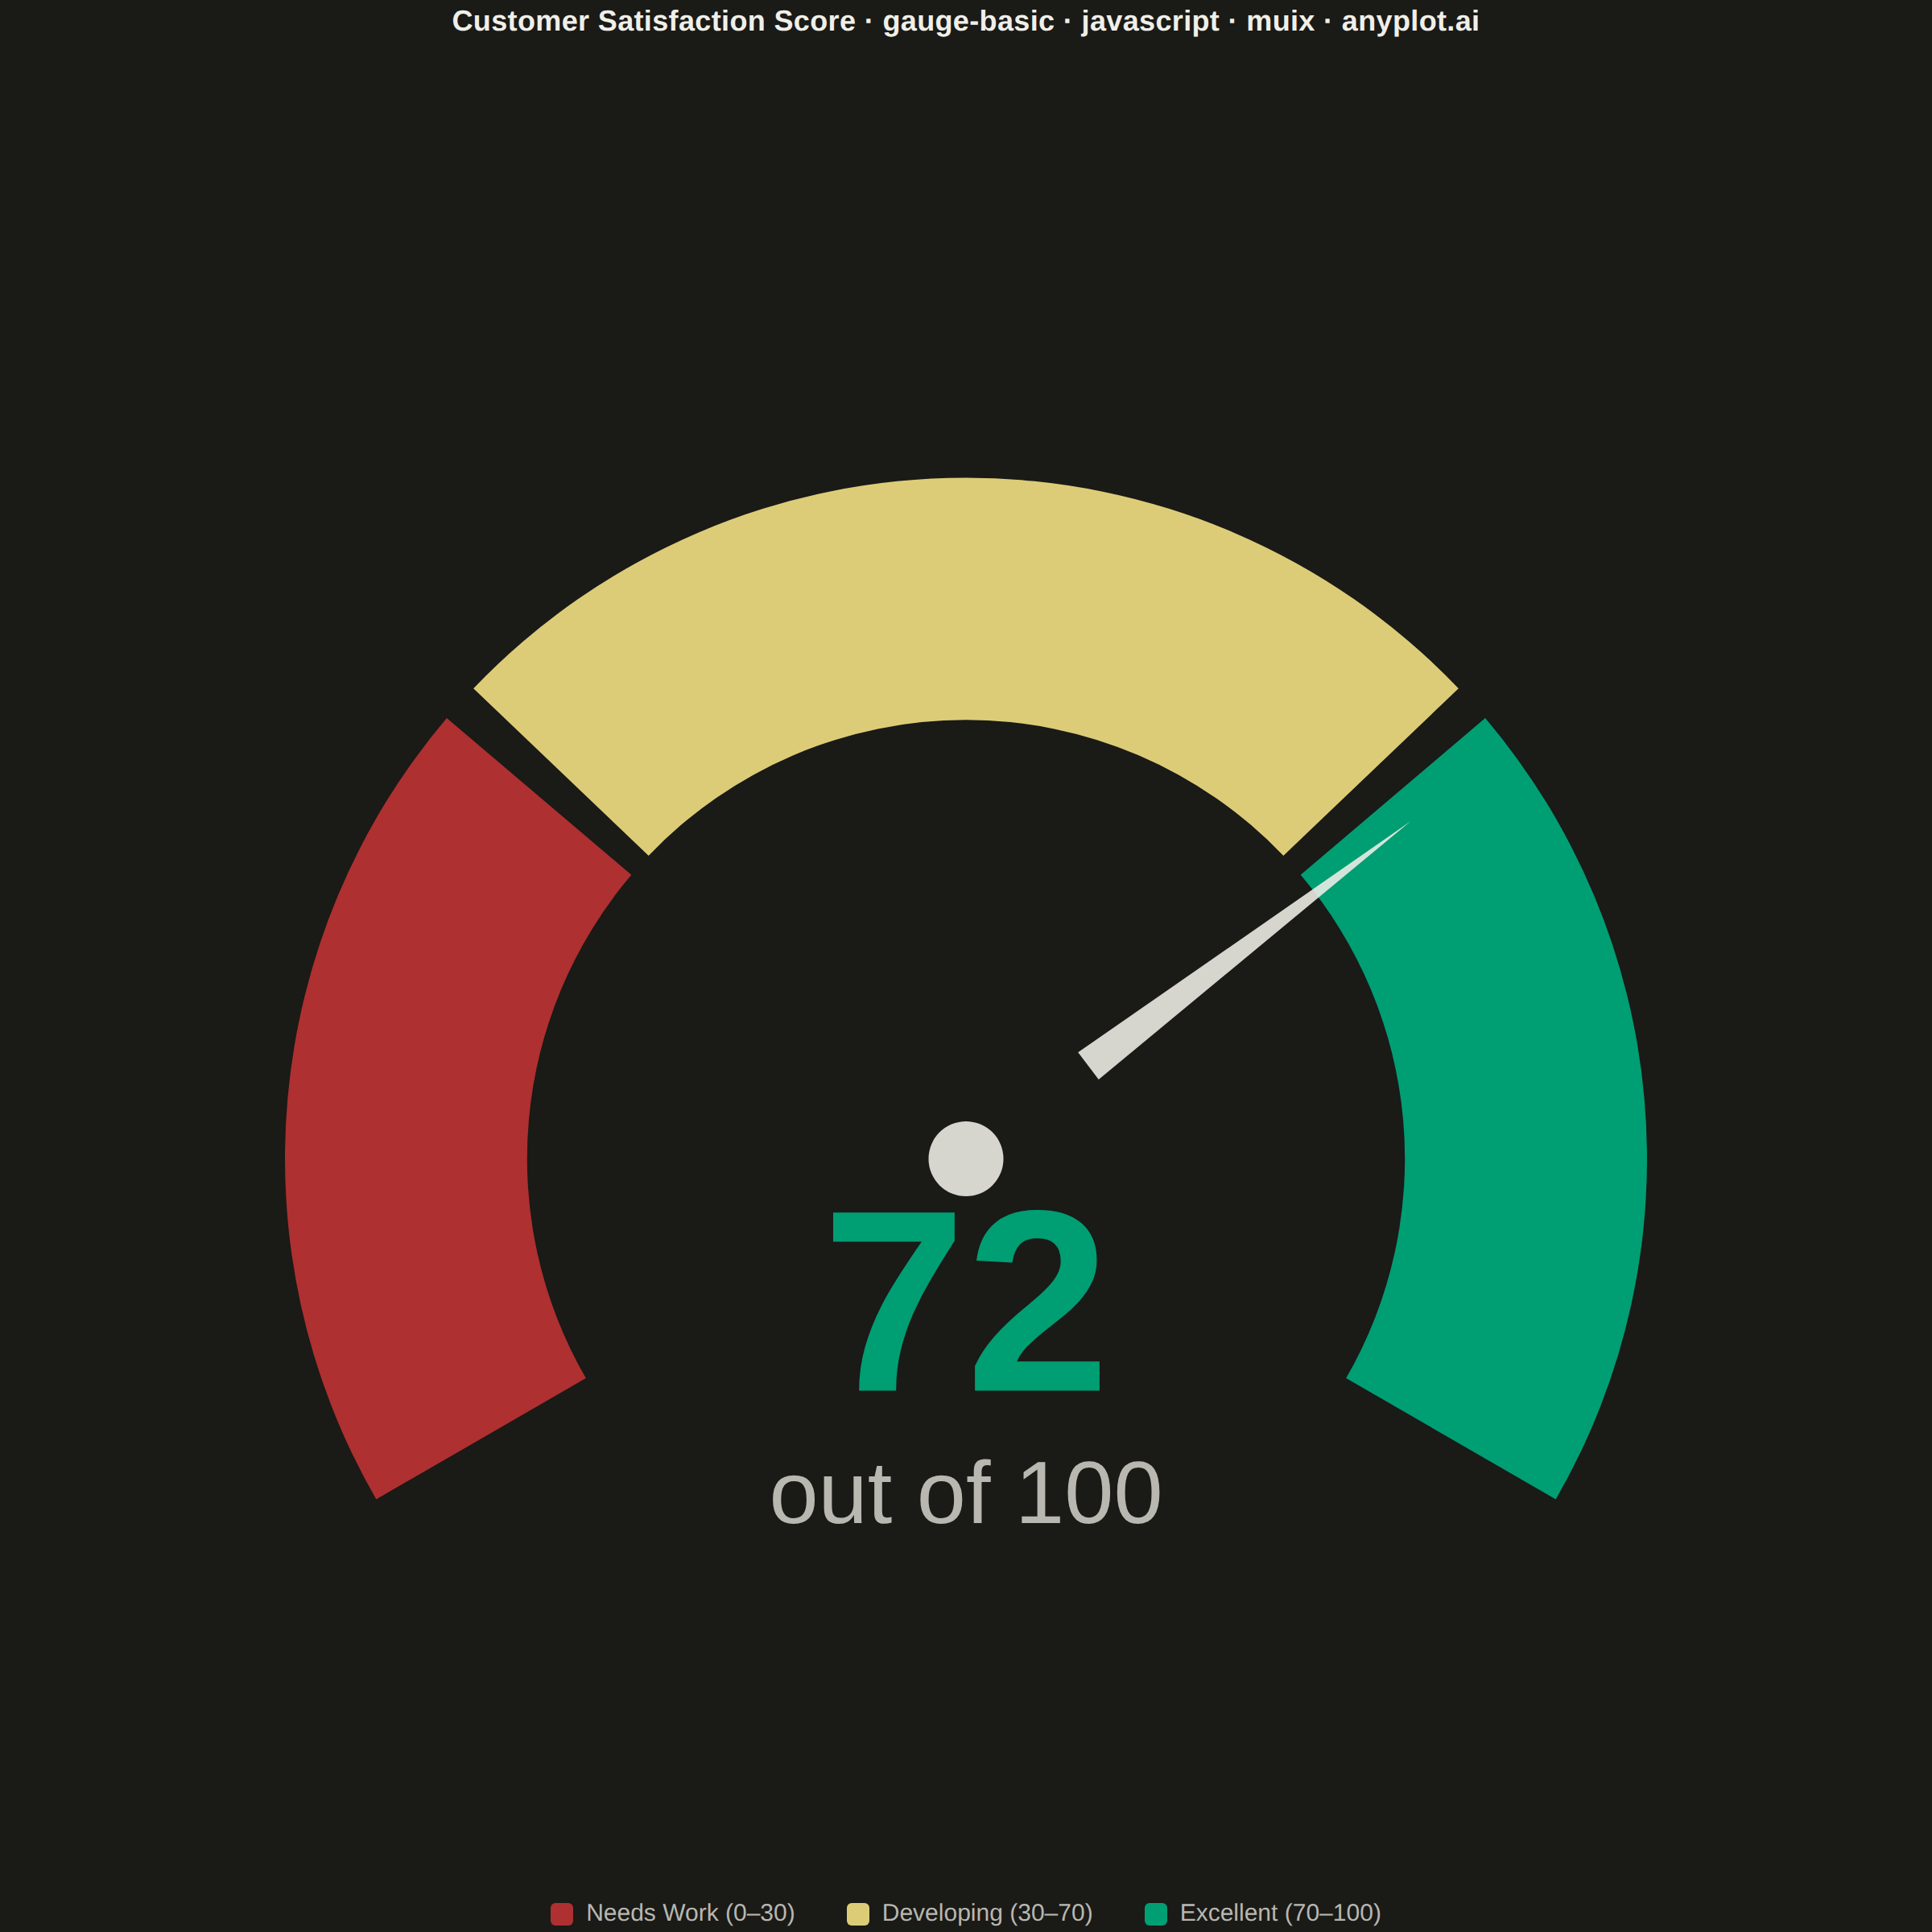
The same plot in 14 other libraries — JavaScript: Chart.js, D3.js, Apache ECharts, Highcharts; Python: Altair, Bokeh, lets-plot, Matplotlib, Plotly, plotnine, Pygal, Seaborn; R: ggplot2; Julia: Makie.jl. Compare all 15 side by side: Basic Gauge Chart in Python, R, Julia and JavaScript.
A gauge chart (also known as a speedometer chart) displays a single value within a defined range using a semi-circular or circular dial. It is ideal for showing progress toward a goal, performance metrics, or any KPI that needs to be evaluated against minimum and maximum bounds. The visual metaphor of a speedometer makes it intuitive to quickly assess whether a value is in an acceptable range.
// anyplot.ai
// gauge-basic: Basic Gauge Chart
// Library: muix 7.29.1 | JavaScript 22.23.0
// Quality: 90/100 | Created: 2026-06-30
//# anyplot-orientation: square
// anyplot.ai
// gauge-basic: Basic Gauge Chart
// Library: MUI X Charts | React | Node 22
// License: @mui/x-charts — MIT (community). Pro/Premium are out of scope.
// Quality: pending | Created: 2026-06-30

import {
  GaugeContainer,
  useGaugeState,
} from "@mui/x-charts/Gauge";
import { Box, Typography } from "@mui/material";

const t = window.ANYPLOT_TOKENS;

// Customer satisfaction score — 0–100 scale, zones at 30 and 70
const score = 72;
const VALUE_MIN = 0;
const VALUE_MAX = 100;
const LOW_THRESHOLD = 30;
const HIGH_THRESHOLD = 70;

// Imprint semantic colors: red=poor, amber=fair, green=good
const COLOR_POOR = t.palette[4]; // #AE3030
const COLOR_FAIR = t.amber;      // #DDCC77
const COLOR_GOOD = t.palette[0]; // #009E73 — brand green

const scoreColor =
  score < LOW_THRESHOLD
    ? COLOR_POOR
    : score < HIGH_THRESHOLD
    ? COLOR_FAIR
    : COLOR_GOOD;

// Gauge arc geometry (degrees — MUI X convention)
const START_DEG = -120;
const END_DEG = 120;
const START_RAD = (START_DEG * Math.PI) / 180;
const TOTAL_RAD = ((END_DEG - START_DEG) * Math.PI) / 180;

// SVG annular sector path (angles in radians, MUI X convention: 0=top, CW)
function sectorPath(cx, cy, innerR, outerR, s, e) {
  const la = e - s > Math.PI ? 1 : 0;
  const x1 = cx + outerR * Math.sin(s);
  const y1 = cy - outerR * Math.cos(s);
  const x2 = cx + outerR * Math.sin(e);
  const y2 = cy - outerR * Math.cos(e);
  const x3 = cx + innerR * Math.sin(e);
  const y3 = cy - innerR * Math.cos(e);
  const x4 = cx + innerR * Math.sin(s);
  const y4 = cy - innerR * Math.cos(s);
  return `M${x1},${y1} A${outerR},${outerR} 0 ${la},1 ${x2},${y2} L${x3},${y3} A${innerR},${innerR} 0 ${la},0 ${x4},${y4} Z`;
}

// Zone arcs drawn inside GaugeContainer — has access to gauge geometry via hook
function ZoneArcs() {
  const { cx, cy, outerRadius, innerRadius } = useGaugeState();
  const lowFrac = LOW_THRESHOLD / VALUE_MAX;
  const highFrac = HIGH_THRESHOLD / VALUE_MAX;
  const gapRad = TOTAL_RAD * 0.007; // thin gap between zones

  const z1S = START_RAD;
  const z1E = START_RAD + TOTAL_RAD * lowFrac - gapRad;
  const z2S = START_RAD + TOTAL_RAD * lowFrac + gapRad;
  const z2E = START_RAD + TOTAL_RAD * highFrac - gapRad;
  const z3S = START_RAD + TOTAL_RAD * highFrac + gapRad;
  const z3E = START_RAD + TOTAL_RAD;

  return (
    <g>
      <path d={sectorPath(cx, cy, innerRadius, outerRadius, z1S, z1E)} fill={COLOR_POOR} />
      <path d={sectorPath(cx, cy, innerRadius, outerRadius, z2S, z2E)} fill={COLOR_FAIR} />
      <path d={sectorPath(cx, cy, innerRadius, outerRadius, z3S, z3E)} fill={COLOR_GOOD} />
    </g>
  );
}

// Custom needle + score label rendered inside the gauge SVG
function NeedleAndLabel() {
  const { cx, cy, outerRadius, innerRadius, value } = useGaugeState();
  const frac = (value - VALUE_MIN) / (VALUE_MAX - VALUE_MIN);
  const angleRad = START_RAD + TOTAL_RAD * frac;
  const needleLen = outerRadius * 0.82;
  const tipX = cx + needleLen * Math.sin(angleRad);
  const tipY = cy - needleLen * Math.cos(angleRad);
  const perp = angleRad + Math.PI / 2;
  const baseW = Math.max(4, outerRadius * 0.025);
  const baseR = innerRadius * 0.35;
  const b1x = cx + baseR * Math.sin(angleRad) + baseW * Math.sin(perp);
  const b1y = cy - baseR * Math.cos(angleRad) - baseW * Math.cos(perp);
  const b2x = cx + baseR * Math.sin(angleRad) - baseW * Math.sin(perp);
  const b2y = cy - baseR * Math.cos(angleRad) + baseW * Math.cos(perp);

  return (
    <g>
      {/* Needle */}
      <polygon
        points={`${tipX},${tipY} ${b1x},${b1y} ${b2x},${b2y}`}
        fill={t.ink}
        opacity={0.88}
      />
      {/* Center cap */}
      <circle cx={cx} cy={cy} r={outerRadius * 0.055} fill={t.ink} opacity={0.88} />
      {/* Score */}
      <text
        x={cx}
        y={cy + outerRadius * 0.24}
        textAnchor="middle"
        dominantBaseline="middle"
        style={{
          fontSize: outerRadius * 0.38,
          fontWeight: 700,
          fill: scoreColor,
          fontFamily: "Roboto, sans-serif",
        }}
      >
        {value}
      </text>
      <text
        x={cx}
        y={cy + outerRadius * 0.50}
        textAnchor="middle"
        dominantBaseline="middle"
        style={{
          fontSize: outerRadius * 0.13,
          fill: t.inkSoft,
          fontFamily: "Roboto, sans-serif",
        }}
      >
        out of {VALUE_MAX}
      </text>
    </g>
  );
}

export default function Chart() {
  const { width, height } = window.ANYPLOT_SIZE;
  const gaugeW = width * 0.8;
  const gaugeH = height * 0.62;

  // Title: "Customer Satisfaction Score · gauge-basic · javascript · muix · anyplot.ai" = 80 chars
  // Scale: round(22 × 67/80) = round(18.43) = 18 px
  const titleFontSize = Math.round(22 * (67 / 80));

  const zones = [
    { label: "Needs Work", range: "0–30", color: COLOR_POOR },
    { label: "Developing", range: "30–70", color: COLOR_FAIR },
    { label: "Excellent",  range: "70–100", color: COLOR_GOOD },
  ];

  return (
    <Box
      sx={{
        width,
        height,
        bgcolor: t.pageBg,
        display: "flex",
        flexDirection: "column",
        alignItems: "center",
        justifyContent: "center",
      }}
    >
      {/* Mandatory title */}
      <Typography
        sx={{
          color: t.ink,
          fontSize: titleFontSize,
          fontWeight: 600,
          letterSpacing: "0.01em",
          mb: 1,
          textAlign: "center",
          px: 2,
        }}
      >
        Customer Satisfaction Score · gauge-basic · javascript · muix · anyplot.ai
      </Typography>

      {/* Gauge */}
      <GaugeContainer
        width={gaugeW}
        height={gaugeH}
        value={score}
        valueMin={VALUE_MIN}
        valueMax={VALUE_MAX}
        startAngle={START_DEG}
        endAngle={END_DEG}
        innerRadius="58%"
        outerRadius="90%"
        skipAnimation
      >
        <ZoneArcs />
        <NeedleAndLabel />
      </GaugeContainer>

      {/* Zone legend */}
      <Box sx={{ display: "flex", gap: 4, mt: 1 }}>
        {zones.map(({ label, range, color }) => (
          <Box key={label} sx={{ display: "flex", alignItems: "center", gap: 1 }}>
            <Box
              sx={{
                width: 14,
                height: 14,
                borderRadius: "3px",
                bgcolor: color,
                flexShrink: 0,
              }}
            />
            <Typography sx={{ color: t.inkSoft, fontSize: 15 }}>
              {label} ({range})
            </Typography>
          </Box>
        ))}
      </Box>
    </Box>
  );
}
Runnable source as JSON, for any HTTP client: https://api.anyplot.ai/specs/gauge-basic/muix/code. Any spec id and library id listed in llms-full.txt fit the same URL shape; every URL below is complete and callable.
{
  "spec_id": "gauge-basic",
  "language": "javascript",
  "library": "muix",
  "page": "https://anyplot.ai/gauge-basic/javascript/muix",
  "hub": "https://anyplot.ai/gauge-basic",
  "code_json": "https://api.anyplot.ai/specs/gauge-basic/muix/code",
  "spec_json": "https://api.anyplot.ai/specs/gauge-basic",
  "render_light_png": "https://storage.googleapis.com/anyplot-images/plots/gauge-basic/javascript/muix/plot-light.png",
  "render_dark_png": "https://storage.googleapis.com/anyplot-images/plots/gauge-basic/javascript/muix/plot-dark.png",
  "interactive_light_html": "https://storage.googleapis.com/anyplot-images/plots/gauge-basic/javascript/muix/plot-light.html",
  "interactive_dark_html": "https://storage.googleapis.com/anyplot-images/plots/gauge-basic/javascript/muix/plot-dark.html",
  "quality_score": 90.0,
  "license": "MIT",
  "guide": "https://anyplot.ai/llms.txt"
}
Part of Basic Gauge Chart on anyplot.ai.