The same plot in 14 other libraries — JavaScript: D3.js, Apache ECharts, Highcharts, MUI X Charts; Python: Altair, Bokeh, lets-plot, Matplotlib, Plotly, plotnine, Pygal, Seaborn; R: ggplot2; Julia: Makie.jl. Compare all 15 side by side: Annotated Heatmap in Python, R, Julia and JavaScript.
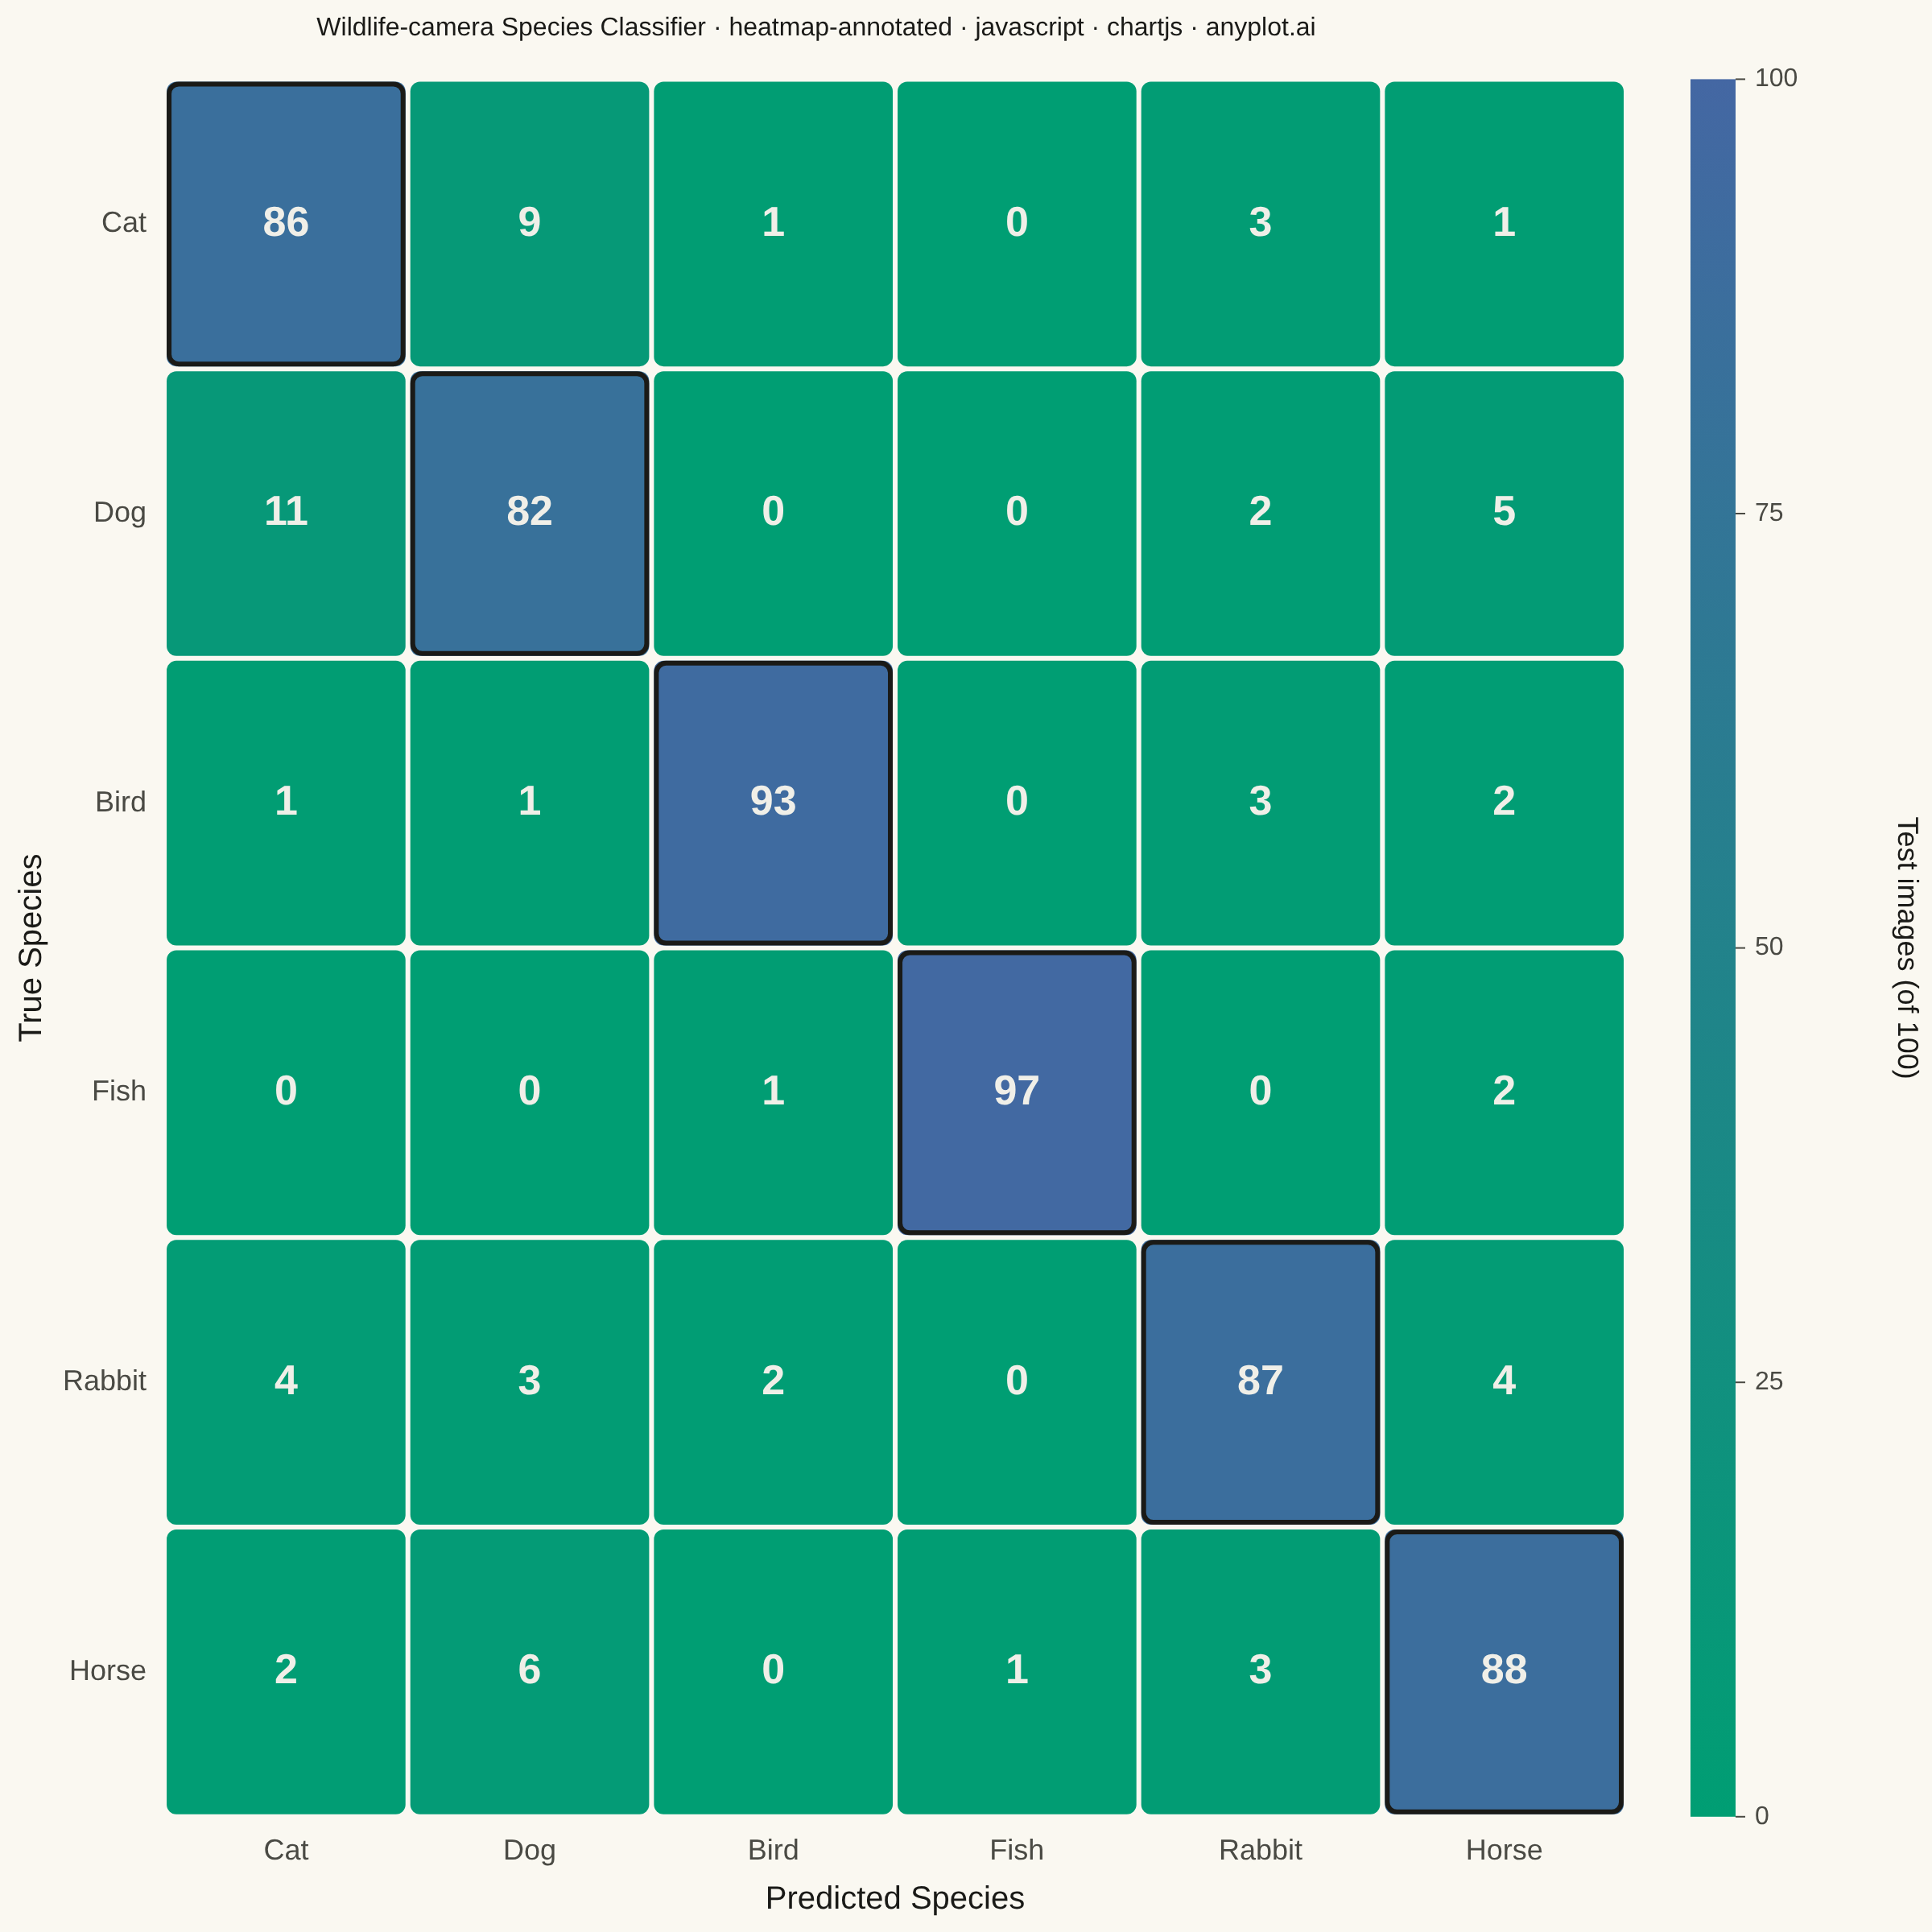
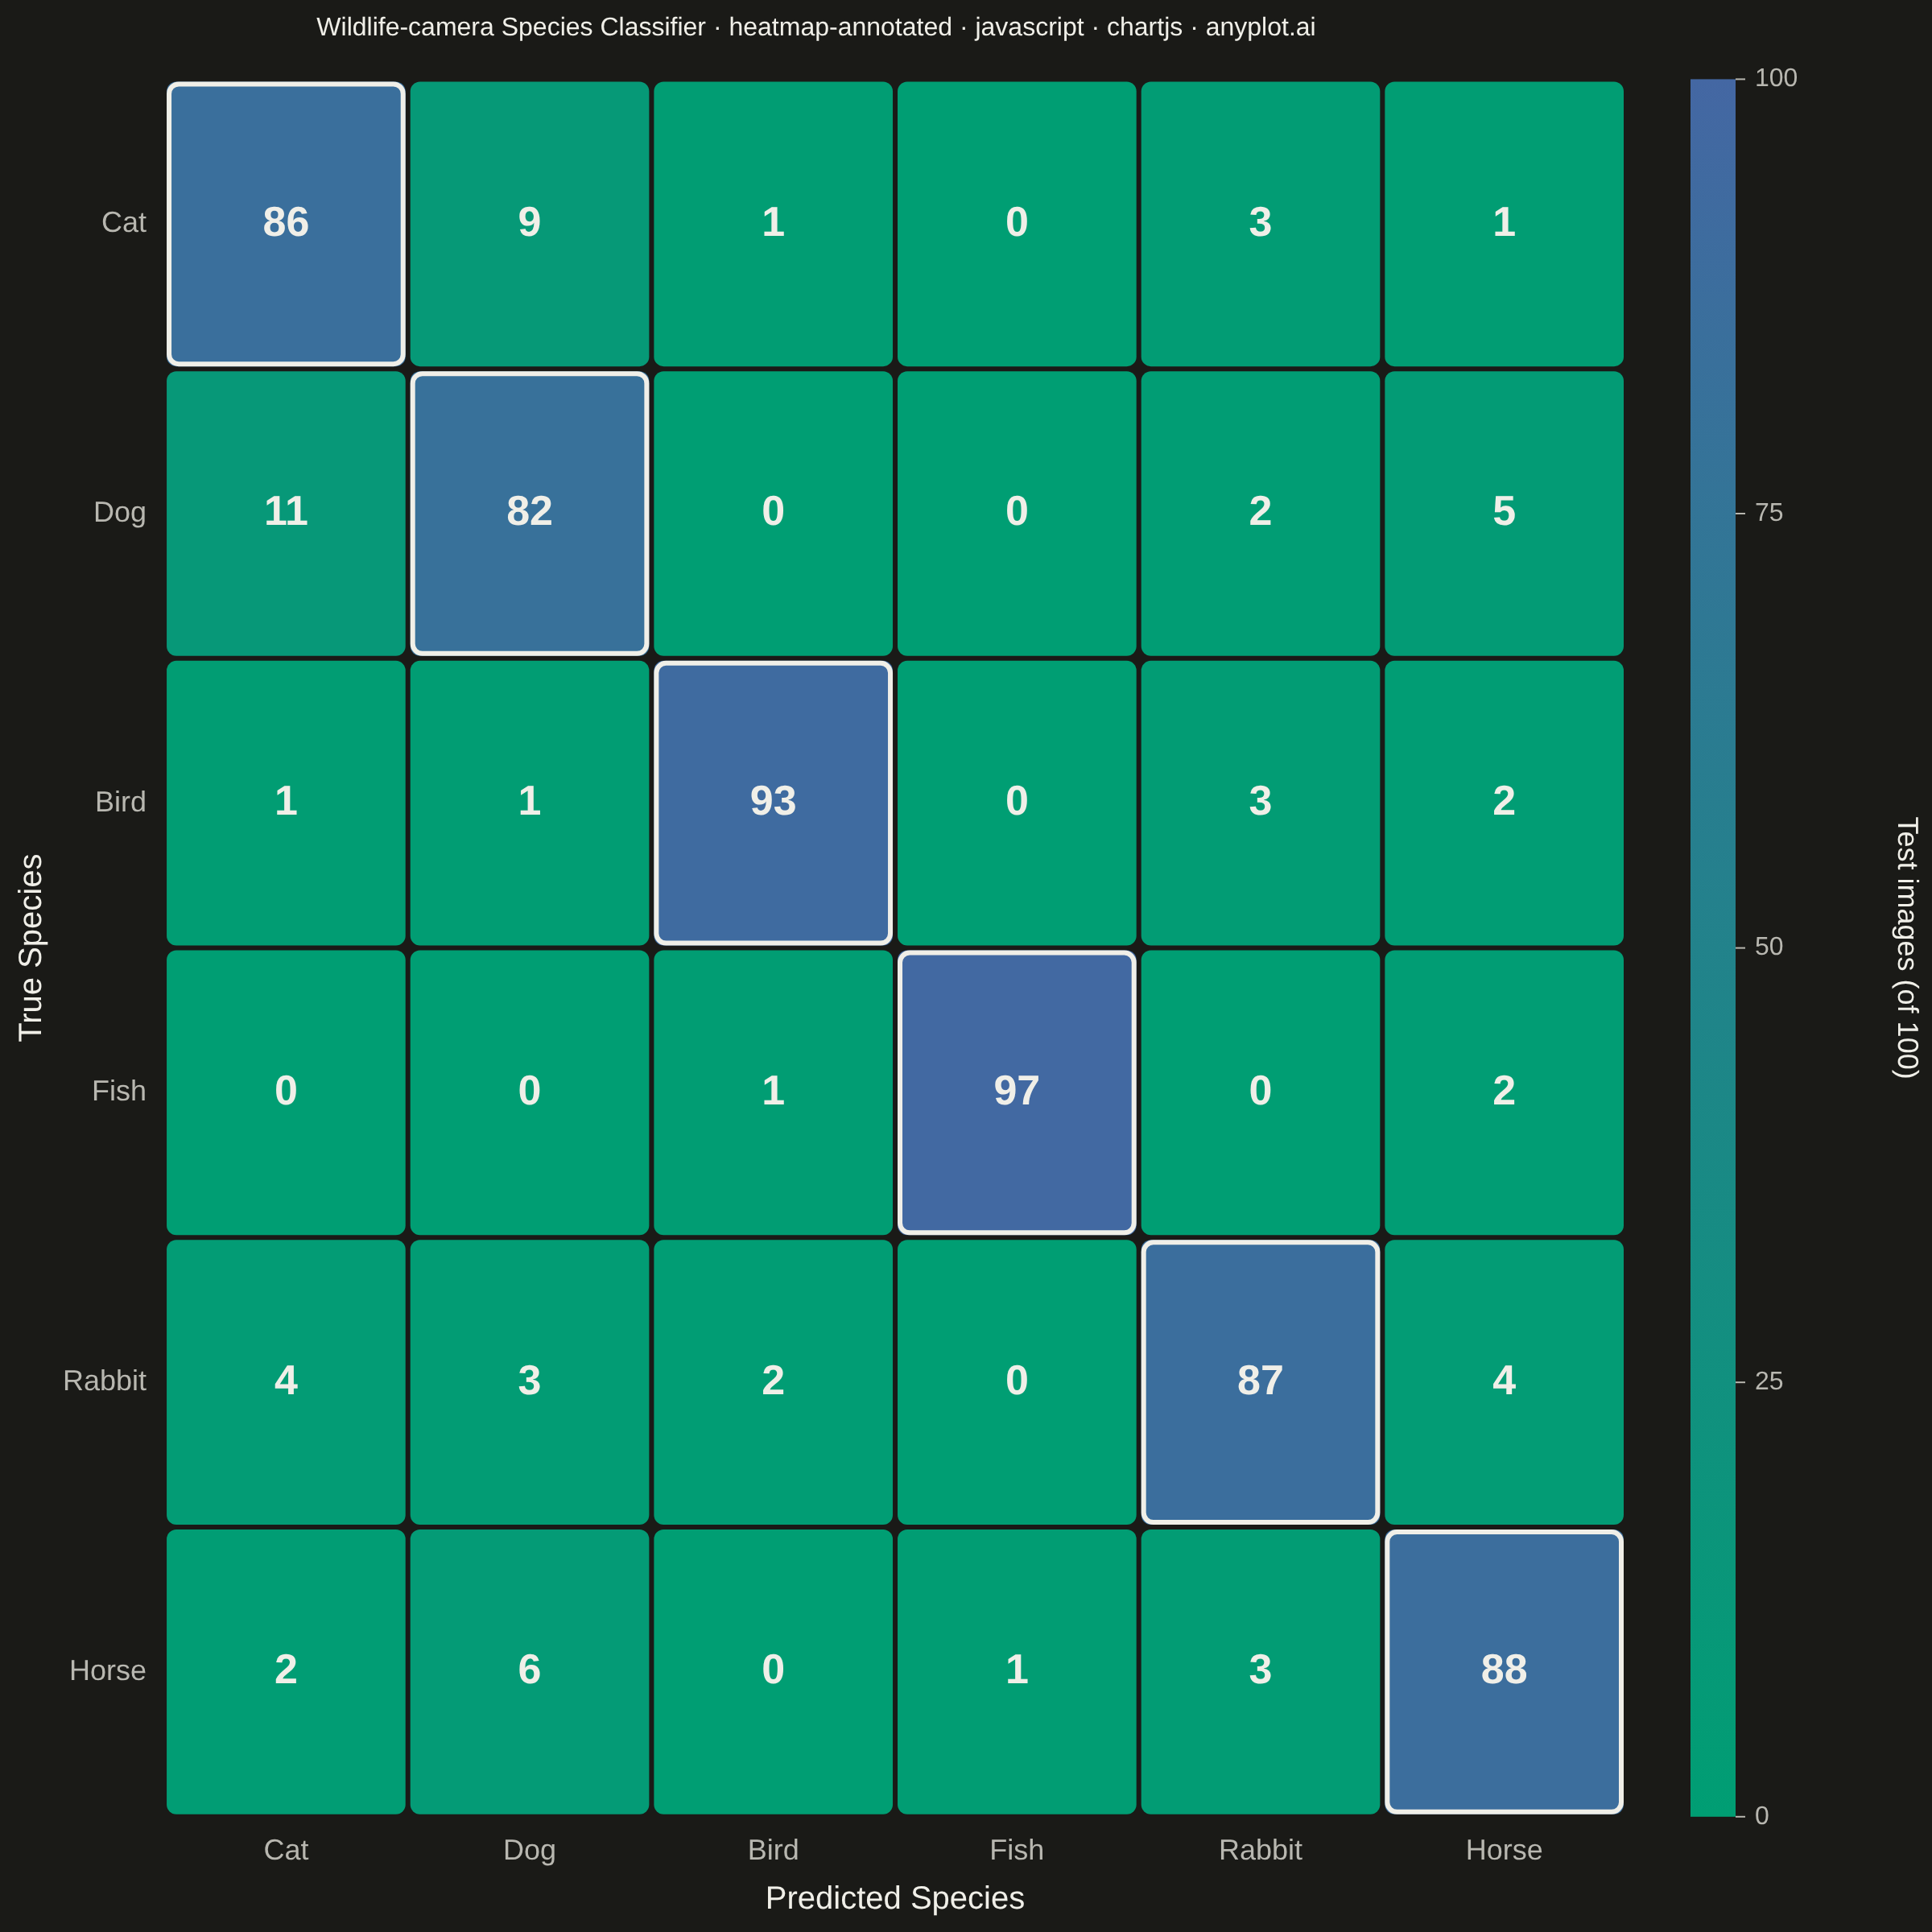
A heatmap with numeric values displayed inside each cell, combining color intensity with exact value labels. Essential for correlation matrices, confusion matrices, and any matrix visualization where both pattern recognition and precise values matter. Text color automatically contrasts with background for readability.
// anyplot.ai
// heatmap-annotated: Annotated Heatmap
// Library: chartjs 4.4.7 | JavaScript 22.23.1
// Quality: 90/100 | Created: 2026-08-05
//# anyplot-orientation: square

const t = window.ANYPLOT_TOKENS;

// --- Data --------------------------------------------------------------------
// Confusion matrix for a 6-class wildlife-camera species classifier. Each row
// is 100 held-out test images of the true species; columns are the model's
// predicted species. Counts are single-polarity (0-100) -> imprint_seq.
const species = ["Cat", "Dog", "Bird", "Fish", "Rabbit", "Horse"];
const N = species.length;
// Off-diagonal noise concentrates on visually/behaviorally similar pairs
// (Cat<->Dog, Bird<->Rabbit, Dog<->Horse) rather than dissimilar species.
const matrix = [
  [86, 9, 1, 0, 3, 1],
  [11, 82, 0, 0, 2, 5],
  [1, 1, 93, 0, 3, 2],
  [0, 0, 1, 97, 0, 2],
  [4, 3, 2, 0, 87, 4],
  [2, 6, 0, 1, 3, 88],
];

// --- imprint_seq interpolation (brand green -> blue) --------------------------
function hexToRgb(hex) {
  const h = hex.replace("#", "");
  return [
    parseInt(h.slice(0, 2), 16),
    parseInt(h.slice(2, 4), 16),
    parseInt(h.slice(4, 6), 16),
  ];
}
const SEQ_LO = hexToRgb(t.seq[0]);
const SEQ_HI = hexToRgb(t.seq[1]);
function seqRgb(ratio) {
  const u = Math.max(0, Math.min(1, ratio));
  return [0, 1, 2].map((i) => Math.round(SEQ_LO[i] + (SEQ_HI[i] - SEQ_LO[i]) * u));
}

// WCAG relative luminance -> pick fixed dark/light annotation text so each
// cell's number stays readable regardless of how saturated its fill is. Data
// colors are identical in both themes, so the text color choice is too.
const TEXT_ON_DARK_FILL = "#F0EFE8";
const TEXT_ON_LIGHT_FILL = "#1A1A17";
function relativeLuminance([r, g, b]) {
  const lin = [r, g, b].map((c) => {
    const s = c / 255;
    return s <= 0.03928 ? s / 12.92 : Math.pow((s + 0.055) / 1.055, 2.4);
  });
  return 0.2126 * lin[0] + 0.7152 * lin[1] + 0.0722 * lin[2];
}
function textColorFor(rgb) {
  return relativeLuminance(rgb) > 0.42 ? TEXT_ON_LIGHT_FILL : TEXT_ON_DARK_FILL;
}

const FONT_STACK =
  '-apple-system, BlinkMacSystemFont, "Segoe UI", Roboto, Helvetica, Arial, sans-serif';

// --- Custom Chart.js plugin ----------------------------------------------------
// Paints heatmap cells, writes per-cell counts, outlines the diagonal (correct
// predictions), and renders a vertical colorbar in the right-side padding
// reserved via options.layout.padding.
const CELL_GAP = 3;
const CELL_RADIUS = 6;

const heatmapPainter = {
  id: "heatmap-annotated-painter",
  beforeDatasetsDraw(chart) {
    const { ctx, chartArea } = chart;
    const { left, right, top, bottom } = chartArea;
    const cellW = (right - left) / N;
    const cellH = (bottom - top) / N;

    // Inset rounded-rect cells (small gap between cells) rather than an
    // edge-to-edge flat fill, so the fill itself carries visual refinement.
    for (let r = 0; r < N; r++) {
      for (let c = 0; c < N; c++) {
        const [rr, gg, bb] = seqRgb(matrix[r][c] / 100);
        ctx.fillStyle = `rgb(${rr},${gg},${bb})`;
        ctx.beginPath();
        ctx.roundRect(
          left + c * cellW + CELL_GAP / 2,
          top + r * cellH + CELL_GAP / 2,
          cellW - CELL_GAP,
          cellH - CELL_GAP,
          CELL_RADIUS,
        );
        ctx.fill();
      }
    }

    // Diagonal outline — correctly classified samples, the natural focal
    // structure of a confusion matrix.
    ctx.save();
    ctx.strokeStyle = t.ink;
    ctx.lineWidth = 3;
    for (let i = 0; i < N; i++) {
      ctx.beginPath();
      ctx.roundRect(
        left + i * cellW + CELL_GAP / 2 + 1.5,
        top + i * cellH + CELL_GAP / 2 + 1.5,
        cellW - CELL_GAP - 3,
        cellH - CELL_GAP - 3,
        CELL_RADIUS,
      );
      ctx.stroke();
    }
    ctx.restore();
  },
  afterDatasetsDraw(chart) {
    const { ctx, chartArea, width } = chart;
    const { left, right, top, bottom } = chartArea;
    const cellW = (right - left) / N;
    const cellH = (bottom - top) / N;

    // Per-cell annotations, contrast picked from the fill's own luminance.
    ctx.save();
    ctx.textAlign = "center";
    ctx.textBaseline = "middle";
    ctx.font = `600 26px ${FONT_STACK}`;
    for (let r = 0; r < N; r++) {
      for (let c = 0; c < N; c++) {
        ctx.fillStyle = textColorFor(seqRgb(matrix[r][c] / 100));
        ctx.fillText(
          String(matrix[r][c]),
          left + (c + 0.5) * cellW,
          top + (r + 0.5) * cellH,
        );
      }
    }
    ctx.restore();

    // Colorbar — vertical gradient in the right-side padding.
    const cbGap = 40;
    const cbW = 28;
    const cbLeft = right + cbGap;
    const cbTop = top;
    const cbBottom = bottom;
    const cbH = cbBottom - cbTop;

    const [hiR, hiG, hiB] = seqRgb(1);
    const [loR, loG, loB] = seqRgb(0);
    const grad = ctx.createLinearGradient(0, cbTop, 0, cbBottom);
    grad.addColorStop(0, `rgb(${hiR},${hiG},${hiB})`);
    grad.addColorStop(1, `rgb(${loR},${loG},${loB})`);
    ctx.fillStyle = grad;
    ctx.fillRect(cbLeft, cbTop, cbW, cbH);

    ctx.save();
    ctx.font = `400 16px ${FONT_STACK}`;
    ctx.fillStyle = t.inkSoft;
    ctx.strokeStyle = t.inkSoft;
    ctx.lineWidth = 1;
    ctx.textAlign = "left";
    ctx.textBaseline = "middle";
    for (const v of [100, 75, 50, 25, 0]) {
      const y = cbTop + (1 - v / 100) * cbH;
      ctx.beginPath();
      ctx.moveTo(cbLeft + cbW, y);
      ctx.lineTo(cbLeft + cbW + 6, y);
      ctx.stroke();
      ctx.fillText(String(v), cbLeft + cbW + 12, y);
    }
    ctx.restore();

    ctx.save();
    ctx.fillStyle = t.ink;
    ctx.font = `500 18px ${FONT_STACK}`;
    ctx.textAlign = "center";
    ctx.textBaseline = "middle";
    ctx.translate(width - 16, (cbTop + cbBottom) / 2);
    ctx.rotate(Math.PI / 2);
    ctx.fillText("Test images (of 100)", 0, 0);
    ctx.restore();
  },
};

// --- Mount ---------------------------------------------------------------------
const canvas = document.createElement("canvas");
document.getElementById("container").appendChild(canvas);

// --- Chart -----------------------------------------------------------------
// scatter base purely for axis layout (no points drawn); cells, annotations,
// and colorbar are rendered by heatmapPainter against the resolved chartArea.
const TITLE =
  "Wildlife-camera Species Classifier · heatmap-annotated · javascript · chartjs · anyplot.ai";
const TITLE_FONT = TITLE.length > 67 ? Math.max(15, Math.round((22 * 67) / TITLE.length)) : 22;

new Chart(canvas, {
  type: "scatter",
  data: { datasets: [{ data: [], pointRadius: 0 }] },
  plugins: [heatmapPainter],
  options: {
    responsive: true,
    maintainAspectRatio: false,
    animation: false,
    layout: { padding: { top: 4, right: 190, bottom: 4, left: 4 } },
    plugins: {
      title: {
        display: true,
        text: TITLE,
        color: t.ink,
        font: { size: TITLE_FONT, weight: "500" },
        padding: { top: 4, bottom: 22 },
      },
      legend: { display: false },
      tooltip: { enabled: false },
    },
    scales: {
      x: {
        type: "linear",
        min: -0.5,
        max: N - 0.5,
        position: "bottom",
        offset: false,
        afterBuildTicks: (axis) => {
          axis.ticks = Array.from({ length: N }, (_, i) => ({ value: i }));
        },
        ticks: {
          color: t.inkSoft,
          font: { size: 18 },
          autoSkip: false,
          callback: (v) => (Number.isInteger(v) && v >= 0 && v < N ? species[v] : ""),
        },
        title: { display: true, text: "Predicted Species", color: t.ink, font: { size: 20 } },
        grid: { display: false },
        border: { display: false },
      },
      y: {
        type: "linear",
        min: -0.5,
        max: N - 0.5,
        reverse: true,
        offset: false,
        afterBuildTicks: (axis) => {
          axis.ticks = Array.from({ length: N }, (_, i) => ({ value: i }));
        },
        ticks: {
          color: t.inkSoft,
          font: { size: 18 },
          autoSkip: false,
          callback: (v) => (Number.isInteger(v) && v >= 0 && v < N ? species[v] : ""),
        },
        title: { display: true, text: "True Species", color: t.ink, font: { size: 20 } },
        grid: { display: false },
        border: { display: false },
      },
    },
  },
});
Runnable source as JSON, for any HTTP client: https://api.anyplot.ai/specs/heatmap-annotated/chartjs/code. Any spec id and library id listed in llms-full.txt fit the same URL shape; every URL below is complete and callable.
{
  "spec_id": "heatmap-annotated",
  "language": "javascript",
  "library": "chartjs",
  "page": "https://anyplot.ai/heatmap-annotated/javascript/chartjs",
  "hub": "https://anyplot.ai/heatmap-annotated",
  "code_json": "https://api.anyplot.ai/specs/heatmap-annotated/chartjs/code",
  "spec_json": "https://api.anyplot.ai/specs/heatmap-annotated",
  "render_light_png": "https://storage.googleapis.com/anyplot-images/plots/heatmap-annotated/javascript/chartjs/plot-light.png",
  "render_dark_png": "https://storage.googleapis.com/anyplot-images/plots/heatmap-annotated/javascript/chartjs/plot-dark.png",
  "interactive_light_html": "https://storage.googleapis.com/anyplot-images/plots/heatmap-annotated/javascript/chartjs/plot-light.html",
  "interactive_dark_html": "https://storage.googleapis.com/anyplot-images/plots/heatmap-annotated/javascript/chartjs/plot-dark.html",
  "quality_score": 90.0,
  "license": "MIT",
  "guide": "https://anyplot.ai/llms.txt"
}
Part of Annotated Heatmap on anyplot.ai.