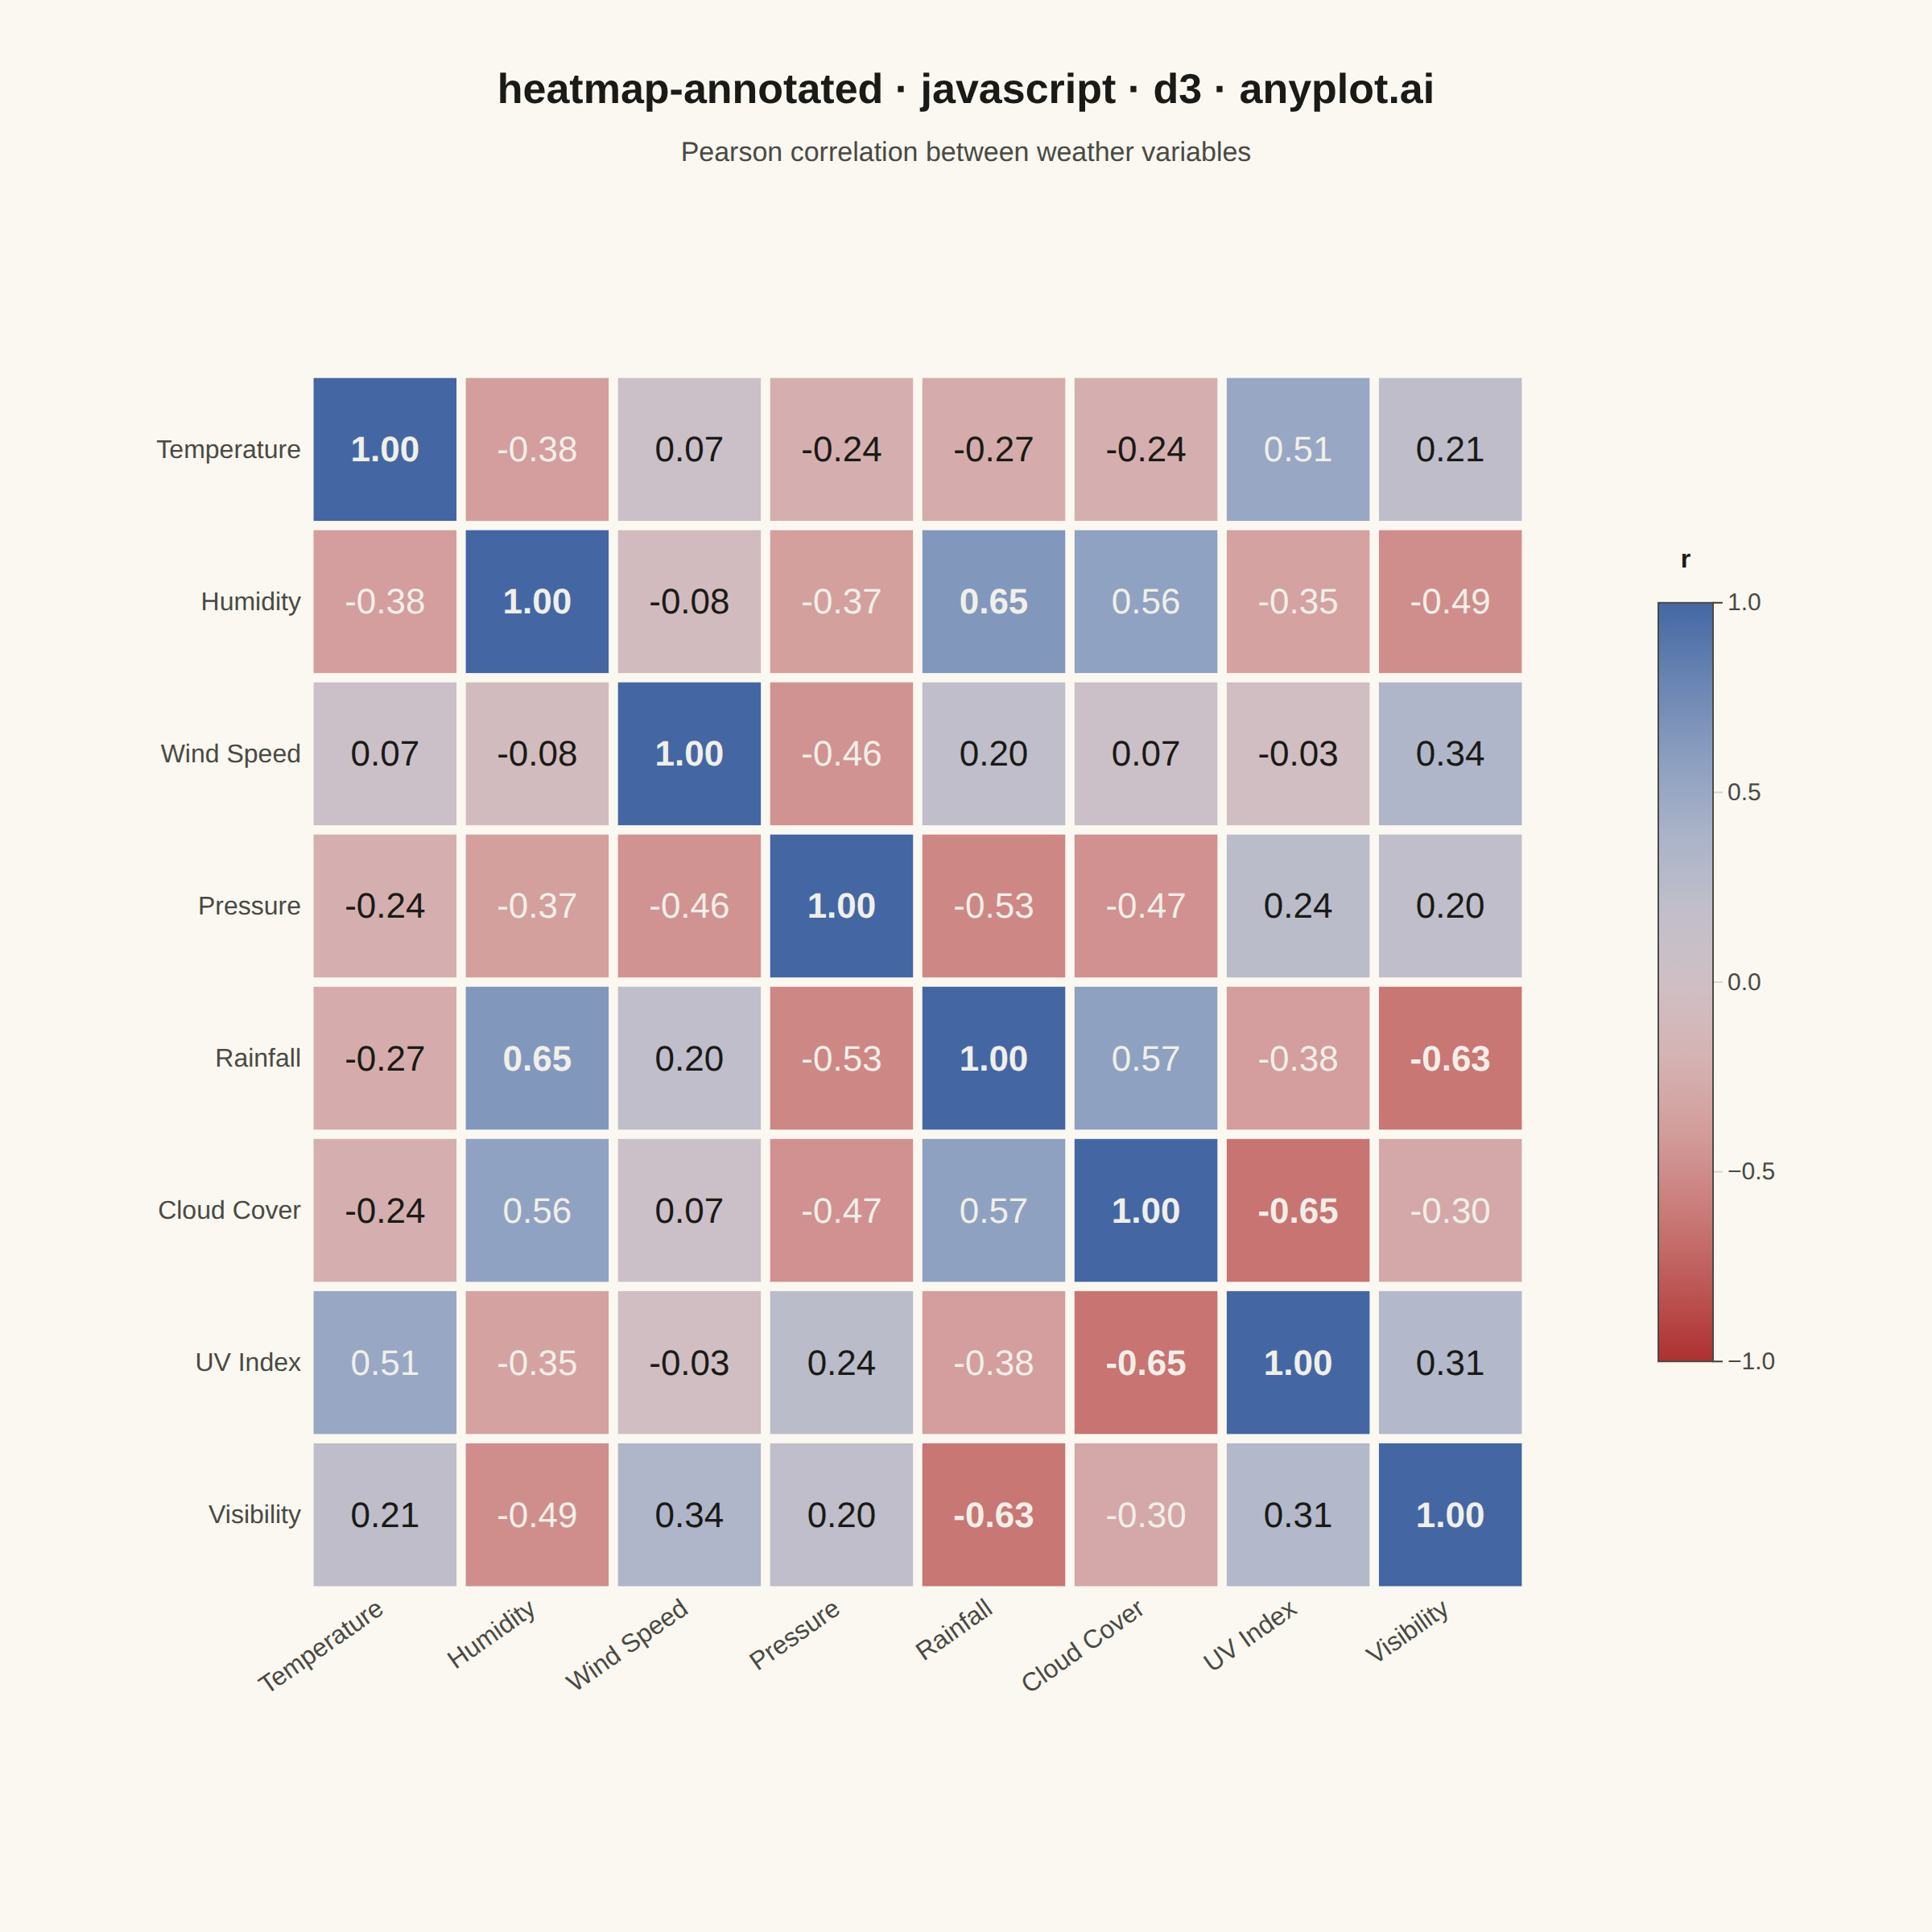
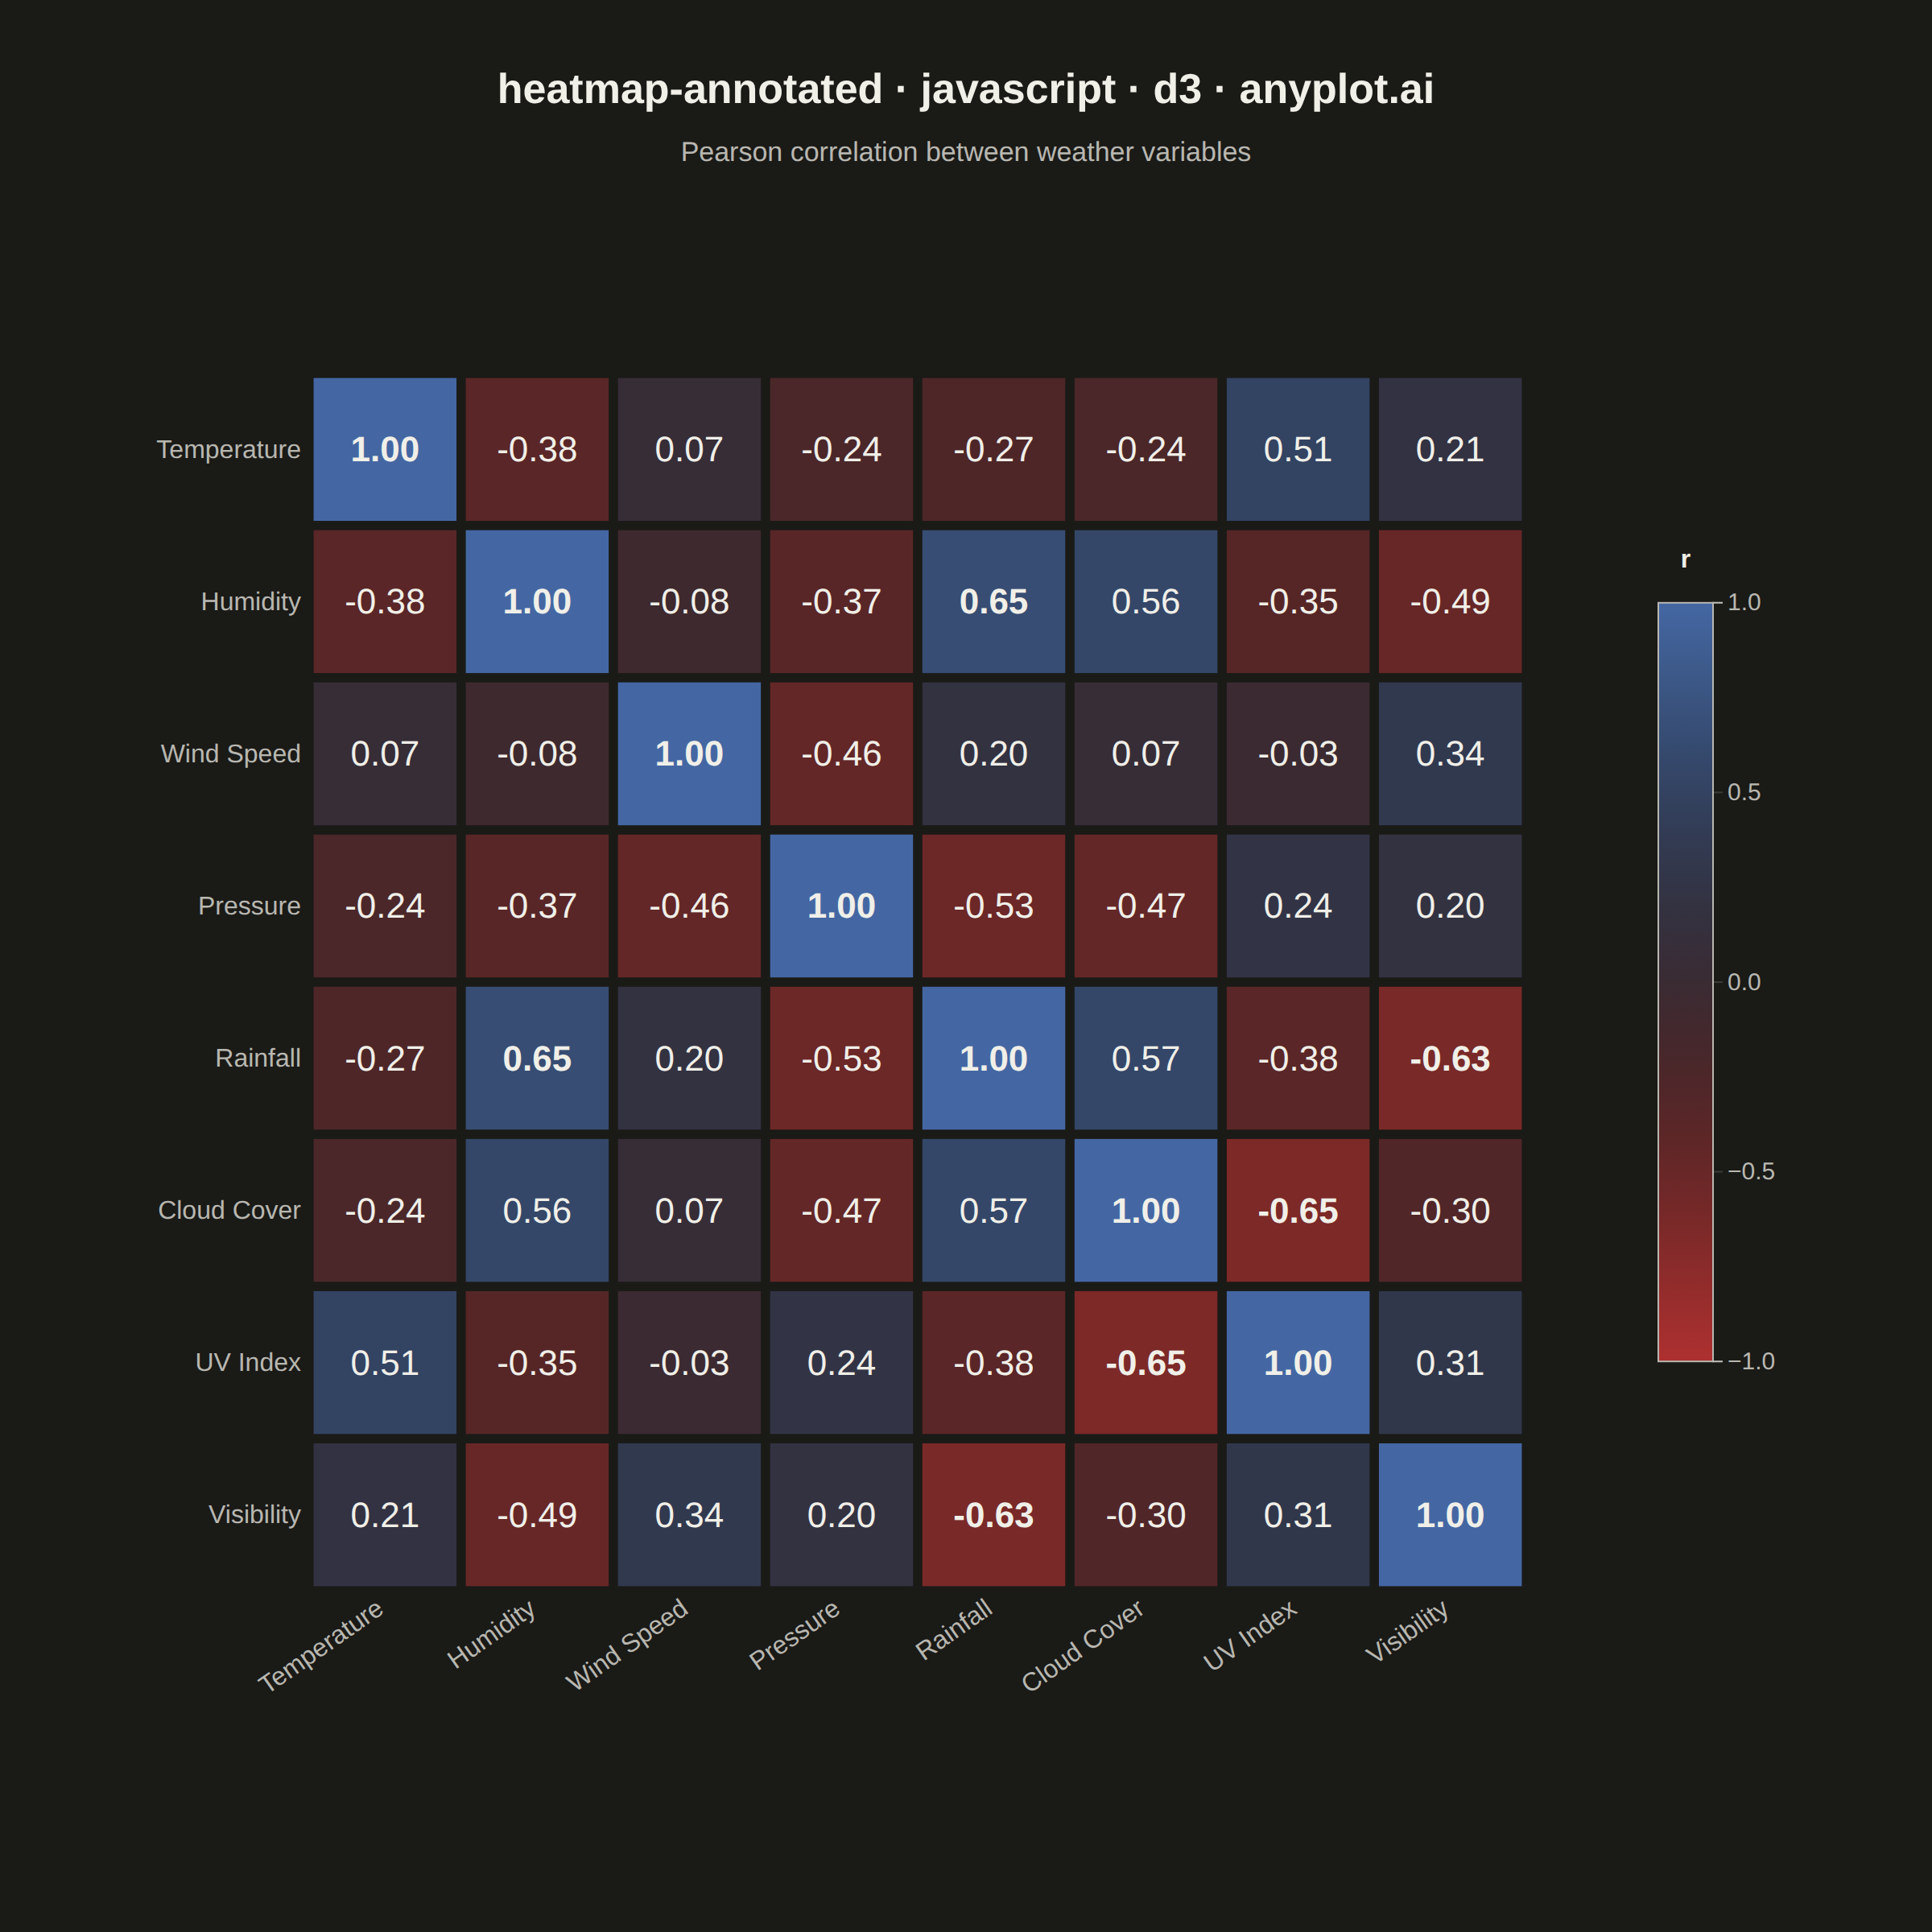
The same plot in 14 other libraries — JavaScript: Chart.js, Apache ECharts, Highcharts, MUI X Charts; Python: Altair, Bokeh, lets-plot, Matplotlib, Plotly, plotnine, Pygal, Seaborn; R: ggplot2; Julia: Makie.jl. Compare all 15 side by side: Annotated Heatmap in Python, R, Julia and JavaScript.
A heatmap with numeric values displayed inside each cell, combining color intensity with exact value labels. Essential for correlation matrices, confusion matrices, and any matrix visualization where both pattern recognition and precise values matter. Text color automatically contrasts with background for readability.
// anyplot.ai
// heatmap-annotated: Annotated Heatmap
// Library: d3 7.9.0 | JavaScript 22.23.1
// Quality: 93/100 | Created: 2026-08-05
//# anyplot-orientation: square

const t = window.ANYPLOT_TOKENS;
const { width, height } = window.ANYPLOT_SIZE;

// --- Data: deterministic correlation matrix biased toward domain-plausible --
// magnitudes/signs for well-known weather-variable relationships (LCG jitter
// within each pair's plausible range keeps it reproducible, not extreme).
function lcg(seed) {
  let state = seed;
  return () => {
    state = (state * 1664525 + 1013904223) % 4294967296;
    return state / 4294967296;
  };
}
const rand = lcg(42);

const variables = [
  "Temperature",
  "Humidity",
  "Wind Speed",
  "Pressure",
  "Rainfall",
  "Cloud Cover",
  "UV Index",
  "Visibility",
];
const n = variables.length;

// [row, col, sign, minMagnitude, maxMagnitude] for every pair, chosen to
// match textbook-plausible weather correlations (e.g. temperature/UV index
// move together, cloud cover/UV index move apart, humidity/rainfall are only
// moderately linked rather than near-perfect).
const PAIR_CORR = [
  ["Temperature", "Humidity", -1, 0.3, 0.6],
  ["Temperature", "Wind Speed", 1, 0.05, 0.3],
  ["Temperature", "Pressure", -1, 0.1, 0.35],
  ["Temperature", "Rainfall", -1, 0.2, 0.5],
  ["Temperature", "Cloud Cover", -1, 0.15, 0.4],
  ["Temperature", "UV Index", 1, 0.5, 0.8],
  ["Temperature", "Visibility", 1, 0.1, 0.35],
  ["Humidity", "Wind Speed", -1, 0.05, 0.3],
  ["Humidity", "Pressure", -1, 0.15, 0.4],
  ["Humidity", "Rainfall", 1, 0.35, 0.65],
  ["Humidity", "Cloud Cover", 1, 0.3, 0.6],
  ["Humidity", "UV Index", -1, 0.2, 0.5],
  ["Humidity", "Visibility", -1, 0.3, 0.6],
  ["Wind Speed", "Pressure", -1, 0.2, 0.5],
  ["Wind Speed", "Rainfall", 1, 0.05, 0.3],
  ["Wind Speed", "Cloud Cover", 1, 0.05, 0.3],
  ["Wind Speed", "UV Index", -1, 0.0, 0.2],
  ["Wind Speed", "Visibility", 1, 0.1, 0.35],
  ["Pressure", "Rainfall", -1, 0.25, 0.55],
  ["Pressure", "Cloud Cover", -1, 0.2, 0.5],
  ["Pressure", "UV Index", 1, 0.1, 0.35],
  ["Pressure", "Visibility", 1, 0.15, 0.4],
  ["Rainfall", "Cloud Cover", 1, 0.4, 0.7],
  ["Rainfall", "UV Index", -1, 0.3, 0.6],
  ["Rainfall", "Visibility", -1, 0.35, 0.65],
  ["Cloud Cover", "UV Index", -1, 0.4, 0.7],
  ["Cloud Cover", "Visibility", -1, 0.25, 0.55],
  ["UV Index", "Visibility", 1, 0.1, 0.35],
];

const corr = Array.from({ length: n }, () => new Array(n).fill(0));
for (let i = 0; i < n; i++) corr[i][i] = 1;
for (const [rowVar, colVar, sign, lo, hi] of PAIR_CORR) {
  const i = variables.indexOf(rowVar);
  const j = variables.indexOf(colVar);
  const value = Math.round(sign * (lo + rand() * (hi - lo)) * 100) / 100;
  corr[i][j] = value;
  corr[j][i] = value;
}

const cells = [];
for (let i = 0; i < n; i++) {
  for (let j = 0; j < n; j++) {
    cells.push({ row: variables[i], col: variables[j], value: corr[i][j] });
  }
}

// --- Layout --------------------------------------------------------------------
// Size the matrix off min(availW, availH) and center it so cells stay square
// even though the title/legend need asymmetric top/right space.
const margin = { top: 150, right: 250, bottom: 130, left: 190 };
const availW = width - margin.left - margin.right;
const availH = height - margin.top - margin.bottom;
const gridSize = Math.min(availW, availH);
const gx = margin.left + (availW - gridSize) / 2;
const gy = margin.top + (availH - gridSize) / 2;

// --- SVG mount ----------------------------------------------------------------
const svg = d3.select("#container").append("svg").attr("width", width).attr("height", height);
const g = svg.append("g").attr("transform", `translate(${gx},${gy})`);

// --- Scales --------------------------------------------------------------------
const x = d3.scaleBand().domain(variables).range([0, gridSize]).padding(0.04);
const y = d3.scaleBand().domain(variables).range([0, gridSize]).padding(0.04);
const color = d3.scaleSequential(d3.interpolateRgbBasis(t.div)).domain([-1, 1]);

// --- Contrast text color -------------------------------------------------------
function luminance(hex) {
  const c = d3.color(hex).rgb();
  const lin = (v) => {
    const s = v / 255;
    return s <= 0.03928 ? s / 12.92 : Math.pow((s + 0.055) / 1.055, 2.4);
  };
  return 0.2126 * lin(c.r) + 0.7152 * lin(c.g) + 0.0722 * lin(c.b);
}
const DARK_TEXT = "#1A1A17";
const LIGHT_TEXT = "#F0EFE8";
function textColor(hex) {
  return luminance(hex) > 0.45 ? DARK_TEXT : LIGHT_TEXT;
}

// --- Cells -----------------------------------------------------------------
g.selectAll("rect.cell")
  .data(cells)
  .join("rect")
  .attr("class", "cell")
  .attr("x", (d) => x(d.col))
  .attr("y", (d) => y(d.row))
  .attr("width", x.bandwidth())
  .attr("height", y.bandwidth())
  .attr("fill", (d) => color(d.value))
  .attr("stroke", t.pageBg)
  .attr("stroke-width", 2);

// --- Cell value annotations --------------------------------------------------
const cellFontSize = Math.max(13, Math.min(22, x.bandwidth() / 3.6));
g.selectAll("text.cell-label")
  .data(cells)
  .join("text")
  .attr("class", "cell-label")
  .attr("x", (d) => x(d.col) + x.bandwidth() / 2)
  .attr("y", (d) => y(d.row) + y.bandwidth() / 2)
  .attr("text-anchor", "middle")
  .attr("dominant-baseline", "central")
  .style("font-size", `${cellFontSize}px`)
  .style("font-weight", (d) => (d.row === d.col || Math.abs(d.value) > 0.6 ? 600 : 400))
  .attr("fill", (d) => textColor(color(d.value)))
  .text((d) => d.value.toFixed(2));

// --- Axes ------------------------------------------------------------------
const xAxis = g.append("g").attr("transform", `translate(0,${gridSize})`).call(d3.axisBottom(x).tickSize(0));
xAxis
  .selectAll("text")
  .attr("fill", t.inkSoft)
  .style("font-size", "16px")
  .attr("transform", "rotate(-35)")
  .attr("text-anchor", "end")
  .attr("dx", "-0.4em")
  .attr("dy", "0.4em");
xAxis.select(".domain").remove();

const yAxis = g.append("g").call(d3.axisLeft(y).tickSize(0));
yAxis.selectAll("text").attr("fill", t.inkSoft).style("font-size", "16px");
yAxis.select(".domain").remove();

// --- Colorbar legend -----------------------------------------------------------
const legendW = 34;
const legendH = gridSize * 0.62;
const legendX = gx + gridSize + 80;
const legendY = gy + (gridSize - legendH) / 2;

const defs = svg.append("defs");
const gradient = defs
  .append("linearGradient")
  .attr("id", "corr-gradient")
  .attr("x1", "0")
  .attr("x2", "0")
  .attr("y1", "1")
  .attr("y2", "0");
gradient
  .selectAll("stop")
  .data(d3.range(0, 1.0001, 0.1))
  .join("stop")
  .attr("offset", (d) => `${d * 100}%`)
  .attr("stop-color", (d) => color(-1 + d * 2));

svg
  .append("rect")
  .attr("x", legendX)
  .attr("y", legendY)
  .attr("width", legendW)
  .attr("height", legendH)
  .attr("fill", "url(#corr-gradient)")
  .attr("stroke", t.inkSoft)
  .attr("stroke-width", 1);

const legendScale = d3.scaleLinear().domain([-1, 1]).range([legendY + legendH, legendY]);
const legendAxis = d3.axisRight(legendScale).ticks(5).tickSize(6);
const legendAxisG = svg.append("g").attr("transform", `translate(${legendX + legendW},0)`).call(legendAxis);
legendAxisG.selectAll("text").attr("fill", t.inkSoft).style("font-size", "15px");
legendAxisG.selectAll("line").attr("stroke", t.grid);
legendAxisG.select(".domain").attr("stroke", t.inkSoft);

svg
  .append("text")
  .attr("x", legendX + legendW / 2)
  .attr("y", legendY - 22)
  .attr("text-anchor", "middle")
  .attr("fill", t.ink)
  .style("font-size", "16px")
  .style("font-weight", "600")
  .text("r");

// --- Title -------------------------------------------------------------------
svg
  .append("text")
  .attr("x", width / 2)
  .attr("y", 64)
  .attr("text-anchor", "middle")
  .attr("fill", t.ink)
  .style("font-size", "26px")
  .style("font-weight", "600")
  .text("heatmap-annotated · javascript · d3 · anyplot.ai");

svg
  .append("text")
  .attr("x", width / 2)
  .attr("y", 100)
  .attr("text-anchor", "middle")
  .attr("fill", t.inkSoft)
  .style("font-size", "17px")
  .text("Pearson correlation between weather variables");
Runnable source as JSON, for any HTTP client: https://api.anyplot.ai/specs/heatmap-annotated/d3/code. Any spec id and library id listed in llms-full.txt fit the same URL shape; every URL below is complete and callable.
{
  "spec_id": "heatmap-annotated",
  "language": "javascript",
  "library": "d3",
  "page": "https://anyplot.ai/heatmap-annotated/javascript/d3",
  "hub": "https://anyplot.ai/heatmap-annotated",
  "code_json": "https://api.anyplot.ai/specs/heatmap-annotated/d3/code",
  "spec_json": "https://api.anyplot.ai/specs/heatmap-annotated",
  "render_light_png": "https://storage.googleapis.com/anyplot-images/plots/heatmap-annotated/javascript/d3/plot-light.png",
  "render_dark_png": "https://storage.googleapis.com/anyplot-images/plots/heatmap-annotated/javascript/d3/plot-dark.png",
  "interactive_light_html": "https://storage.googleapis.com/anyplot-images/plots/heatmap-annotated/javascript/d3/plot-light.html",
  "interactive_dark_html": "https://storage.googleapis.com/anyplot-images/plots/heatmap-annotated/javascript/d3/plot-dark.html",
  "quality_score": 93.0,
  "license": "MIT",
  "guide": "https://anyplot.ai/llms.txt"
}
Part of Annotated Heatmap on anyplot.ai.