The same plot in 14 other libraries — JavaScript: Chart.js, D3.js, Apache ECharts, Highcharts; Python: Altair, Bokeh, lets-plot, Matplotlib, Plotly, plotnine, Pygal, Seaborn; R: ggplot2; Julia: Makie.jl. Compare all 15 side by side: Annotated Heatmap in Python, R, Julia and JavaScript.
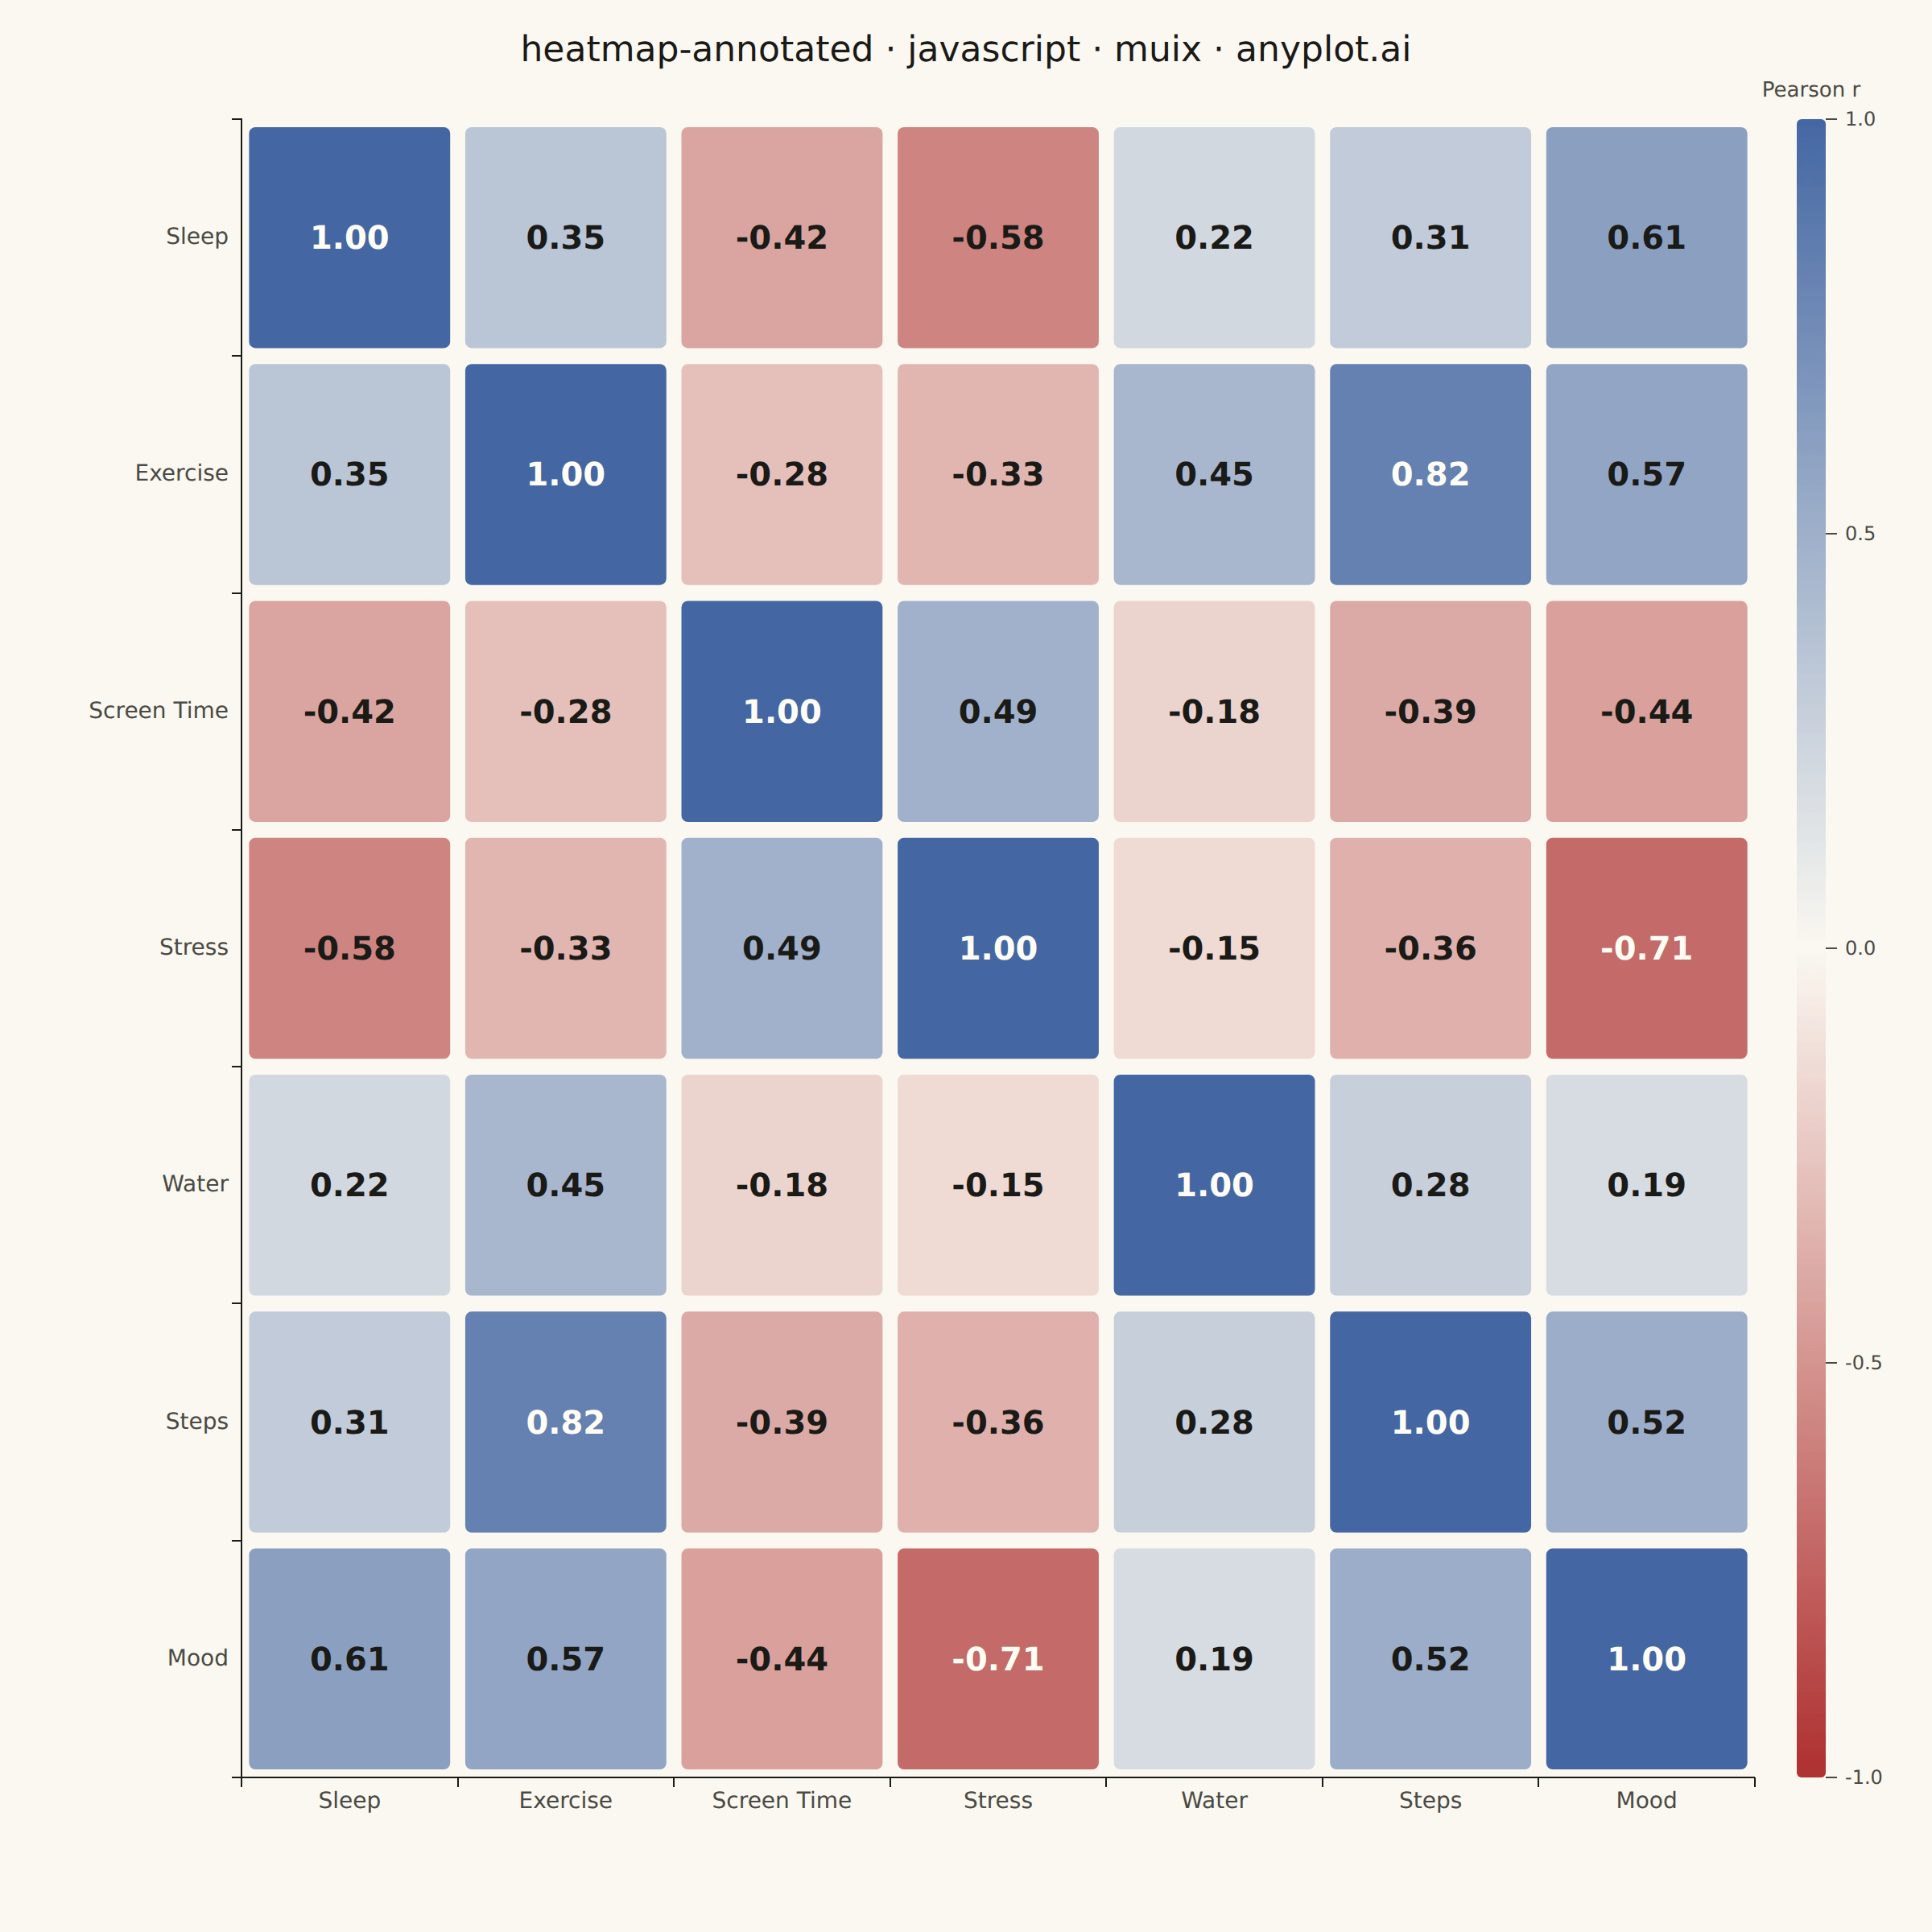
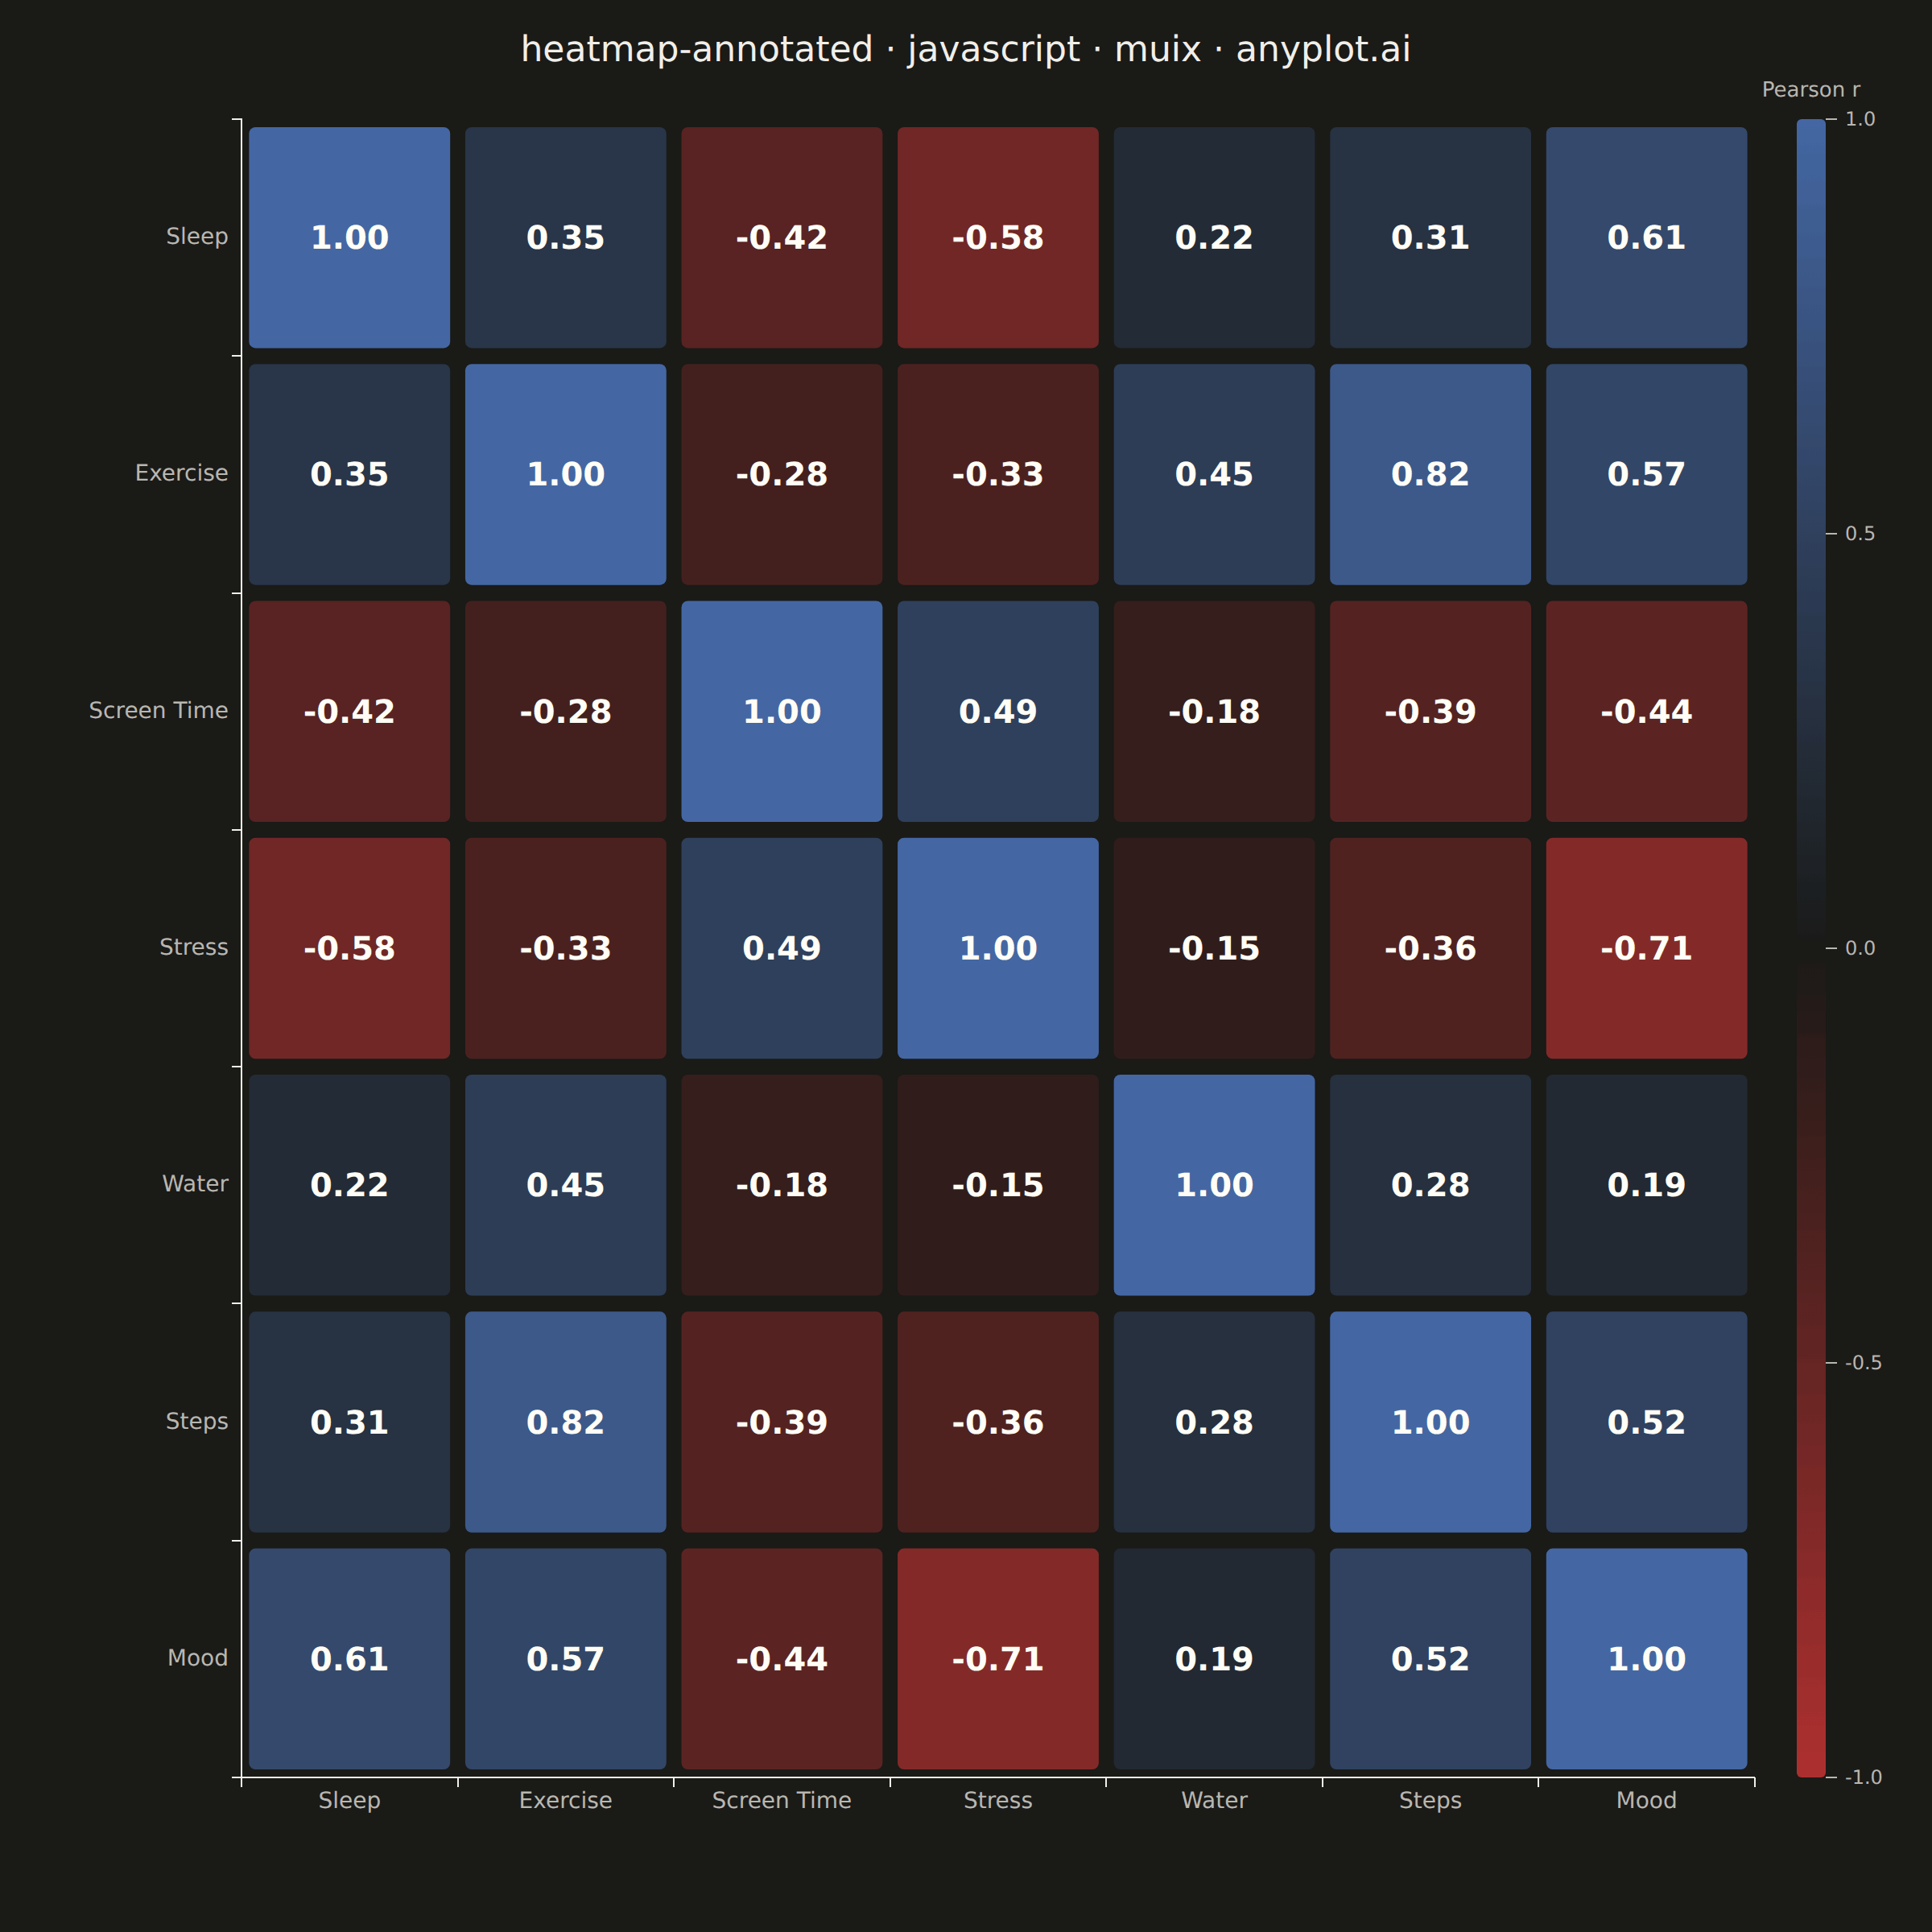
A heatmap with numeric values displayed inside each cell, combining color intensity with exact value labels. Essential for correlation matrices, confusion matrices, and any matrix visualization where both pattern recognition and precise values matter. Text color automatically contrasts with background for readability.
// anyplot.ai
// heatmap-annotated: Annotated Heatmap
// Library: muix 7.29.1 | JavaScript 22.23.1
// Quality: 90/100 | Created: 2026-08-05
//# anyplot-orientation: square
// anyplot.ai
// heatmap-annotated: Annotated Heatmap
// Library: MUI X Charts | React | Node 22
// License: @mui/x-charts — MIT (community). Pro/Premium are out of scope.
// Quality: pending | Created: 2026-08-05

import { ChartContainer } from "@mui/x-charts/ChartContainer";
import { ChartsXAxis } from "@mui/x-charts/ChartsXAxis";
import { ChartsYAxis } from "@mui/x-charts/ChartsYAxis";
import { useDrawingArea, useXScale, useYScale } from "@mui/x-charts/hooks";

const t = window.ANYPLOT_TOKENS;
const W = window.ANYPLOT_SIZE.width;
const H = window.ANYPLOT_SIZE.height;
const FONT = "system-ui, -apple-system, sans-serif";
const TITLE = "heatmap-annotated · javascript · muix · anyplot.ai";

// --- Data: Pearson correlation matrix across daily wellness metrics --------
const VARIABLES = ["Sleep", "Exercise", "Screen Time", "Stress", "Water", "Steps", "Mood"];

// Symmetric 7x7 matrix, diagonal = 1.00 (self-correlation)
const CORRELATIONS = [
  [1.0, 0.35, -0.42, -0.58, 0.22, 0.31, 0.61],
  [0.35, 1.0, -0.28, -0.33, 0.45, 0.82, 0.57],
  [-0.42, -0.28, 1.0, 0.49, -0.18, -0.39, -0.44],
  [-0.58, -0.33, 0.49, 1.0, -0.15, -0.36, -0.71],
  [0.22, 0.45, -0.18, -0.15, 1.0, 0.28, 0.19],
  [0.31, 0.82, -0.39, -0.36, 0.28, 1.0, 0.52],
  [0.61, 0.57, -0.44, -0.71, 0.19, 0.52, 1.0],
];

// --- Diverging color scale (Imprint imprint_div: red -> midpoint -> blue) --
function hexToRgb(hex) {
  const v = parseInt(hex.replace("#", ""), 16);
  return [(v >> 16) & 255, (v >> 8) & 255, v & 255];
}
const lerp = (a, b, f) => a + (b - a) * f;

function divergingRgb(value) {
  const [r0, g0, b0] = hexToRgb(t.div[0]); // -1 anchor (matte red)
  const [r1, g1, b1] = hexToRgb(t.div[1]); // 0 anchor (theme midpoint)
  const [r2, g2, b2] = hexToRgb(t.div[2]); // +1 anchor (blue)
  const [ra, ga, ba] = value <= 0 ? [r0, g0, b0] : [r1, g1, b1];
  const [rb, gb, bb] = value <= 0 ? [r1, g1, b1] : [r2, g2, b2];
  const f = value <= 0 ? value + 1 : value;
  return [lerp(ra, rb, f), lerp(ga, gb, f), lerp(ba, bb, f)].map(Math.round);
}

// Auto-contrast annotation text: dark ink on pale cells, light ink on saturated cells
function contrastText([r, g, b]) {
  const luminance = (0.299 * r + 0.587 * g + 0.114 * b) / 255;
  return luminance > 0.55 ? "#1A1A17" : "#FFFDF6";
}

// --- Heatmap cells: colored rects + value annotations -----------------------
function HeatmapCells() {
  const xScale = useXScale("vars_x");
  const yScale = useYScale("vars_y");
  if (!xScale?.bandwidth || !yScale?.bandwidth) return null;
  const bw = xScale.bandwidth();
  const bh = yScale.bandwidth();
  return (
    <g>
      {CORRELATIONS.map((row, ri) =>
        row.map((value, ci) => {
          const x0 = xScale(VARIABLES[ci]);
          const y0 = yScale(VARIABLES[ri]);
          if (x0 === undefined || y0 === undefined) return null;
          const rgb = divergingRgb(value);
          return (
            <g key={`${ri}-${ci}`}>
              <rect
                x={x0 + 2} y={y0 + 2}
                width={bw - 4} height={bh - 4}
                fill={`rgb(${rgb.join(",")})`} rx={4}
              />
              <text
                x={x0 + bw / 2} y={y0 + bh / 2 + 7}
                textAnchor="middle" fontSize={20} fontWeight="600"
                fill={contrastText(rgb)} fontFamily={FONT}
              >
                {value.toFixed(2)}
              </text>
            </g>
          );
        }),
      )}
    </g>
  );
}

// Diverging colorbar legend in the right margin
function Colorbar() {
  const { left, top, width, height } = useDrawingArea();
  const barX = left + width + 26;
  const ticks = [-1, -0.5, 0, 0.5, 1];
  return (
    <g>
      <defs>
        <linearGradient id="divGrad" x1="0" y1="1" x2="0" y2="0">
          <stop offset="0%" stopColor={t.div[0]} />
          <stop offset="50%" stopColor={t.div[1]} />
          <stop offset="100%" stopColor={t.div[2]} />
        </linearGradient>
      </defs>
      <text
        x={barX + 9} y={top - 14}
        textAnchor="middle" fontSize={13} fill={t.inkSoft} fontFamily={FONT}
      >
        Pearson r
      </text>
      <rect x={barX} y={top} width={18} height={height} fill="url(#divGrad)" rx={3} />
      {ticks.map((tick) => {
        const ty = top + height * (1 - (tick + 1) / 2);
        return (
          <g key={tick}>
            <line x1={barX + 18} y1={ty} x2={barX + 25} y2={ty} stroke={t.inkSoft} strokeWidth={1} />
            <text x={barX + 30} y={ty + 4} fontSize={12} fill={t.inkSoft} fontFamily={FONT}>
              {tick.toFixed(1)}
            </text>
          </g>
        );
      })}
    </g>
  );
}

function ChartTitle() {
  return (
    <text x={W / 2} y={38} textAnchor="middle" fontSize={22} fontWeight="500" fill={t.ink} fontFamily={FONT}>
      {TITLE}
    </text>
  );
}

export default function Chart() {
  const margin = { left: 150, top: 74, right: 110, bottom: 96 };

  return (
    <ChartContainer
      width={W}
      height={H}
      margin={margin}
      series={[]}
      skipAnimation
      xAxis={[{ id: "vars_x", scaleType: "band", data: VARIABLES, categoryGapRatio: 0.04 }]}
      yAxis={[{ id: "vars_y", scaleType: "band", data: VARIABLES, categoryGapRatio: 0.04 }]}
    >
      <ChartTitle />
      <HeatmapCells />
      <Colorbar />
      <ChartsXAxis
        axisId="vars_x"
        tickLabelStyle={{ fontSize: 14, fill: t.inkSoft, fontFamily: FONT }}
      />
      <ChartsYAxis
        axisId="vars_y"
        tickLabelStyle={{ fontSize: 14, fill: t.inkSoft, fontFamily: FONT }}
      />
    </ChartContainer>
  );
}
Runnable source as JSON, for any HTTP client: https://api.anyplot.ai/specs/heatmap-annotated/muix/code. Any spec id and library id listed in llms-full.txt fit the same URL shape; every URL below is complete and callable.
{
  "spec_id": "heatmap-annotated",
  "language": "javascript",
  "library": "muix",
  "page": "https://anyplot.ai/heatmap-annotated/javascript/muix",
  "hub": "https://anyplot.ai/heatmap-annotated",
  "code_json": "https://api.anyplot.ai/specs/heatmap-annotated/muix/code",
  "spec_json": "https://api.anyplot.ai/specs/heatmap-annotated",
  "render_light_png": "https://storage.googleapis.com/anyplot-images/plots/heatmap-annotated/javascript/muix/plot-light.png",
  "render_dark_png": "https://storage.googleapis.com/anyplot-images/plots/heatmap-annotated/javascript/muix/plot-dark.png",
  "interactive_light_html": "https://storage.googleapis.com/anyplot-images/plots/heatmap-annotated/javascript/muix/plot-light.html",
  "interactive_dark_html": "https://storage.googleapis.com/anyplot-images/plots/heatmap-annotated/javascript/muix/plot-dark.html",
  "quality_score": 90.0,
  "license": "MIT",
  "guide": "https://anyplot.ai/llms.txt"
}
Part of Annotated Heatmap on anyplot.ai.