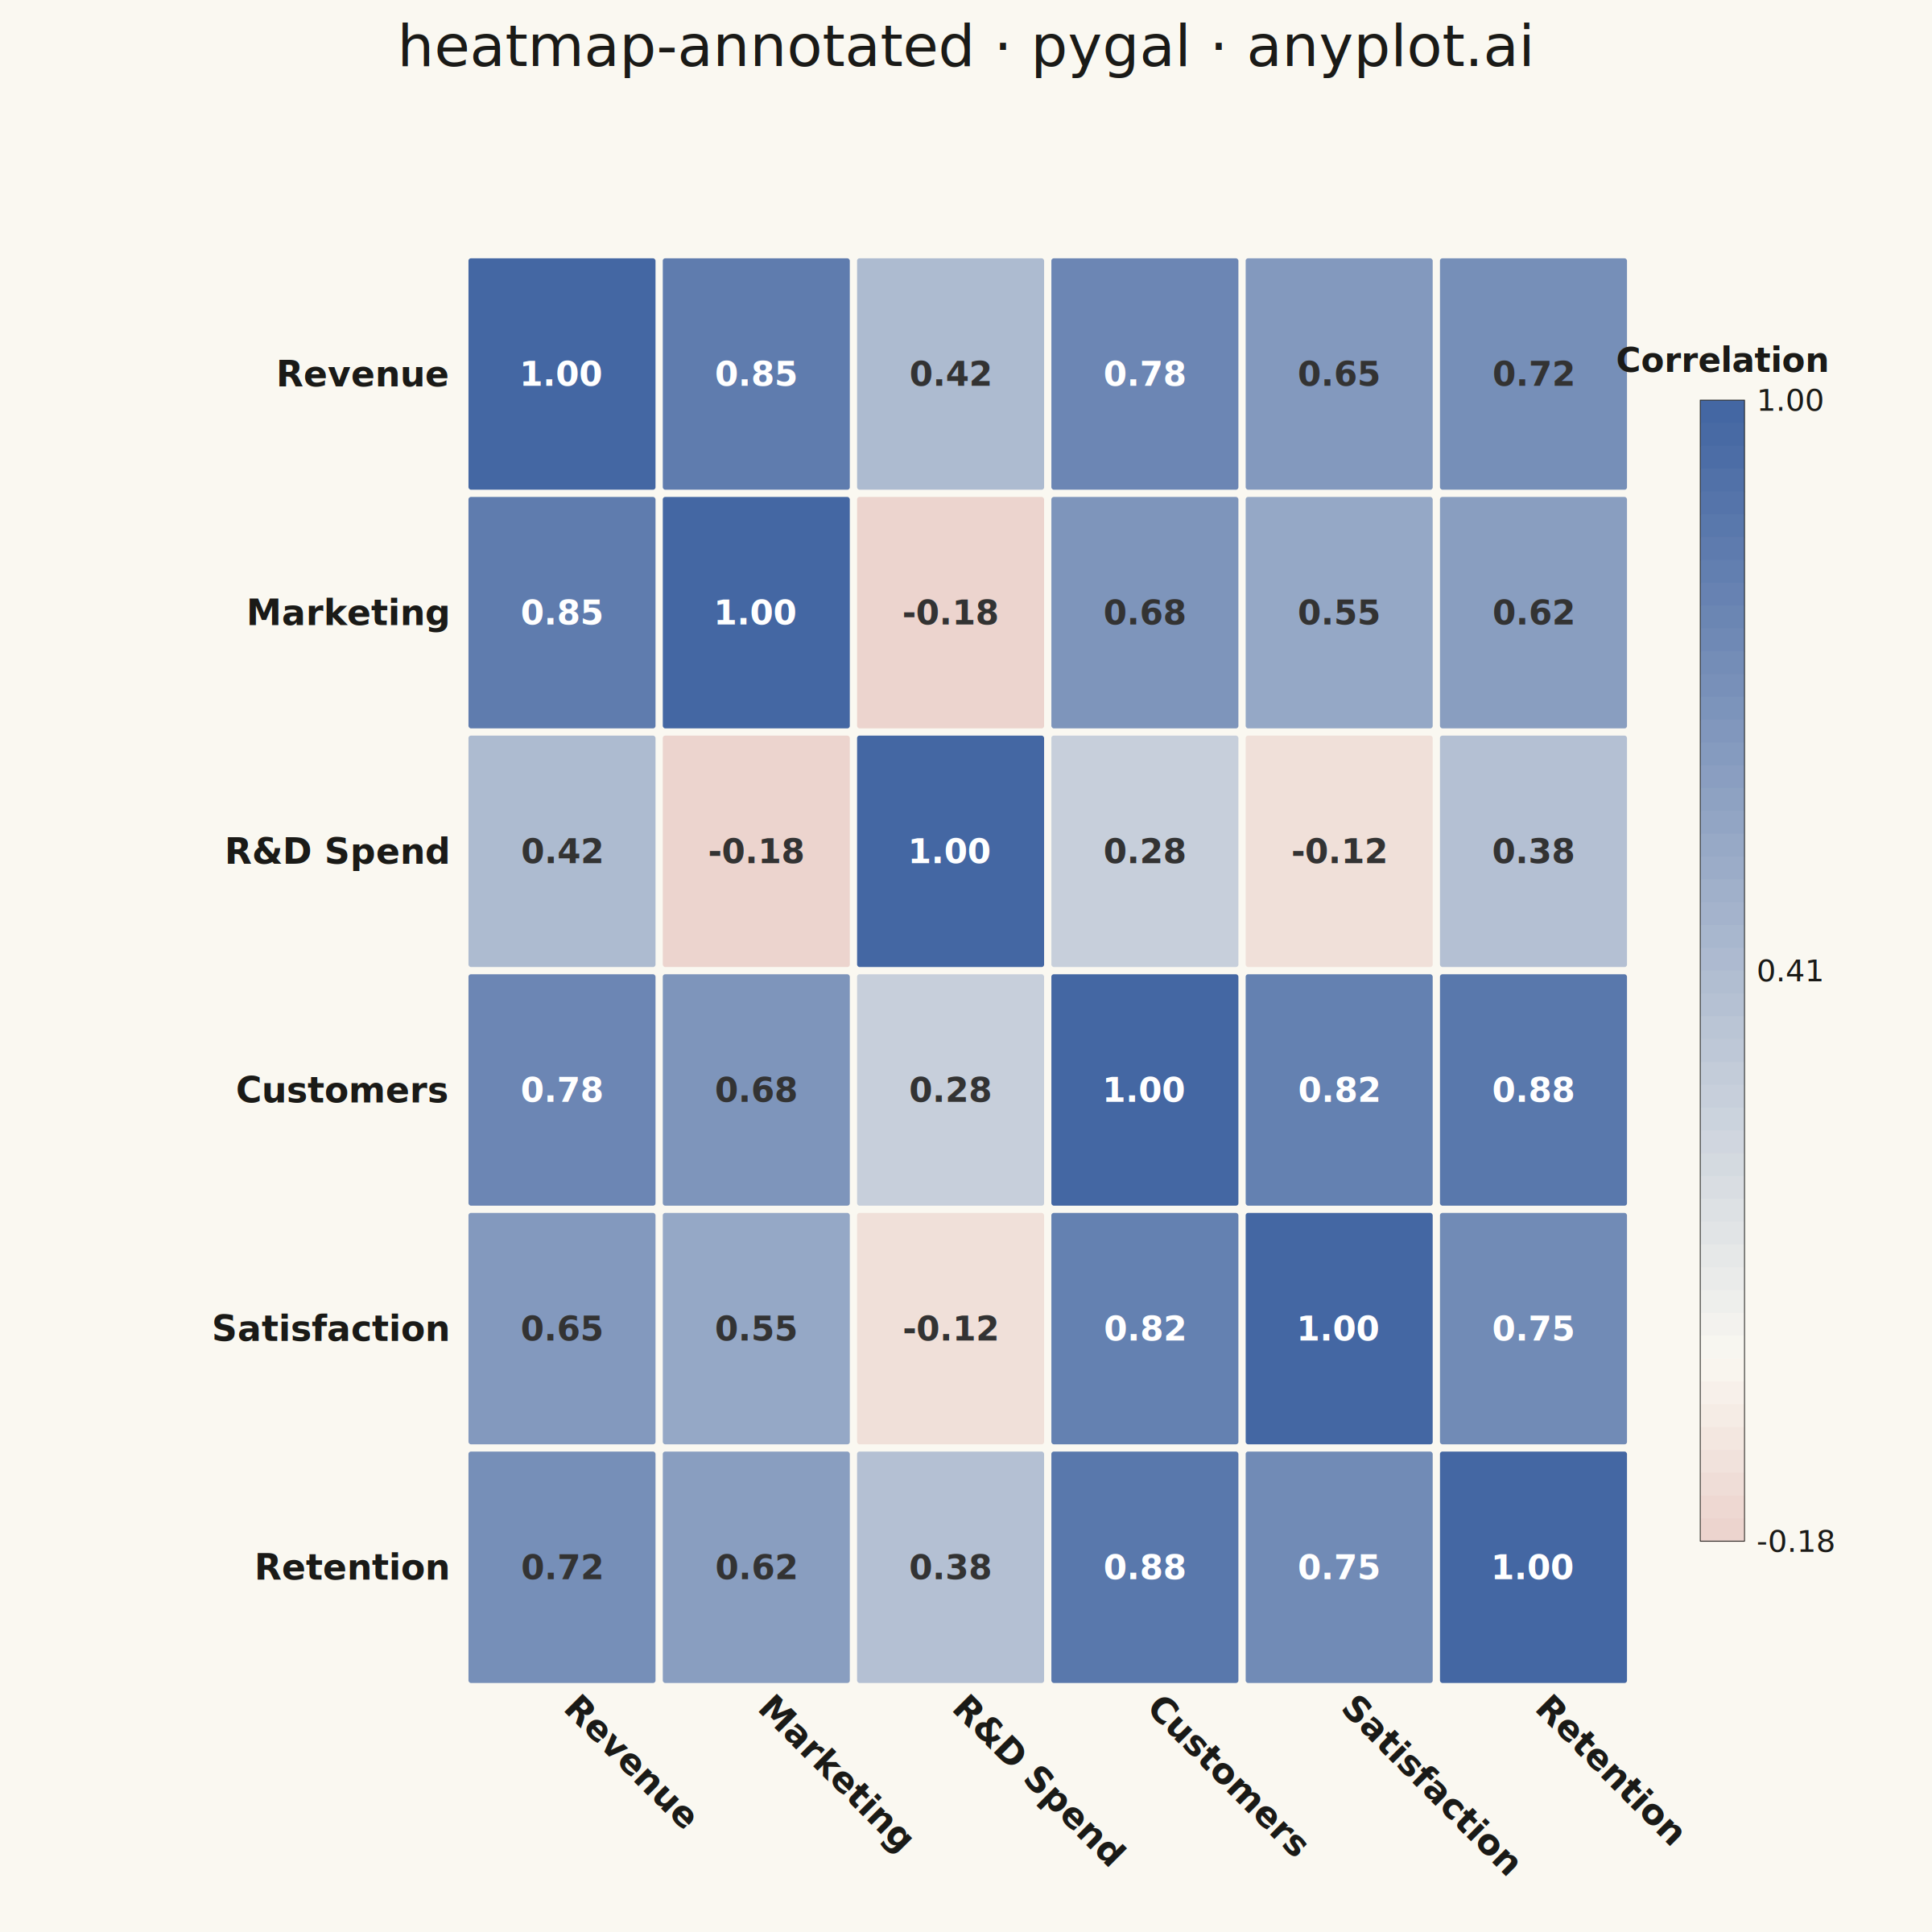
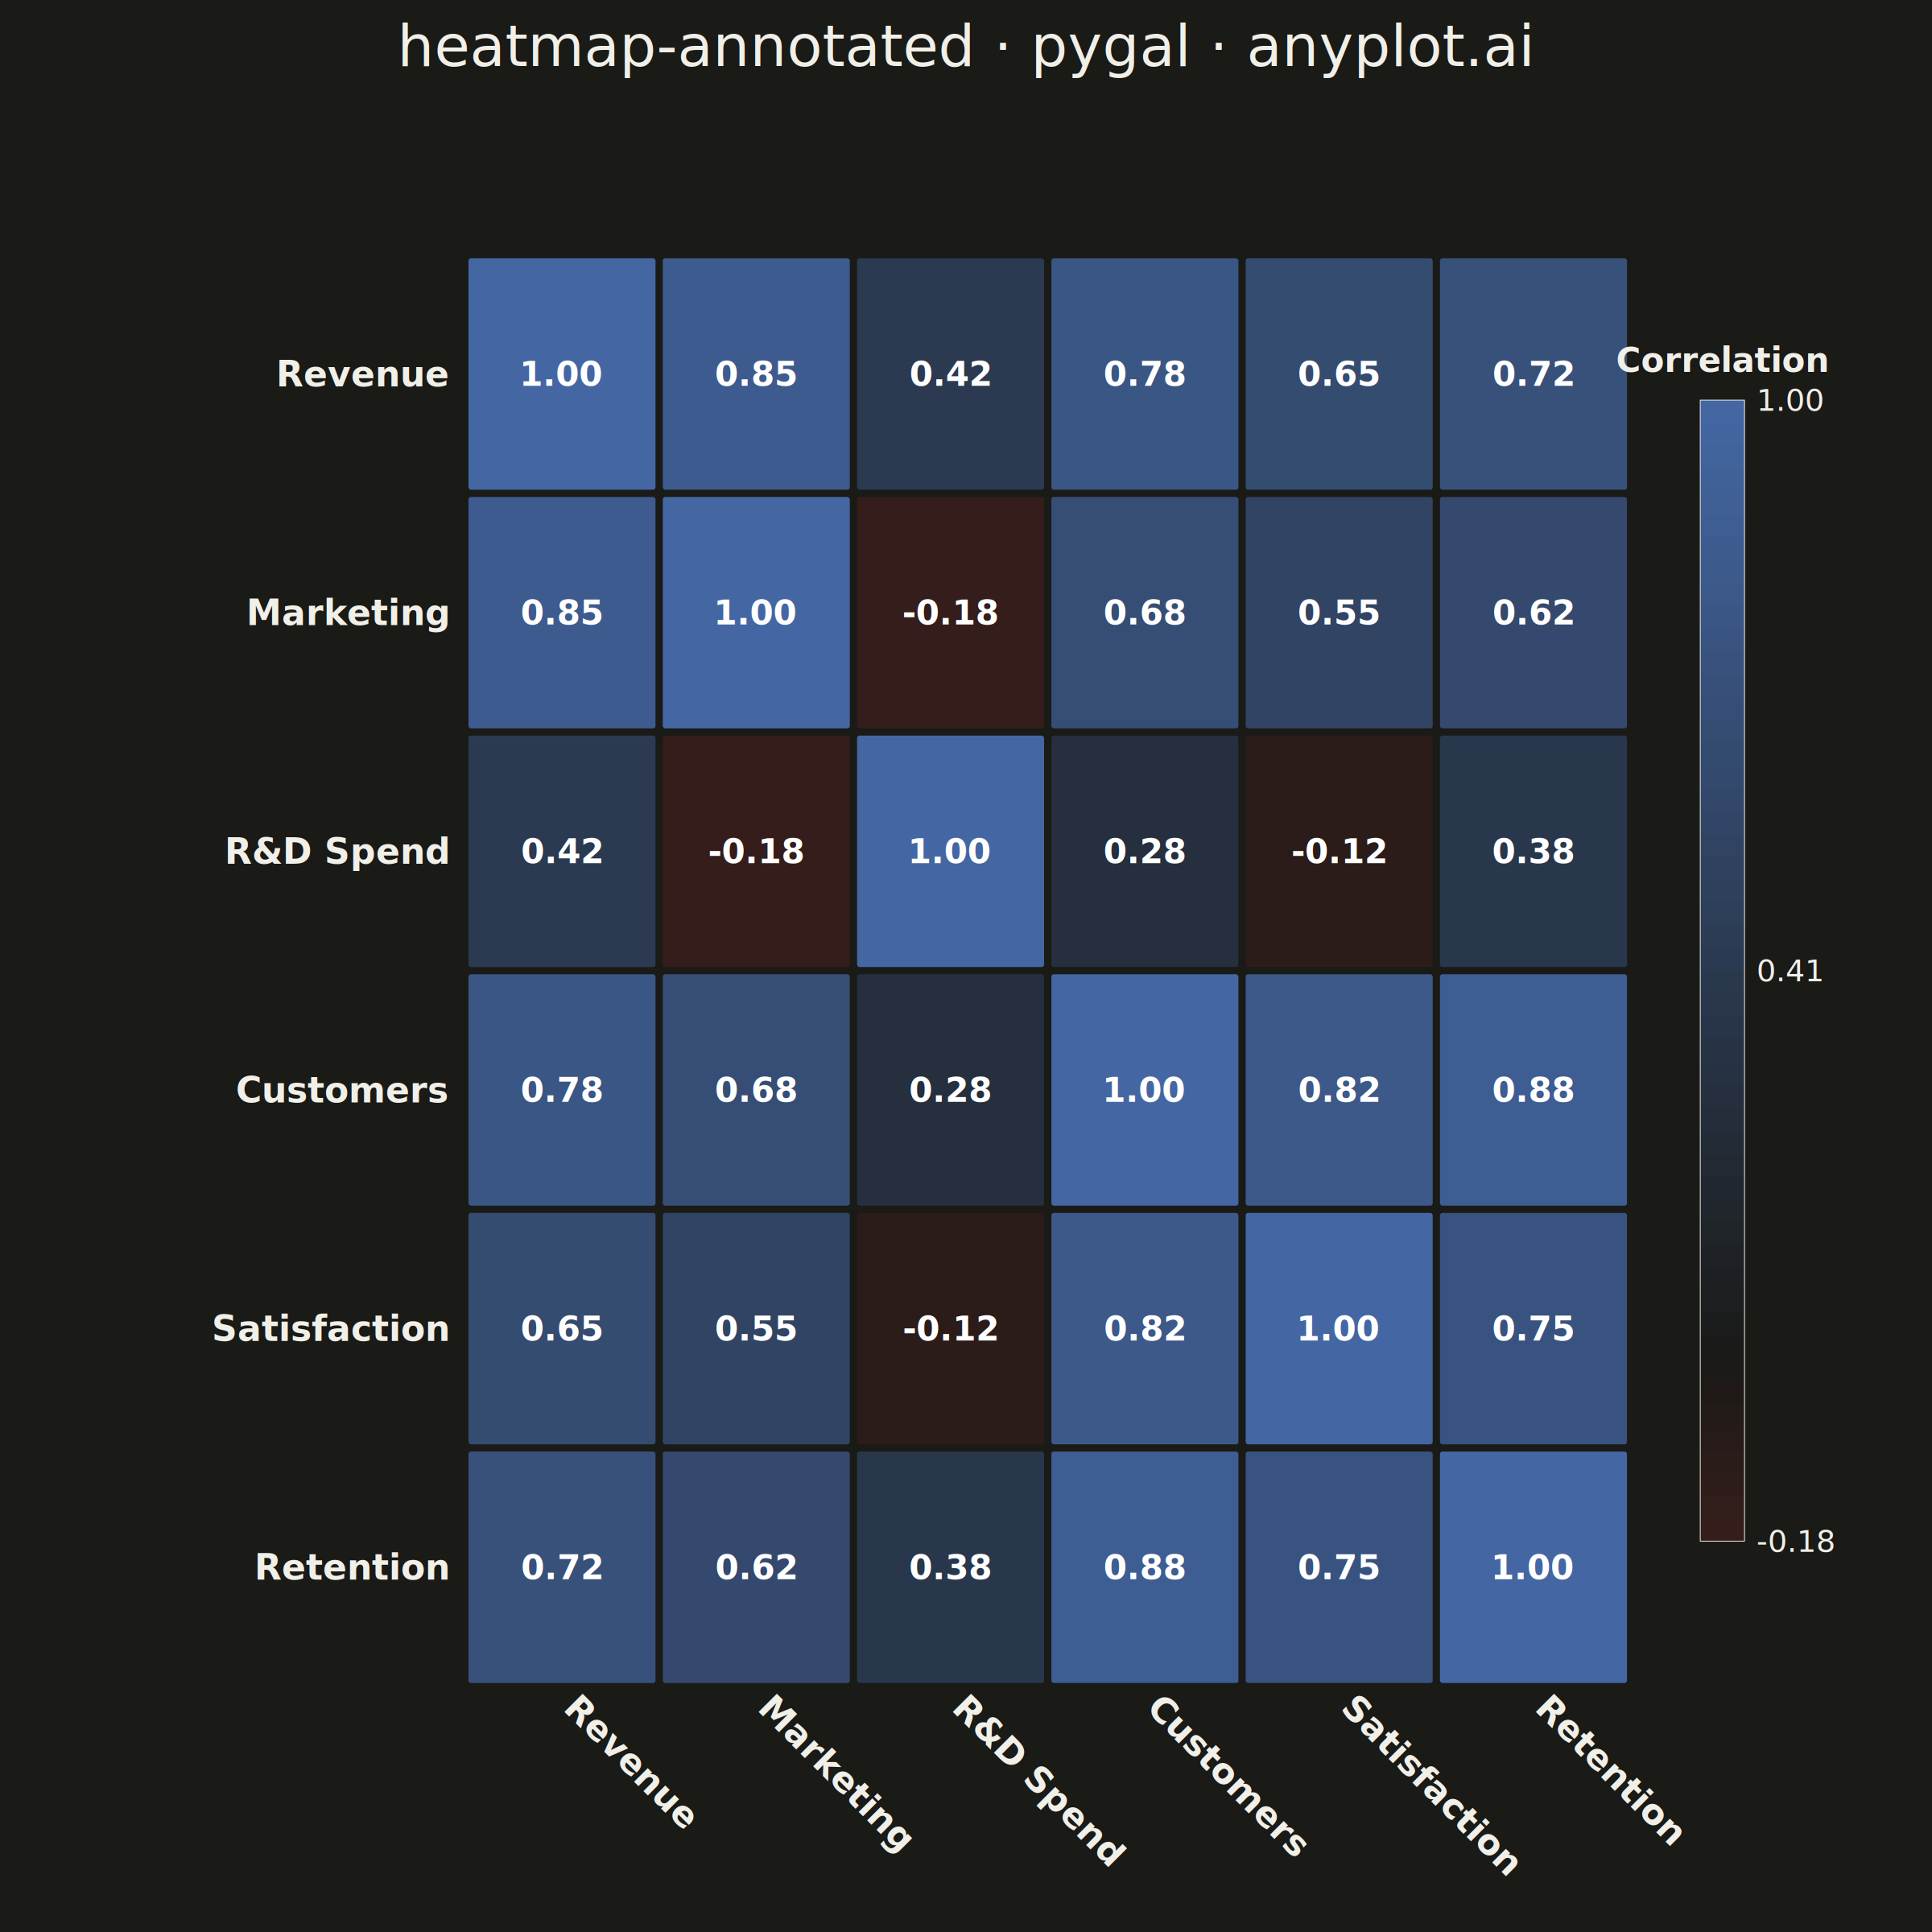
A heatmap with numeric values displayed inside each cell, combining color intensity with exact value labels. Essential for correlation matrices, confusion matrices, and any matrix visualization where both pattern recognition and precise values matter. Text color automatically contrasts with background for readability.
""" anyplot.ai
heatmap-annotated: Annotated Heatmap
Library: pygal 3.1.3 | Python 3.13.14
Quality: 89/100 | Updated: 2026-08-05
"""

import os
import sys


# Temporarily remove current directory from path to avoid name collision
_cwd = sys.path[0] if sys.path[0] else "."
if _cwd in sys.path:
    sys.path.remove(_cwd)

from pygal.graph.graph import Graph
from pygal.style import Style


# Restore path
sys.path.insert(0, _cwd)

# Theme tokens
THEME = os.getenv("ANYPLOT_THEME", "light")
PAGE_BG = "#FAF8F1" if THEME == "light" else "#1A1A17"
ELEVATED_BG = "#FFFDF6" if THEME == "light" else "#242420"
INK = "#1A1A17" if THEME == "light" else "#F0EFE8"
INK_SOFT = "#4A4A44" if THEME == "light" else "#B8B7B0"
INK_MUTED = "#6B6A63" if THEME == "light" else "#A8A79F"
RULE = "rgba(26,26,23,0.10)" if THEME == "light" else "rgba(240,239,232,0.10)"


class AnnotatedHeatmap(Graph):
    """Custom Annotated Heatmap for pygal - correlation matrix with values and contrasting text."""

    def __init__(self, *args, **kwargs):
        self.matrix_data = kwargs.pop("matrix_data", [])
        self.row_labels = kwargs.pop("row_labels", [])
        self.col_labels = kwargs.pop("col_labels", [])
        self.colormap = kwargs.pop("colormap", [])
        self.show_values = kwargs.pop("show_values", True)
        self.value_format = kwargs.pop("value_format", ".2f")
        self.is_symmetric = kwargs.pop("is_symmetric", False)
        super().__init__(*args, **kwargs)

    def _interpolate_color(self, value):
        """Interpolate color for diverging colormap centered at 0, fixed range -1 to 1."""
        # Normalize against the true correlation domain, not the data's own min/max,
        # so the neutral midpoint only appears at a real zero-correlation value.
        normalized = (value + 1) / 2
        normalized = max(0, min(1, normalized))

        # Get position in colormap
        pos = normalized * (len(self.colormap) - 1)
        idx1 = int(pos)
        idx2 = min(idx1 + 1, len(self.colormap) - 1)
        frac = pos - idx1

        # Interpolate between colors
        c1 = self.colormap[idx1]
        c2 = self.colormap[idx2]

        r1, g1, b1 = int(c1[1:3], 16), int(c1[3:5], 16), int(c1[5:7], 16)
        r2, g2, b2 = int(c2[1:3], 16), int(c2[3:5], 16), int(c2[5:7], 16)

        r = int(r1 + (r2 - r1) * frac)
        g = int(g1 + (g2 - g1) * frac)
        b = int(b1 + (b2 - b1) * frac)

        return f"#{r:02x}{g:02x}{b:02x}"

    def _get_text_color(self, bg_color):
        """Get contrasting text color (white or dark) based on background brightness."""
        r, g, b = int(bg_color[1:3], 16), int(bg_color[3:5], 16), int(bg_color[5:7], 16)
        # Calculate perceived brightness using ITU-R BT.601
        brightness = (r * 299 + g * 587 + b * 114) / 1000
        return "#ffffff" if brightness < 140 else "#333333"

    def _plot(self):
        """Draw the annotated heatmap."""
        if not self.matrix_data:
            return

        n_rows = len(self.matrix_data)
        n_cols = len(self.matrix_data[0]) if n_rows > 0 else 0

        # Find value range
        all_values = [v for row in self.matrix_data for v in row]
        min_val = min(all_values)
        max_val = max(all_values)

        # Get plot dimensions
        plot_width = self.view.width
        plot_height = self.view.height

        # Calculate cell size - leave space for labels
        label_margin_left = 400
        label_margin_bottom = 220
        label_margin_top = 20
        label_margin_right = 280

        available_width = plot_width - label_margin_left - label_margin_right
        available_height = plot_height - label_margin_bottom - label_margin_top

        cell_width = available_width / n_cols * 0.95
        cell_height = available_height / n_rows * 0.95
        gap = min(cell_width, cell_height) * 0.03

        # Calculate offsets to center the grid
        grid_width = n_cols * (cell_width + gap) - gap
        grid_height = n_rows * (cell_height + gap) - gap

        x_offset = self.view.x(0) + label_margin_left + (available_width - grid_width) / 2
        y_offset = self.view.y(n_rows) + label_margin_top + (available_height - grid_height) / 2

        # Create group for the heatmap
        plot_node = self.nodes["plot"]
        heatmap_group = self.svg.node(plot_node, class_="annotated-heatmap")

        # Draw row labels on the left
        row_font_size = min(44, int(cell_height * 0.55))
        for i, label in enumerate(self.row_labels):
            y = y_offset + i * (cell_height + gap) + cell_height / 2
            text_node = self.svg.node(heatmap_group, "text", x=x_offset - 25, y=y + row_font_size * 0.35)
            text_node.set("text-anchor", "end")
            text_node.set("fill", INK)
            text_node.set("style", f"font-size:{row_font_size}px;font-weight:600;font-family:sans-serif")
            text_node.text = label

        # Draw column labels at the bottom (rotated for better fit)
        col_font_size = min(44, int(cell_width * 0.55))
        for j, label in enumerate(self.col_labels):
            x = x_offset + j * (cell_width + gap) + cell_width / 2
            y = y_offset + n_rows * (cell_height + gap) + 25
            text_node = self.svg.node(heatmap_group, "text", x=x, y=y)
            text_node.set("text-anchor", "start")
            text_node.set("fill", INK)
            text_node.set("style", f"font-size:{col_font_size}px;font-weight:600;font-family:sans-serif")
            text_node.set("transform", f"rotate(45, {x}, {y})")
            text_node.text = label

        # Draw cells with annotations
        value_font_size = min(42, int(min(cell_width, cell_height) * 0.35))
        for i in range(n_rows):
            for j in range(n_cols):
                value = self.matrix_data[i][j]
                color = self._interpolate_color(value)
                text_color = self._get_text_color(color)

                x = x_offset + j * (cell_width + gap)
                y = y_offset + i * (cell_height + gap)

                # Draw cell rectangle with rounded corners
                rect = self.svg.node(heatmap_group, "rect", x=x, y=y, width=cell_width, height=cell_height, rx=4, ry=4)
                rect.set("fill", color)
                rect.set("stroke", PAGE_BG)
                rect.set("stroke-width", "2")

                # Add value annotation with automatic contrast
                if self.show_values:
                    text_x = x + cell_width / 2
                    text_y = y + cell_height / 2 + value_font_size * 0.35

                    text_node = self.svg.node(heatmap_group, "text", x=text_x, y=text_y)
                    text_node.set("text-anchor", "middle")
                    text_node.set("fill", text_color)
                    text_node.set("style", f"font-size:{value_font_size}px;font-weight:bold;font-family:sans-serif")
                    text_node.text = f"{value:{self.value_format}}"

        # Draw colorbar on the right
        colorbar_width = 55
        colorbar_height = grid_height * 0.8
        colorbar_x = x_offset + grid_width + 90
        colorbar_y = y_offset + (grid_height - colorbar_height) / 2

        # Draw gradient colorbar using multiple rectangles
        n_segments = 50
        segment_height = colorbar_height / n_segments
        for seg_i in range(n_segments):
            seg_value = min_val + (max_val - min_val) * (n_segments - 1 - seg_i) / (n_segments - 1)
            seg_color = self._interpolate_color(seg_value)
            seg_y = colorbar_y + seg_i * segment_height

            self.svg.node(
                heatmap_group,
                "rect",
                x=colorbar_x,
                y=seg_y,
                width=colorbar_width,
                height=segment_height + 1,
                fill=seg_color,
            )

        # Colorbar border
        self.svg.node(
            heatmap_group,
            "rect",
            x=colorbar_x,
            y=colorbar_y,
            width=colorbar_width,
            height=colorbar_height,
            fill="none",
            stroke=INK,
            stroke_width="2",
        )

        # Colorbar labels
        cb_label_size = 38
        # Max value
        text_node = self.svg.node(
            heatmap_group, "text", x=colorbar_x + colorbar_width + 15, y=colorbar_y + cb_label_size * 0.35
        )
        text_node.set("fill", INK)
        text_node.set("style", f"font-size:{cb_label_size}px;font-family:sans-serif")
        text_node.text = f"{max_val:{self.value_format}}"

        # Mid value
        mid_y = colorbar_y + colorbar_height / 2
        text_node = self.svg.node(
            heatmap_group, "text", x=colorbar_x + colorbar_width + 15, y=mid_y + cb_label_size * 0.35
        )
        text_node.set("fill", INK)
        text_node.set("style", f"font-size:{cb_label_size}px;font-family:sans-serif")
        text_node.text = f"{(min_val + max_val) / 2:{self.value_format}}"

        # Min value
        text_node = self.svg.node(
            heatmap_group,
            "text",
            x=colorbar_x + colorbar_width + 15,
            y=colorbar_y + colorbar_height + cb_label_size * 0.35,
        )
        text_node.set("fill", INK)
        text_node.set("style", f"font-size:{cb_label_size}px;font-family:sans-serif")
        text_node.text = f"{min_val:{self.value_format}}"

        # Colorbar title
        cb_title_size = 42
        cb_title_x = colorbar_x + colorbar_width / 2
        cb_title_y = colorbar_y - 35
        text_node = self.svg.node(heatmap_group, "text", x=cb_title_x, y=cb_title_y)
        text_node.set("text-anchor", "middle")
        text_node.set("fill", INK)
        text_node.set("style", f"font-size:{cb_title_size}px;font-weight:bold;font-family:sans-serif")
        text_node.text = "Correlation"

    def _compute(self):
        """Compute the box for rendering."""
        n_rows = len(self.matrix_data) if self.matrix_data else 1
        n_cols = len(self.matrix_data[0]) if self.matrix_data and len(self.matrix_data) > 0 else 1
        self._box.xmin = 0
        self._box.xmax = n_cols
        self._box.ymin = 0
        self._box.ymax = n_rows


# Data: Correlation matrix for business metrics (symmetric, hardcoded for reproducibility)

# Variable names for correlation matrix
variables = ["Revenue", "Marketing", "R&D Spend", "Customers", "Satisfaction", "Retention"]
n = len(variables)

# Realistic correlation matrix (symmetric, diagonal = 1.0), including a couple of
# mild negative correlations (R&D spend competes with marketing budget and briefly
# disrupts satisfaction) to exercise the full diverging colormap.
correlation_matrix = [
    [1.00, 0.85, 0.42, 0.78, 0.65, 0.72],  # Revenue
    [0.85, 1.00, -0.18, 0.68, 0.55, 0.62],  # Marketing
    [0.42, -0.18, 1.00, 0.28, -0.12, 0.38],  # R&D Spend
    [0.78, 0.68, 0.28, 1.00, 0.82, 0.88],  # Customers
    [0.65, 0.55, -0.12, 0.82, 1.00, 0.75],  # Satisfaction
    [0.72, 0.62, 0.38, 0.88, 0.75, 1.00],  # Retention
]

# Theme-adaptive custom style
custom_style = Style(
    background=PAGE_BG,
    plot_background=PAGE_BG,
    foreground=INK,
    foreground_strong=INK,
    foreground_subtle=INK_MUTED,
    colors=("#009E73",),
    title_font_size=72,
    legend_font_size=48,
    label_font_size=44,
    value_font_size=38,
    font_family="sans-serif",
)

# Diverging colormap (Imprint imprint_div): matte-red -> theme midpoint -> blue
MIDPOINT = PAGE_BG
diverging_colormap = [
    "#AE3030",  # matte red (low correlation)
    MIDPOINT,  # theme-adaptive neutral midpoint
    "#4467A3",  # blue (high correlation)
]

# Create annotated heatmap
chart = AnnotatedHeatmap(
    width=2400,
    height=2400,
    style=custom_style,
    title="heatmap-annotated · pygal · anyplot.ai",
    matrix_data=correlation_matrix,
    row_labels=variables,
    col_labels=variables,
    colormap=diverging_colormap,
    show_values=True,
    value_format=".2f",
    is_symmetric=True,
    show_legend=False,
    margin=120,
    margin_top=150,
    margin_bottom=100,
    show_x_labels=False,
    show_y_labels=False,
)

# Add a dummy series to trigger _plot (pygal requires at least one series)
chart.add("", [0])

# Save outputs with theme-suffixed filenames
chart.render_to_png(f"plot-{THEME}.png")

# Also save HTML for interactivity
chart_svg = chart.render(is_unicode=True)
html_content = f"""<!DOCTYPE html>
<html>
<head>
    <meta charset="utf-8">
    <title>heatmap-annotated - pygal</title>
    <style>
        body {{ margin: 0; display: flex; justify-content: center; align-items: center; min-height: 100vh; background: {PAGE_BG}; }}
        .chart {{ max-width: 100%; height: auto; }}
    </style>
</head>
<body>
    <figure class="chart">
        {chart_svg}
    </figure>
</body>
</html>
"""

with open(f"plot-{THEME}.html", "w", encoding="utf-8") as f:
    f.write(html_content)
Runnable source as JSON, for any HTTP client: https://api.anyplot.ai/specs/heatmap-annotated/pygal/code. Any spec id and library id listed in llms-full.txt fit the same URL shape; every URL below is complete and callable.
{
  "spec_id": "heatmap-annotated",
  "language": "python",
  "library": "pygal",
  "page": "https://anyplot.ai/heatmap-annotated/python/pygal",
  "hub": "https://anyplot.ai/heatmap-annotated",
  "code_json": "https://api.anyplot.ai/specs/heatmap-annotated/pygal/code",
  "spec_json": "https://api.anyplot.ai/specs/heatmap-annotated",
  "render_light_png": "https://storage.googleapis.com/anyplot-images/plots/heatmap-annotated/python/pygal/plot-light.png",
  "render_dark_png": "https://storage.googleapis.com/anyplot-images/plots/heatmap-annotated/python/pygal/plot-dark.png",
  "interactive_light_html": "https://storage.googleapis.com/anyplot-images/plots/heatmap-annotated/python/pygal/plot-light.html",
  "interactive_dark_html": "https://storage.googleapis.com/anyplot-images/plots/heatmap-annotated/python/pygal/plot-dark.html",
  "quality_score": 89.0,
  "license": "MIT",
  "guide": "https://anyplot.ai/llms.txt"
}
Part of Annotated Heatmap on anyplot.ai.