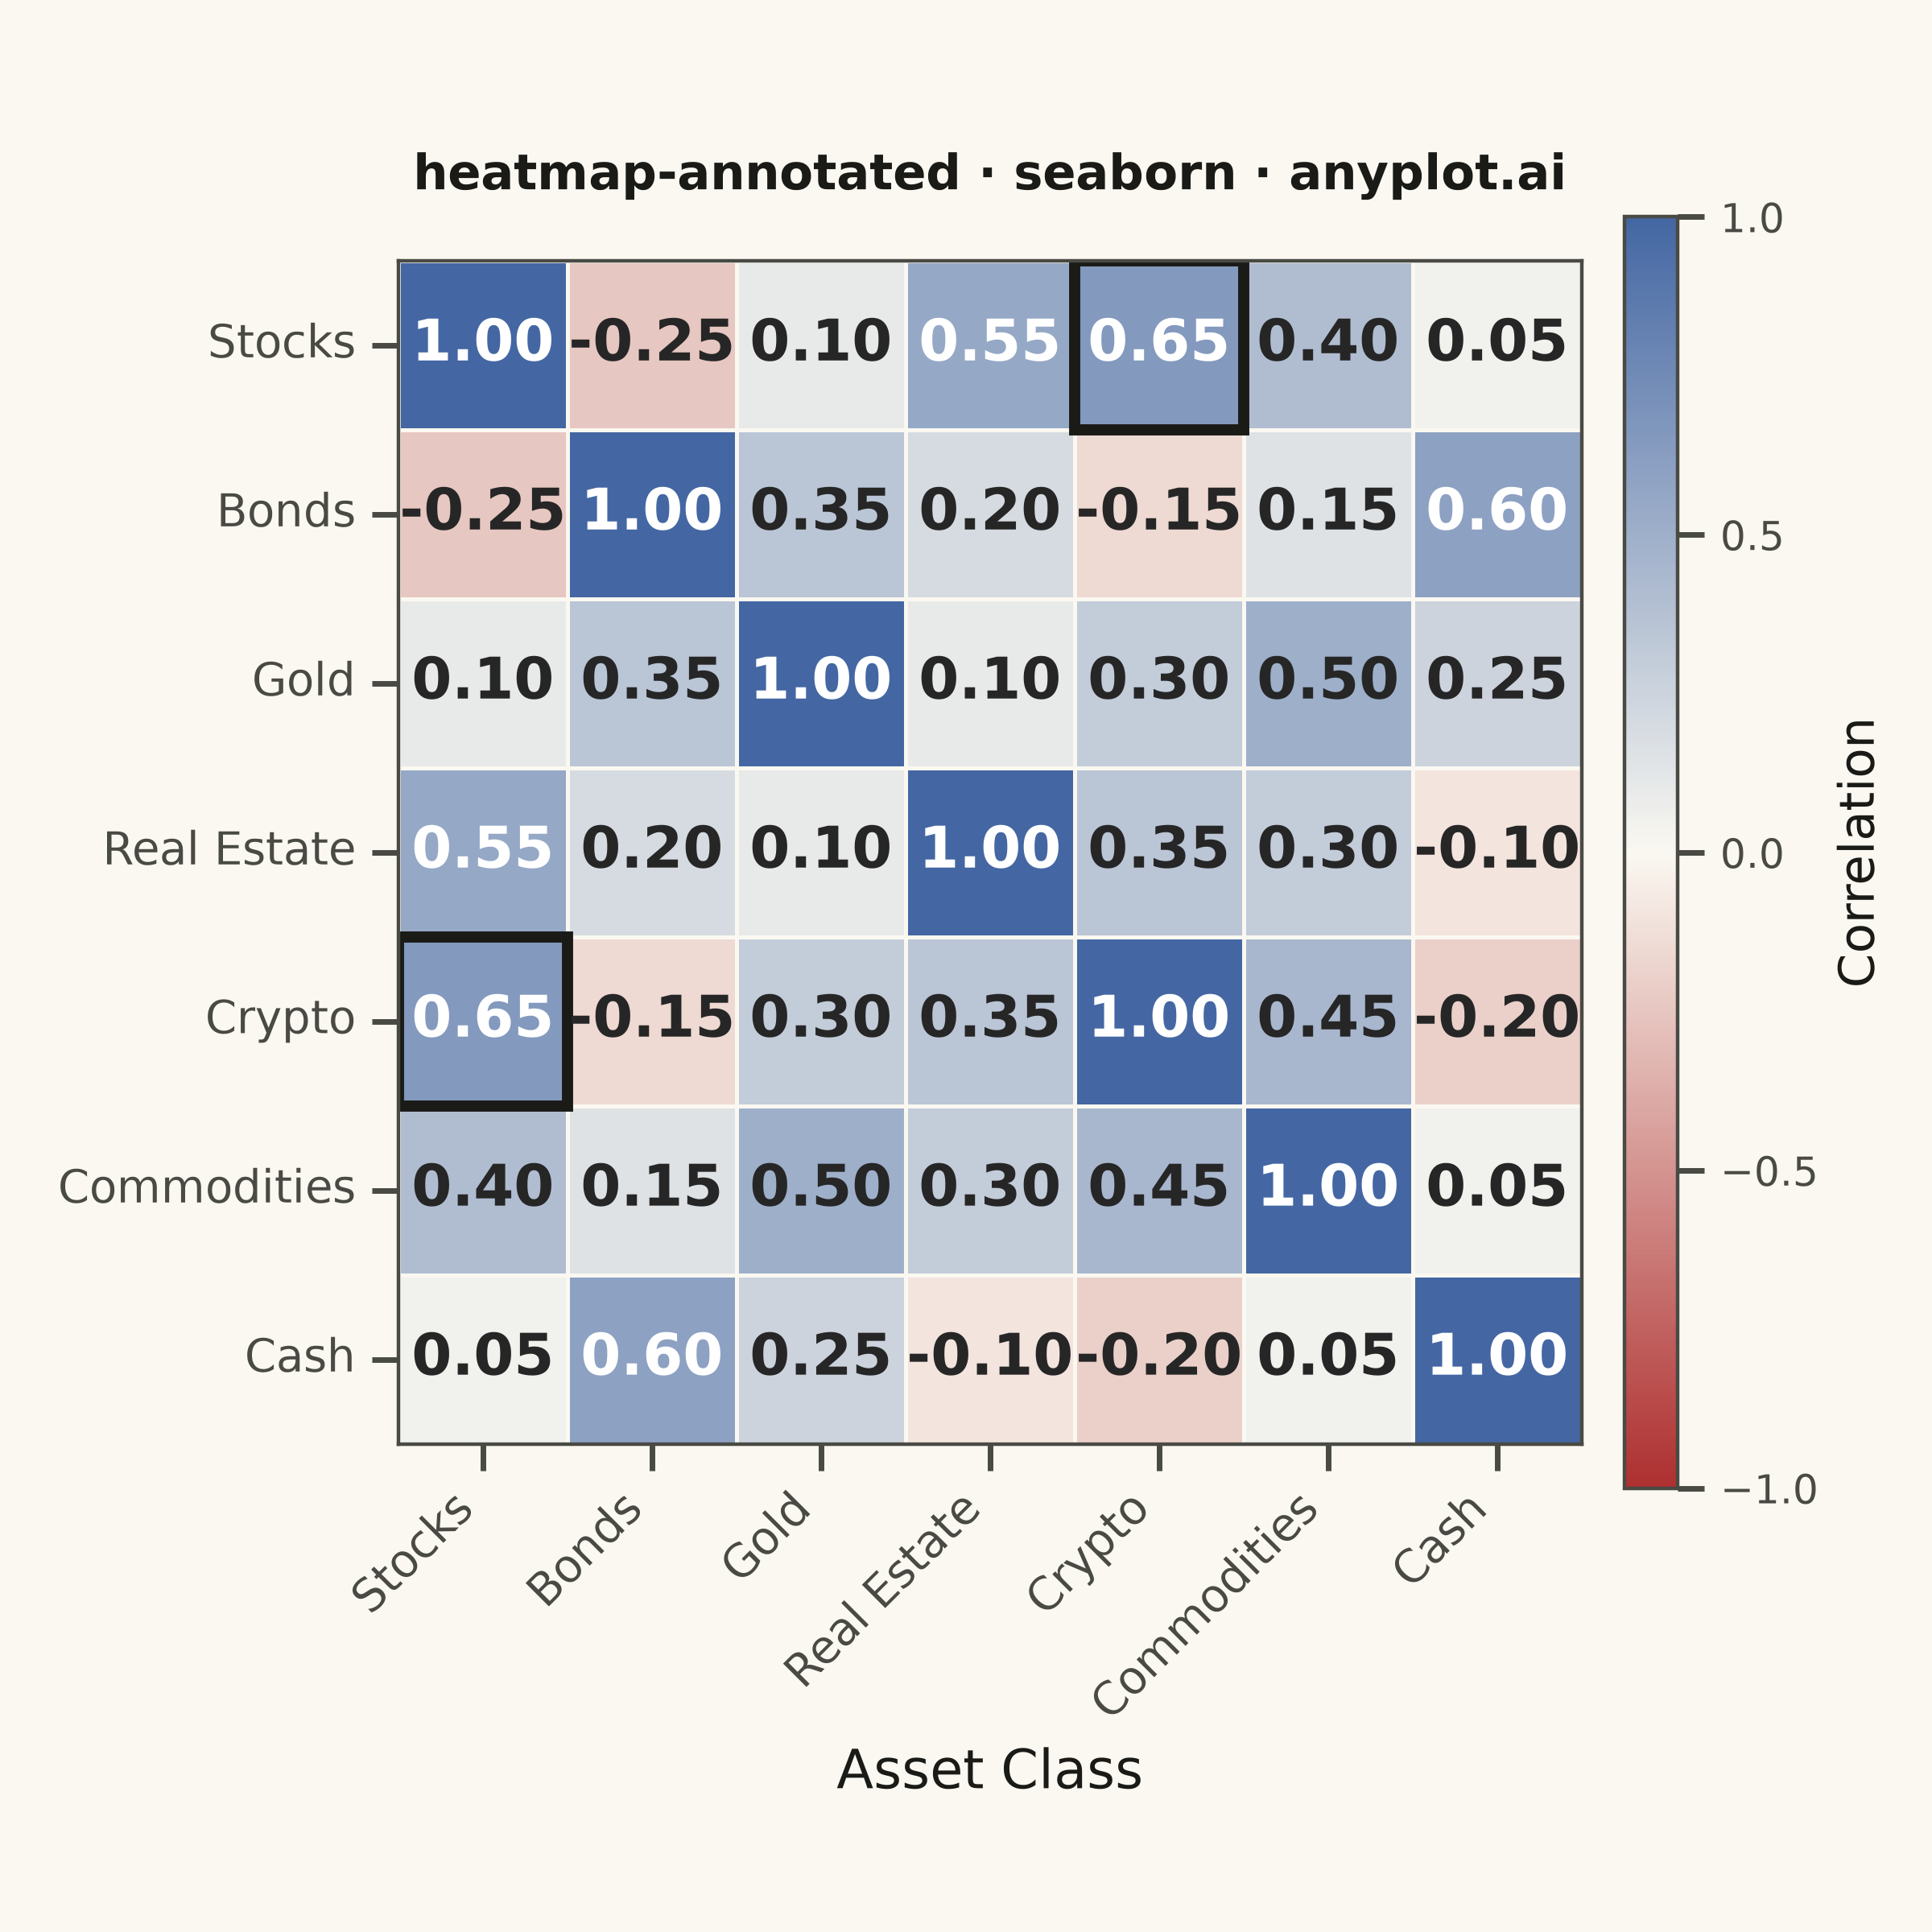
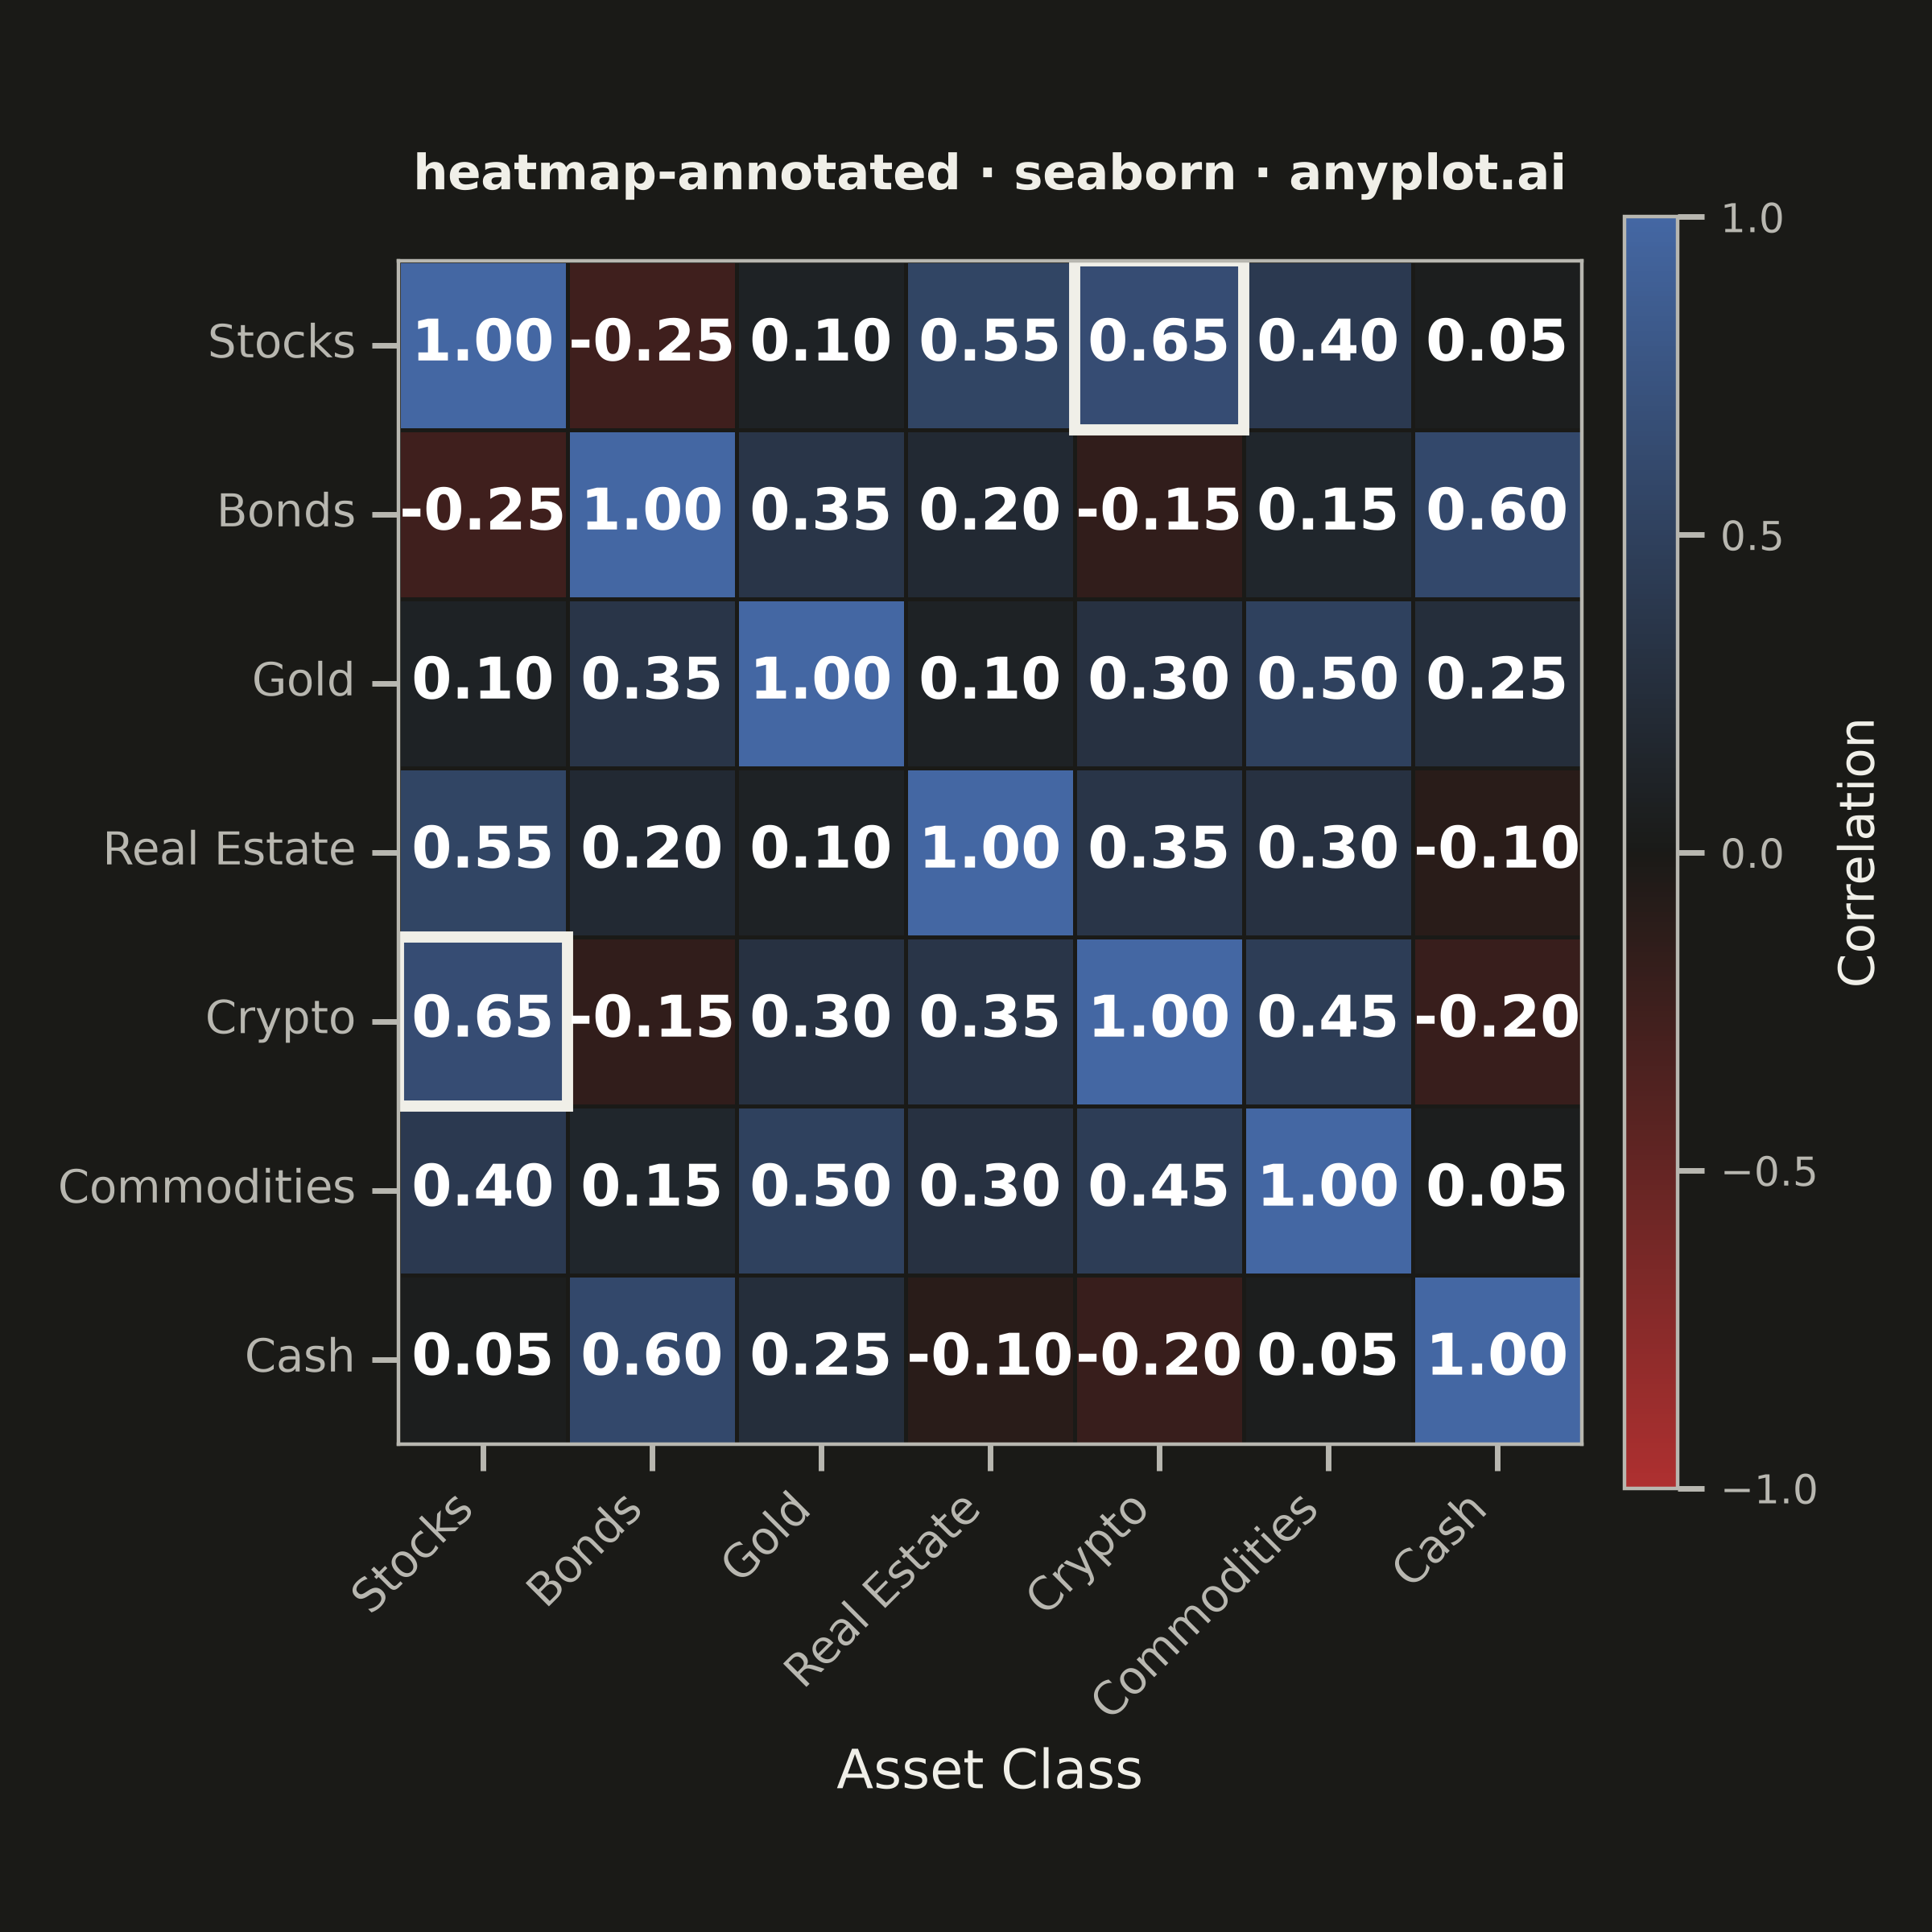
A heatmap with numeric values displayed inside each cell, combining color intensity with exact value labels. Essential for correlation matrices, confusion matrices, and any matrix visualization where both pattern recognition and precise values matter. Text color automatically contrasts with background for readability.
""" anyplot.ai
heatmap-annotated: Annotated Heatmap
Library: seaborn 0.13.2 | Python 3.13.14
Quality: 89/100 | Updated: 2026-08-05
"""

import os

import matplotlib.pyplot as plt
import numpy as np
import pandas as pd
import seaborn as sns
from matplotlib.colors import LinearSegmentedColormap


# Theme tokens
THEME = os.getenv("ANYPLOT_THEME", "light")
PAGE_BG = "#FAF8F1" if THEME == "light" else "#1A1A17"
ELEVATED_BG = "#FFFDF6" if THEME == "light" else "#242420"
INK = "#1A1A17" if THEME == "light" else "#F0EFE8"
INK_SOFT = "#4A4A44" if THEME == "light" else "#B8B7B0"

# Global theme — idiomatic seaborn styling rather than per-artist overrides
sns.set_theme(
    style="ticks",
    rc={
        "figure.facecolor": PAGE_BG,
        "axes.facecolor": PAGE_BG,
        "axes.edgecolor": INK_SOFT,
        "axes.labelcolor": INK,
        "text.color": INK,
        "xtick.color": INK_SOFT,
        "ytick.color": INK_SOFT,
    },
)

# Imprint diverging colormap — correlations have a meaningful zero midpoint
imprint_div = LinearSegmentedColormap.from_list("imprint_div", ["#AE3030", PAGE_BG, "#4467A3"])

# Data - Correlation matrix for realistic financial variables
np.random.seed(42)

variables = ["Stocks", "Bonds", "Gold", "Real Estate", "Crypto", "Commodities", "Cash"]

# Create a realistic correlation matrix with meaningful relationships
n = len(variables)
corr_matrix = np.eye(n)

# Define some realistic correlations
correlations = {
    (0, 1): -0.25,  # Stocks-Bonds (negative)
    (0, 2): 0.10,  # Stocks-Gold (weak positive)
    (0, 3): 0.55,  # Stocks-Real Estate (moderate positive)
    (0, 4): 0.65,  # Stocks-Crypto (positive)
    (0, 5): 0.40,  # Stocks-Commodities (moderate)
    (0, 6): 0.05,  # Stocks-Cash (near zero)
    (1, 2): 0.35,  # Bonds-Gold (positive)
    (1, 3): 0.20,  # Bonds-Real Estate (weak positive)
    (1, 4): -0.15,  # Bonds-Crypto (weak negative)
    (1, 5): 0.15,  # Bonds-Commodities (weak positive)
    (1, 6): 0.60,  # Bonds-Cash (positive)
    (2, 3): 0.10,  # Gold-Real Estate (weak)
    (2, 4): 0.30,  # Gold-Crypto (moderate)
    (2, 5): 0.50,  # Gold-Commodities (positive)
    (2, 6): 0.25,  # Gold-Cash (weak positive)
    (3, 4): 0.35,  # Real Estate-Crypto (moderate)
    (3, 5): 0.30,  # Real Estate-Commodities (moderate)
    (3, 6): -0.10,  # Real Estate-Cash (weak negative)
    (4, 5): 0.45,  # Crypto-Commodities (moderate)
    (4, 6): -0.20,  # Crypto-Cash (negative)
    (5, 6): 0.05,  # Commodities-Cash (near zero)
}

# Fill symmetric matrix
for (i, j), val in correlations.items():
    corr_matrix[i, j] = val
    corr_matrix[j, i] = val

# Create DataFrame
df_corr = pd.DataFrame(corr_matrix, index=variables, columns=variables)

# Plot - Square format (6x6 in @ 400 dpi = 2400x2400 px, canonical square canvas)
fig, ax = plt.subplots(figsize=(6, 6), dpi=400, facecolor=PAGE_BG)

# Use seaborn's heatmap with annotations and the Imprint diverging colormap
sns.heatmap(
    df_corr,
    annot=True,
    fmt=".2f",
    cmap=imprint_div,
    center=0,
    vmin=-1,
    vmax=1,
    square=True,
    linewidths=0.6,
    linecolor=PAGE_BG,
    cbar_kws={"shrink": 0.8, "pad": 0.03, "aspect": 24, "label": "Correlation", "ticks": [-1, -0.5, 0, 0.5, 1]},
    annot_kws={"size": 13, "weight": "bold"},
    ax=ax,
)

# Highlight the strongest off-diagonal correlation for visual hierarchy
off_diag = np.abs(corr_matrix.copy())
np.fill_diagonal(off_diag, 0)
peak_i, peak_j = np.unravel_index(np.argmax(off_diag), off_diag.shape)
for i, j in {(peak_i, peak_j), (peak_j, peak_i)}:
    ax.add_patch(plt.Rectangle((j, i), 1, 1, fill=False, edgecolor=INK, linewidth=2.5))

# Style
ax.set_title("heatmap-annotated · seaborn · anyplot.ai", fontsize=11, pad=16, weight="bold", color=INK)
ax.set_xlabel("Asset Class", fontsize=12, color=INK)
ax.tick_params(axis="both", labelsize=10, colors=INK_SOFT)

# Enclosed heatmap grid — keep all four spines, styled thin and theme-adaptive
for spine in ax.spines.values():
    spine.set_visible(True)
    spine.set_edgecolor(INK_SOFT)
    spine.set_linewidth(0.8)

# Rotate x-axis labels for better readability
plt.xticks(rotation=45, ha="right")
plt.yticks(rotation=0)

# Adjust colorbar label size and colors
cbar = ax.collections[0].colorbar
cbar.ax.tick_params(labelsize=9, colors=INK_SOFT)
cbar.ax.set_ylabel("Correlation", fontsize=11, color=INK)
cbar.outline.set_edgecolor(INK_SOFT)
cbar.outline.set_linewidth(0.8)

plt.tight_layout()
plt.savefig(f"plot-{THEME}.png", dpi=400, facecolor=PAGE_BG)
Runnable source as JSON, for any HTTP client: https://api.anyplot.ai/specs/heatmap-annotated/seaborn/code. Any spec id and library id listed in llms-full.txt fit the same URL shape; every URL below is complete and callable.
{
  "spec_id": "heatmap-annotated",
  "language": "python",
  "library": "seaborn",
  "page": "https://anyplot.ai/heatmap-annotated/python/seaborn",
  "hub": "https://anyplot.ai/heatmap-annotated",
  "code_json": "https://api.anyplot.ai/specs/heatmap-annotated/seaborn/code",
  "spec_json": "https://api.anyplot.ai/specs/heatmap-annotated",
  "render_light_png": "https://storage.googleapis.com/anyplot-images/plots/heatmap-annotated/python/seaborn/plot-light.png",
  "render_dark_png": "https://storage.googleapis.com/anyplot-images/plots/heatmap-annotated/python/seaborn/plot-dark.png",
  "quality_score": 89.0,
  "license": "MIT",
  "guide": "https://anyplot.ai/llms.txt"
}
Part of Annotated Heatmap on anyplot.ai.