The same plot in 14 other libraries — JavaScript: Chart.js, D3.js, Apache ECharts, MUI X Charts; Python: Altair, Bokeh, lets-plot, Matplotlib, Plotly, plotnine, Pygal, Seaborn; R: ggplot2; Julia: Makie.jl. Compare all 15 side by side: Annotated Heatmap in Python, R, Julia and JavaScript.
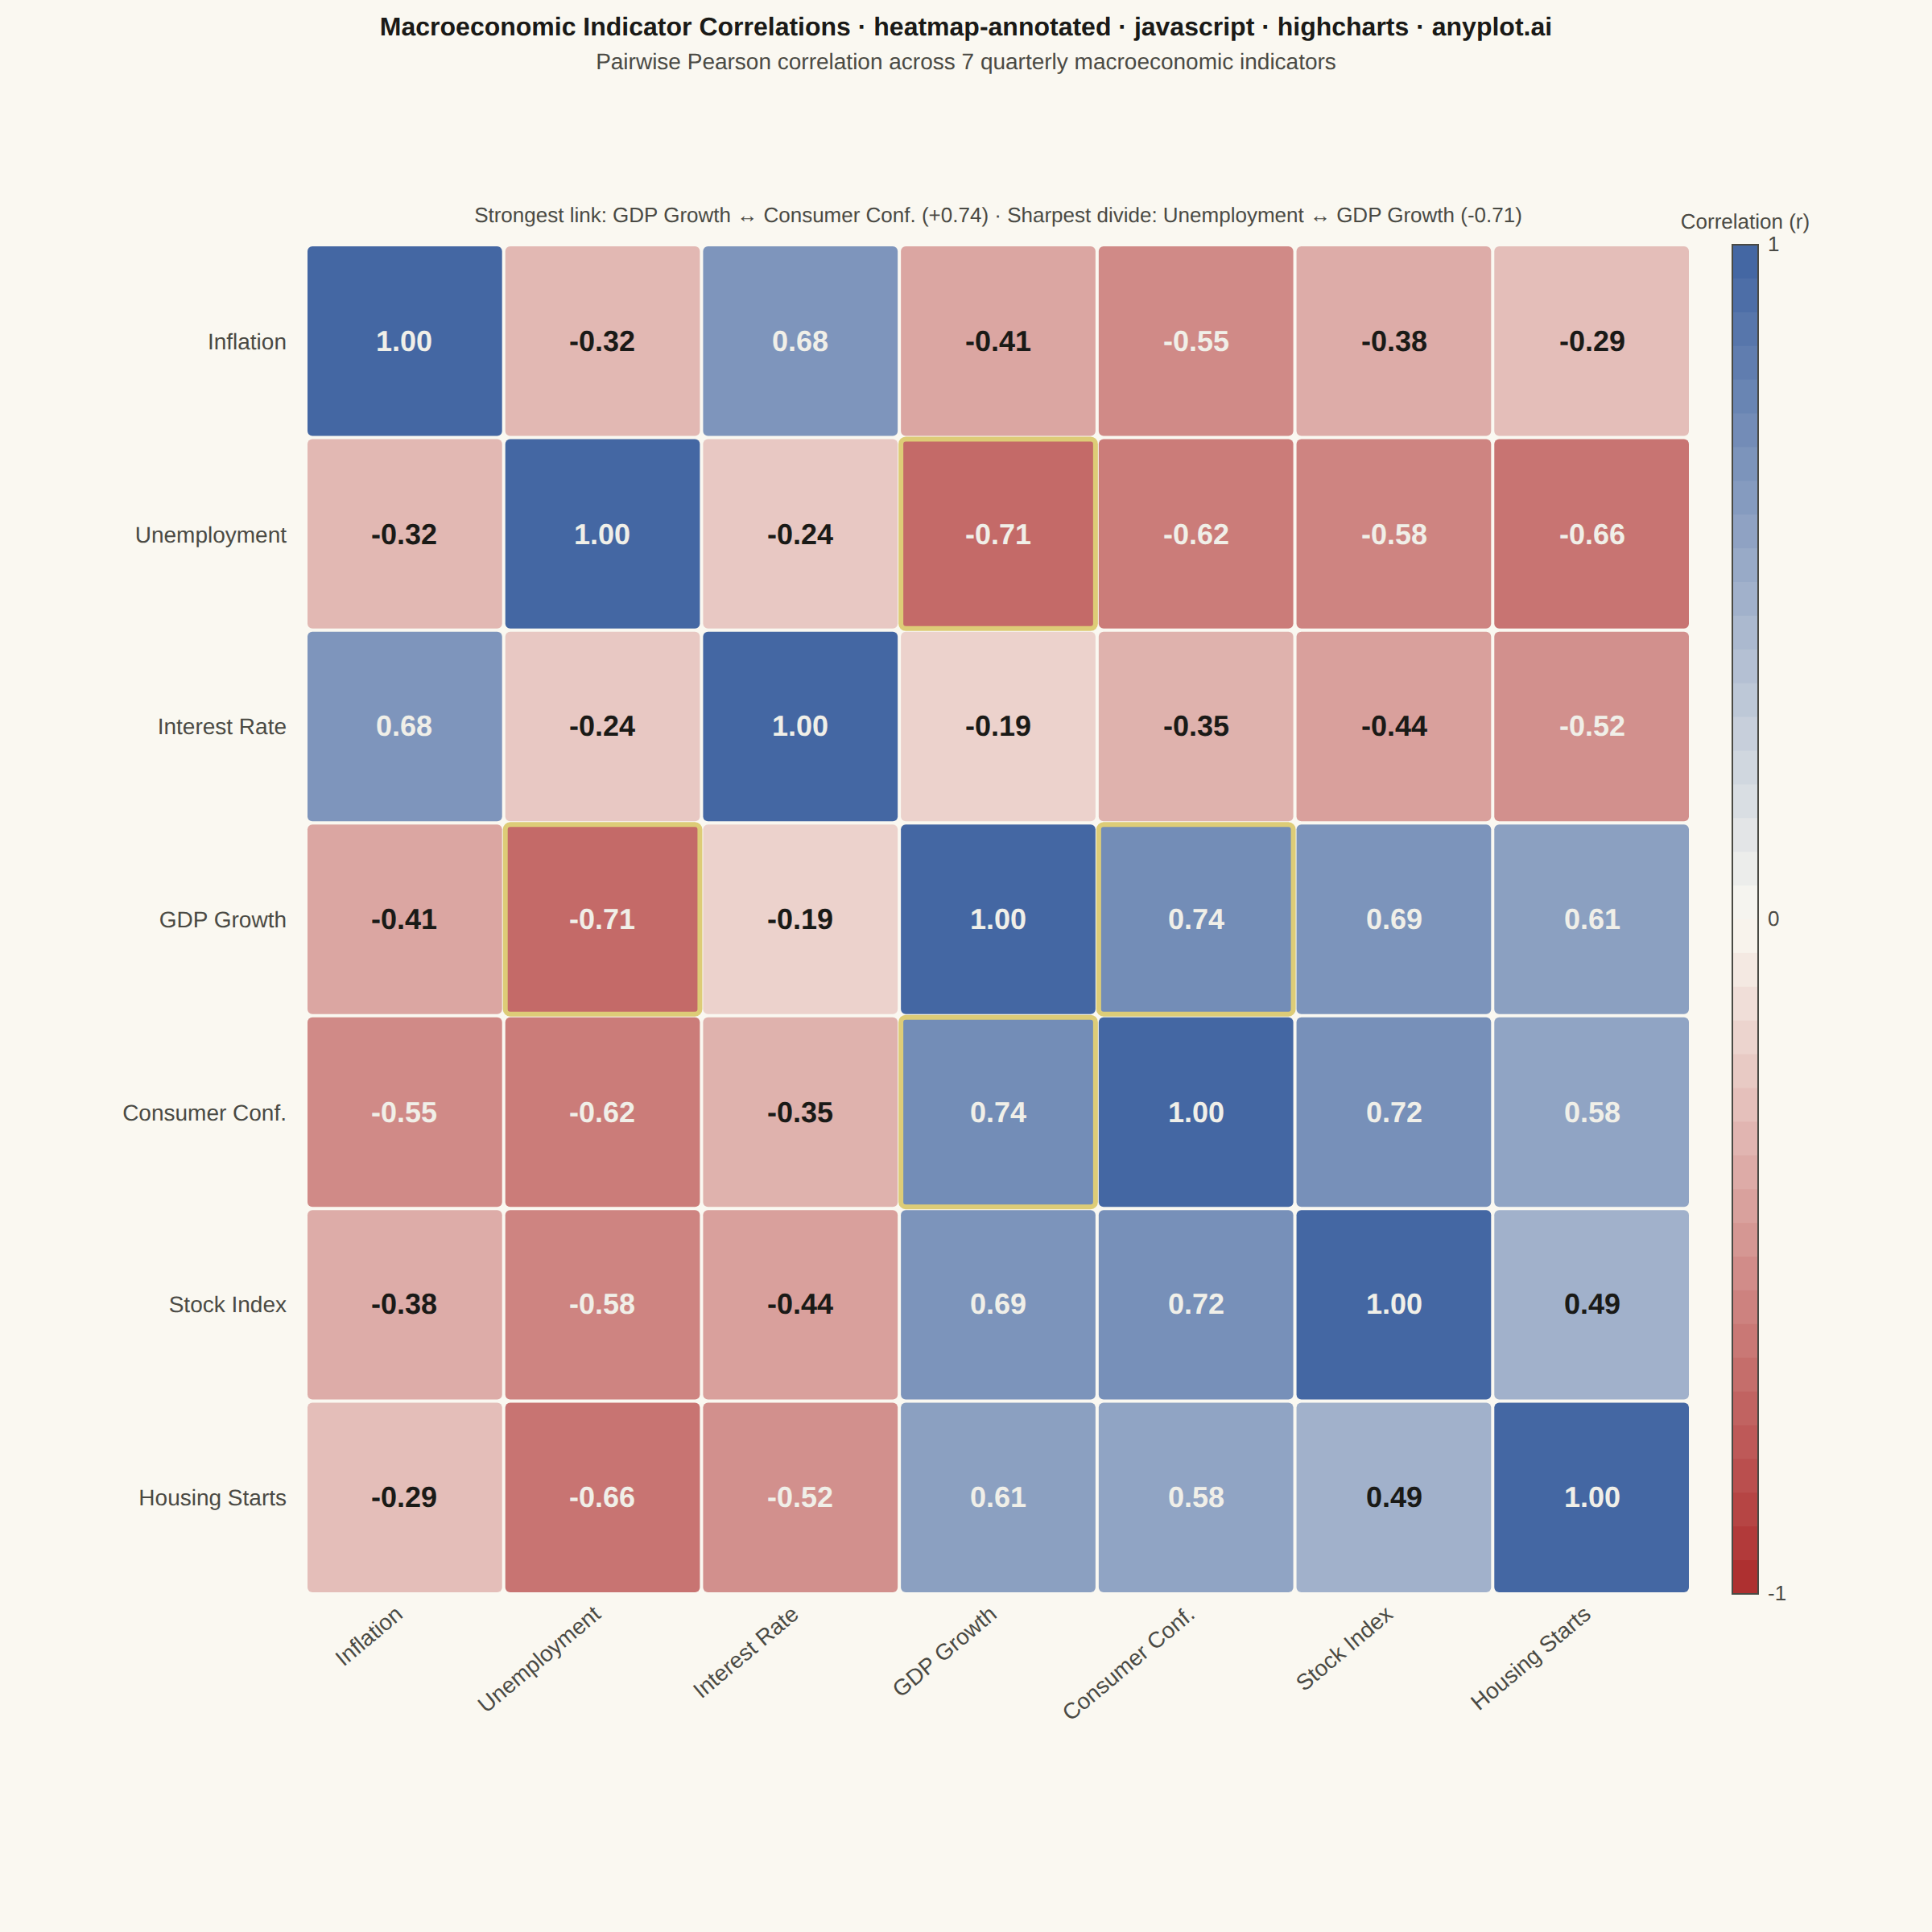
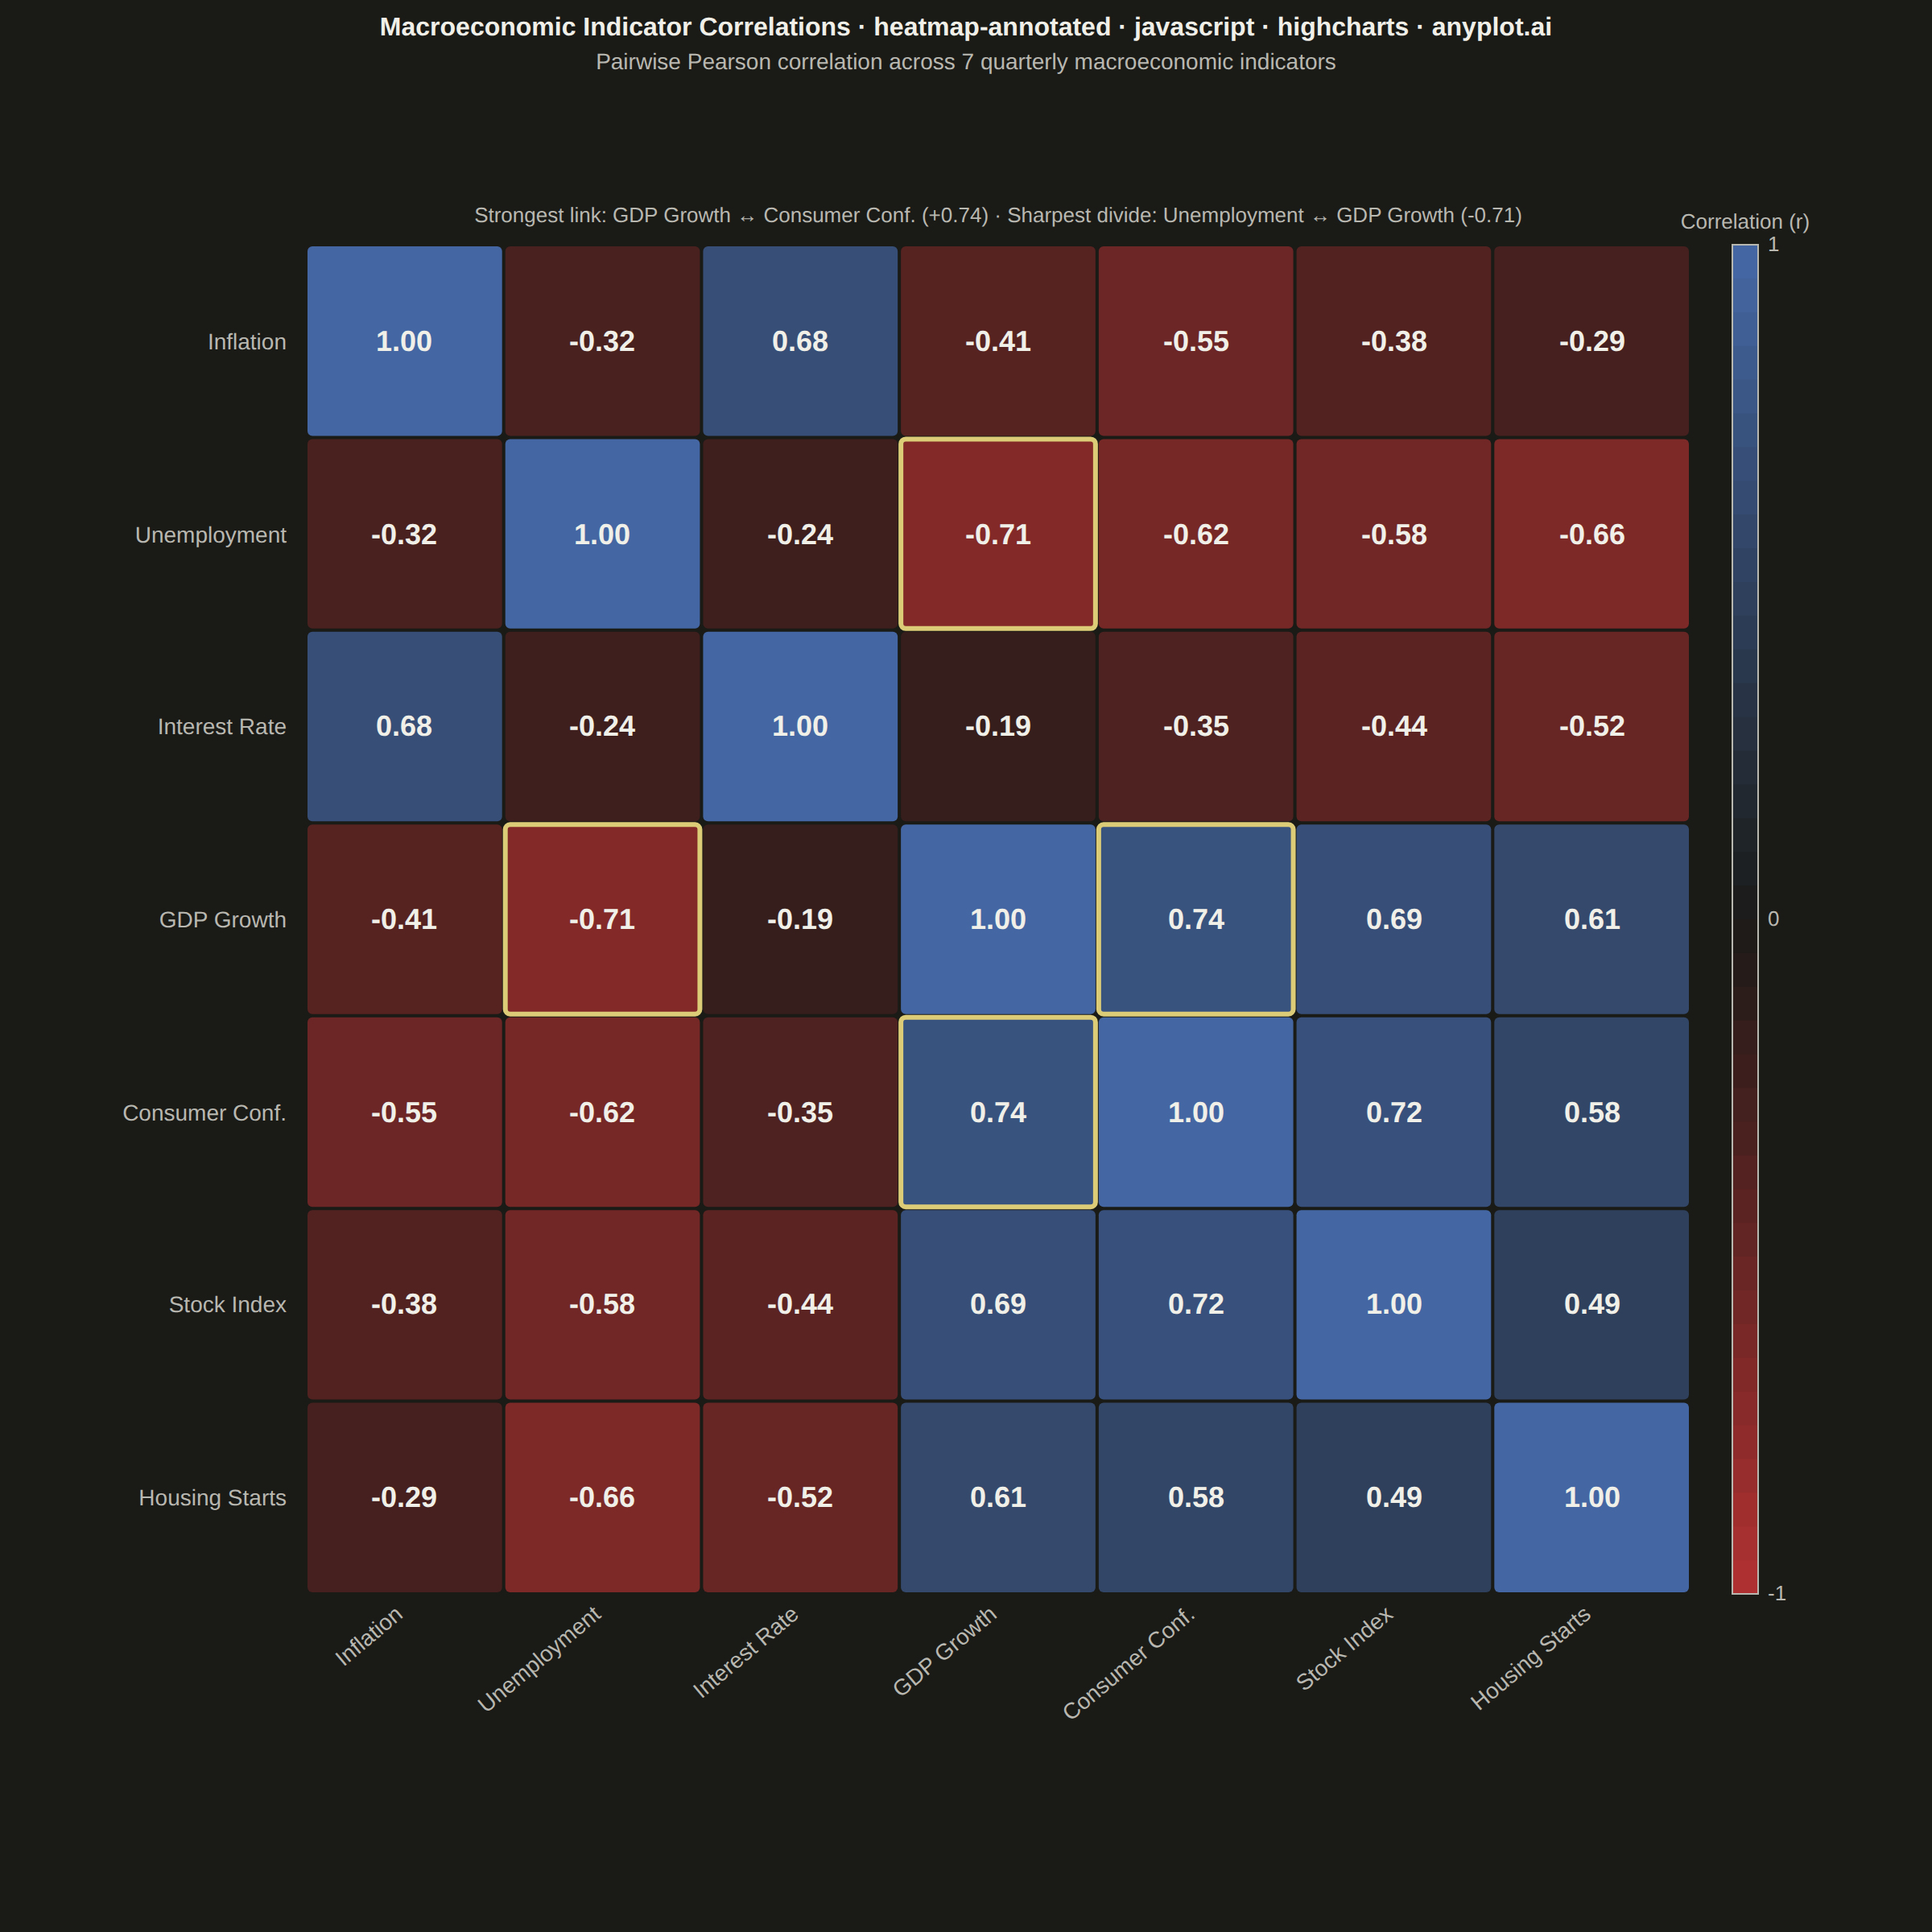
A heatmap with numeric values displayed inside each cell, combining color intensity with exact value labels. Essential for correlation matrices, confusion matrices, and any matrix visualization where both pattern recognition and precise values matter. Text color automatically contrasts with background for readability.
// anyplot.ai
// heatmap-annotated: Annotated Heatmap
// Library: highcharts 12.6.0 | JavaScript 22.23.1
// Quality: 92/100 | Created: 2026-08-05
//# anyplot-orientation: square

const t = window.ANYPLOT_TOKENS;

// --- Data: pairwise correlation matrix across macroeconomic indicators -----
const LABELS = [
  'Inflation', 'Unemployment', 'Interest Rate', 'GDP Growth',
  'Consumer Conf.', 'Stock Index', 'Housing Starts',
];
const N = LABELS.length;

// Symmetric correlation matrix, diagonal = 1.00
const CORR = [
  [ 1.00, -0.32,  0.68, -0.41, -0.55, -0.38, -0.29],
  [-0.32,  1.00, -0.24, -0.71, -0.62, -0.58, -0.66],
  [ 0.68, -0.24,  1.00, -0.19, -0.35, -0.44, -0.52],
  [-0.41, -0.71, -0.19,  1.00,  0.74,  0.69,  0.61],
  [-0.55, -0.62, -0.35,  0.74,  1.00,  0.72,  0.58],
  [-0.38, -0.58, -0.44,  0.69,  0.72,  1.00,  0.49],
  [-0.29, -0.66, -0.52,  0.61,  0.58,  0.49,  1.00],
];

// --- Data storytelling: surface the single strongest off-diagonal pair in
// each direction, so the reader has a focal point beyond raw color scanning.
function strongestPair(matrix, n, wantMax) {
  let best = wantMax ? -Infinity : Infinity;
  let pair = [0, 1];
  for (let i = 0; i < n; i++) {
    for (let j = i + 1; j < n; j++) {
      const v = matrix[i][j];
      if (wantMax ? v > best : v < best) {
        best = v;
        pair = [i, j];
      }
    }
  }
  return { value: best, pair };
}

const STRONGEST_POS = strongestPair(CORR, N, true);
const STRONGEST_NEG = strongestPair(CORR, N, false);

// --- Color: imprint_div (red -0.55, page-bg midpoint 0, blue +1) -----------
function hexToRgb(hex) {
  return [parseInt(hex.slice(1, 3), 16), parseInt(hex.slice(3, 5), 16), parseInt(hex.slice(5, 7), 16)];
}

const DIV_LOW = hexToRgb(t.div[0]);   // #AE3030 — negative correlation
const DIV_MID = hexToRgb(t.div[1]);   // page bg  — zero correlation (theme-adaptive)
const DIV_HIGH = hexToRgb(t.div[2]);  // #4467A3 — positive correlation

function lerp(a, b, f) {
  return a + (b - a) * f;
}

function colorAt(value) {
  const a = value <= 0 ? DIV_LOW : DIV_MID;
  const b = value <= 0 ? DIV_MID : DIV_HIGH;
  const f = value <= 0 ? value + 1 : value;
  return [
    Math.round(lerp(a[0], b[0], f)),
    Math.round(lerp(a[1], b[1], f)),
    Math.round(lerp(a[2], b[2], f)),
  ];
}

function cellBg(value) {
  const [r, g, b] = colorAt(value);
  return `rgb(${r},${g},${b})`;
}

// Relative luminance — pick text color for maximum contrast against the fill
function textColorFor(value) {
  const [r, g, b] = colorAt(value);
  const lin = (c) => {
    const v = c / 255;
    return v <= 0.03928 ? v / 12.92 : Math.pow((v + 0.055) / 1.055, 2.4);
  };
  const L = 0.2126 * lin(r) + 0.7152 * lin(g) + 0.0722 * lin(b);
  return L > 0.4 ? '#1A1A17' : '#F0EFE8';
}

// --- Title (fontsize scaled off the 67-char baseline) ----------------------
const TITLE_TEXT = 'Macroeconomic Indicator Correlations · heatmap-annotated · javascript · highcharts · anyplot.ai';
const TITLE_FS = Math.max(Math.round(22 * Math.min(1, 67 / TITLE_TEXT.length)), 14);

const drawn = [];

function clearDrawn() {
  drawn.forEach((el) => {
    try { el.destroy(); } catch (_err) { /* already gone */ }
  });
  drawn.length = 0;
}

function drawAll() {
  const ch = this;
  clearDrawn();
  const r = ch.renderer;

  const cW = ch.plotWidth / N;
  const cH = ch.plotHeight / N;

  // Cells + value annotations
  for (let row = 0; row < N; row++) {
    for (let col = 0; col < N; col++) {
      const value = CORR[row][col];
      const x = ch.plotLeft + col * cW;
      const y = ch.plotTop + row * cH;

      drawn.push(
        r.rect(x + 1, y + 1, cW - 2, cH - 2, 3)
          .attr({ fill: cellBg(value), zIndex: 2 })
          .add()
      );

      drawn.push(
        r.text(value.toFixed(2), x + cW / 2, y + cH / 2 + 6)
          .attr({ align: 'center', zIndex: 3 })
          .css({ color: textColorFor(value), fontSize: '18px', fontWeight: '600' })
          .add()
      );
    }
  }

  // Highlight the strongest positive and negative pair (both symmetric cells)
  // with an amber focal outline — a storytelling device beyond raw color.
  function outlineCell(row, col) {
    const x = ch.plotLeft + col * cW;
    const y = ch.plotTop + row * cH;
    drawn.push(
      r.rect(x + 1, y + 1, cW - 2, cH - 2, 3)
        .attr({ fill: 'none', stroke: t.amber, 'stroke-width': 3, zIndex: 2.5 })
        .add()
    );
  }
  [STRONGEST_POS, STRONGEST_NEG].forEach(({ pair: [i, j] }) => {
    outlineCell(i, j);
    outlineCell(j, i);
  });

  // Caption calling out the two highlighted pairs by name and value.
  const fmtPair = (p) => `${LABELS[p.pair[0]]} ↔ ${LABELS[p.pair[1]]}`;
  const fmtVal = (v) => `${v >= 0 ? '+' : ''}${v.toFixed(2)}`;
  const caption =
    `Strongest link: ${fmtPair(STRONGEST_POS)} (${fmtVal(STRONGEST_POS.value)})` +
    `   ·   Sharpest divide: ${fmtPair(STRONGEST_NEG)} (${fmtVal(STRONGEST_NEG.value)})`;
  drawn.push(
    r.text(caption, ch.plotLeft + ch.plotWidth / 2, ch.plotTop - 14)
      .attr({ align: 'center', zIndex: 3 })
      .css({ color: t.inkSoft, fontSize: '13px', fontWeight: '500' })
      .add()
  );

  // Column labels (bottom, rotated for readability)
  LABELS.forEach((lbl, col) => {
    const cx = ch.plotLeft + (col + 0.5) * cW;
    drawn.push(
      r.text(lbl, cx, ch.plotTop + ch.plotHeight + 14)
        .attr({ align: 'right', rotation: -40, zIndex: 3 })
        .css({ color: t.inkSoft, fontSize: '14px' })
        .add()
    );
  });

  // Row labels (left, right-aligned)
  LABELS.forEach((lbl, row) => {
    const cy = ch.plotTop + (row + 0.5) * cH + 5;
    drawn.push(
      r.text(lbl, ch.plotLeft - 12, cy)
        .attr({ align: 'right', zIndex: 3 })
        .css({ color: t.inkSoft, fontSize: '14px' })
        .add()
    );
  });

  // Diverging colorbar (right of plot area) — top = +1 (blue), bottom = -1 (red)
  const barX = ch.plotLeft + ch.plotWidth + 26;
  const barW = 16;
  const nSeg = 40;
  const segH = ch.plotHeight / nSeg;

  for (let i = 0; i < nSeg; i++) {
    const value = 1 - (2 * i) / (nSeg - 1);
    drawn.push(
      r.rect(barX, ch.plotTop + i * segH, barW, segH + 0.5)
        .attr({ fill: cellBg(value), zIndex: 3 })
        .add()
    );
  }

  drawn.push(
    r.rect(barX, ch.plotTop, barW, ch.plotHeight)
      .attr({ fill: 'none', stroke: t.inkSoft, 'stroke-width': 1, zIndex: 4 })
      .add()
  );

  [[1, 0], [0, 0.5], [-1, 1]].forEach(([value, frac]) => {
    drawn.push(
      r.text(value.toFixed(0), barX + barW + 6, ch.plotTop + frac * ch.plotHeight + 4)
        .attr({ align: 'left', zIndex: 4 })
        .css({ color: t.inkSoft, fontSize: '13px' })
        .add()
    );
  });

  drawn.push(
    r.text('Correlation (r)', barX + barW / 2, ch.plotTop - 10)
      .attr({ align: 'center', zIndex: 4 })
      .css({ color: t.inkSoft, fontSize: '13px' })
      .add()
  );
}

Highcharts.chart('container', {
  chart: {
    backgroundColor: 'transparent',
    animation: false,
    style: { fontFamily: 'inherit' },
    margin: [152, 150, 210, 190],
    events: { load: drawAll, redraw: drawAll },
  },
  credits: { enabled: false },
  title: {
    text: TITLE_TEXT,
    style: { color: t.ink, fontSize: TITLE_FS + 'px', fontWeight: '600' },
  },
  subtitle: {
    text: 'Pairwise Pearson correlation across 7 quarterly macroeconomic indicators',
    style: { color: t.inkSoft, fontSize: '14px' },
  },
  xAxis: { visible: false },
  yAxis: { visible: false, gridLineWidth: 0 },
  legend: { enabled: false },
  tooltip: { enabled: false },
  plotOptions: { series: { animation: false } },
  series: [],
});
Runnable source as JSON, for any HTTP client: https://api.anyplot.ai/specs/heatmap-annotated/highcharts/code. Any spec id and library id listed in llms-full.txt fit the same URL shape; every URL below is complete and callable.
{
  "spec_id": "heatmap-annotated",
  "language": "javascript",
  "library": "highcharts",
  "page": "https://anyplot.ai/heatmap-annotated/javascript/highcharts",
  "hub": "https://anyplot.ai/heatmap-annotated",
  "code_json": "https://api.anyplot.ai/specs/heatmap-annotated/highcharts/code",
  "spec_json": "https://api.anyplot.ai/specs/heatmap-annotated",
  "render_light_png": "https://storage.googleapis.com/anyplot-images/plots/heatmap-annotated/javascript/highcharts/plot-light.png",
  "render_dark_png": "https://storage.googleapis.com/anyplot-images/plots/heatmap-annotated/javascript/highcharts/plot-dark.png",
  "interactive_light_html": "https://storage.googleapis.com/anyplot-images/plots/heatmap-annotated/javascript/highcharts/plot-light.html",
  "interactive_dark_html": "https://storage.googleapis.com/anyplot-images/plots/heatmap-annotated/javascript/highcharts/plot-dark.html",
  "quality_score": 92.0,
  "license": "MIT",
  "guide": "https://anyplot.ai/llms.txt"
}
Part of Annotated Heatmap on anyplot.ai.