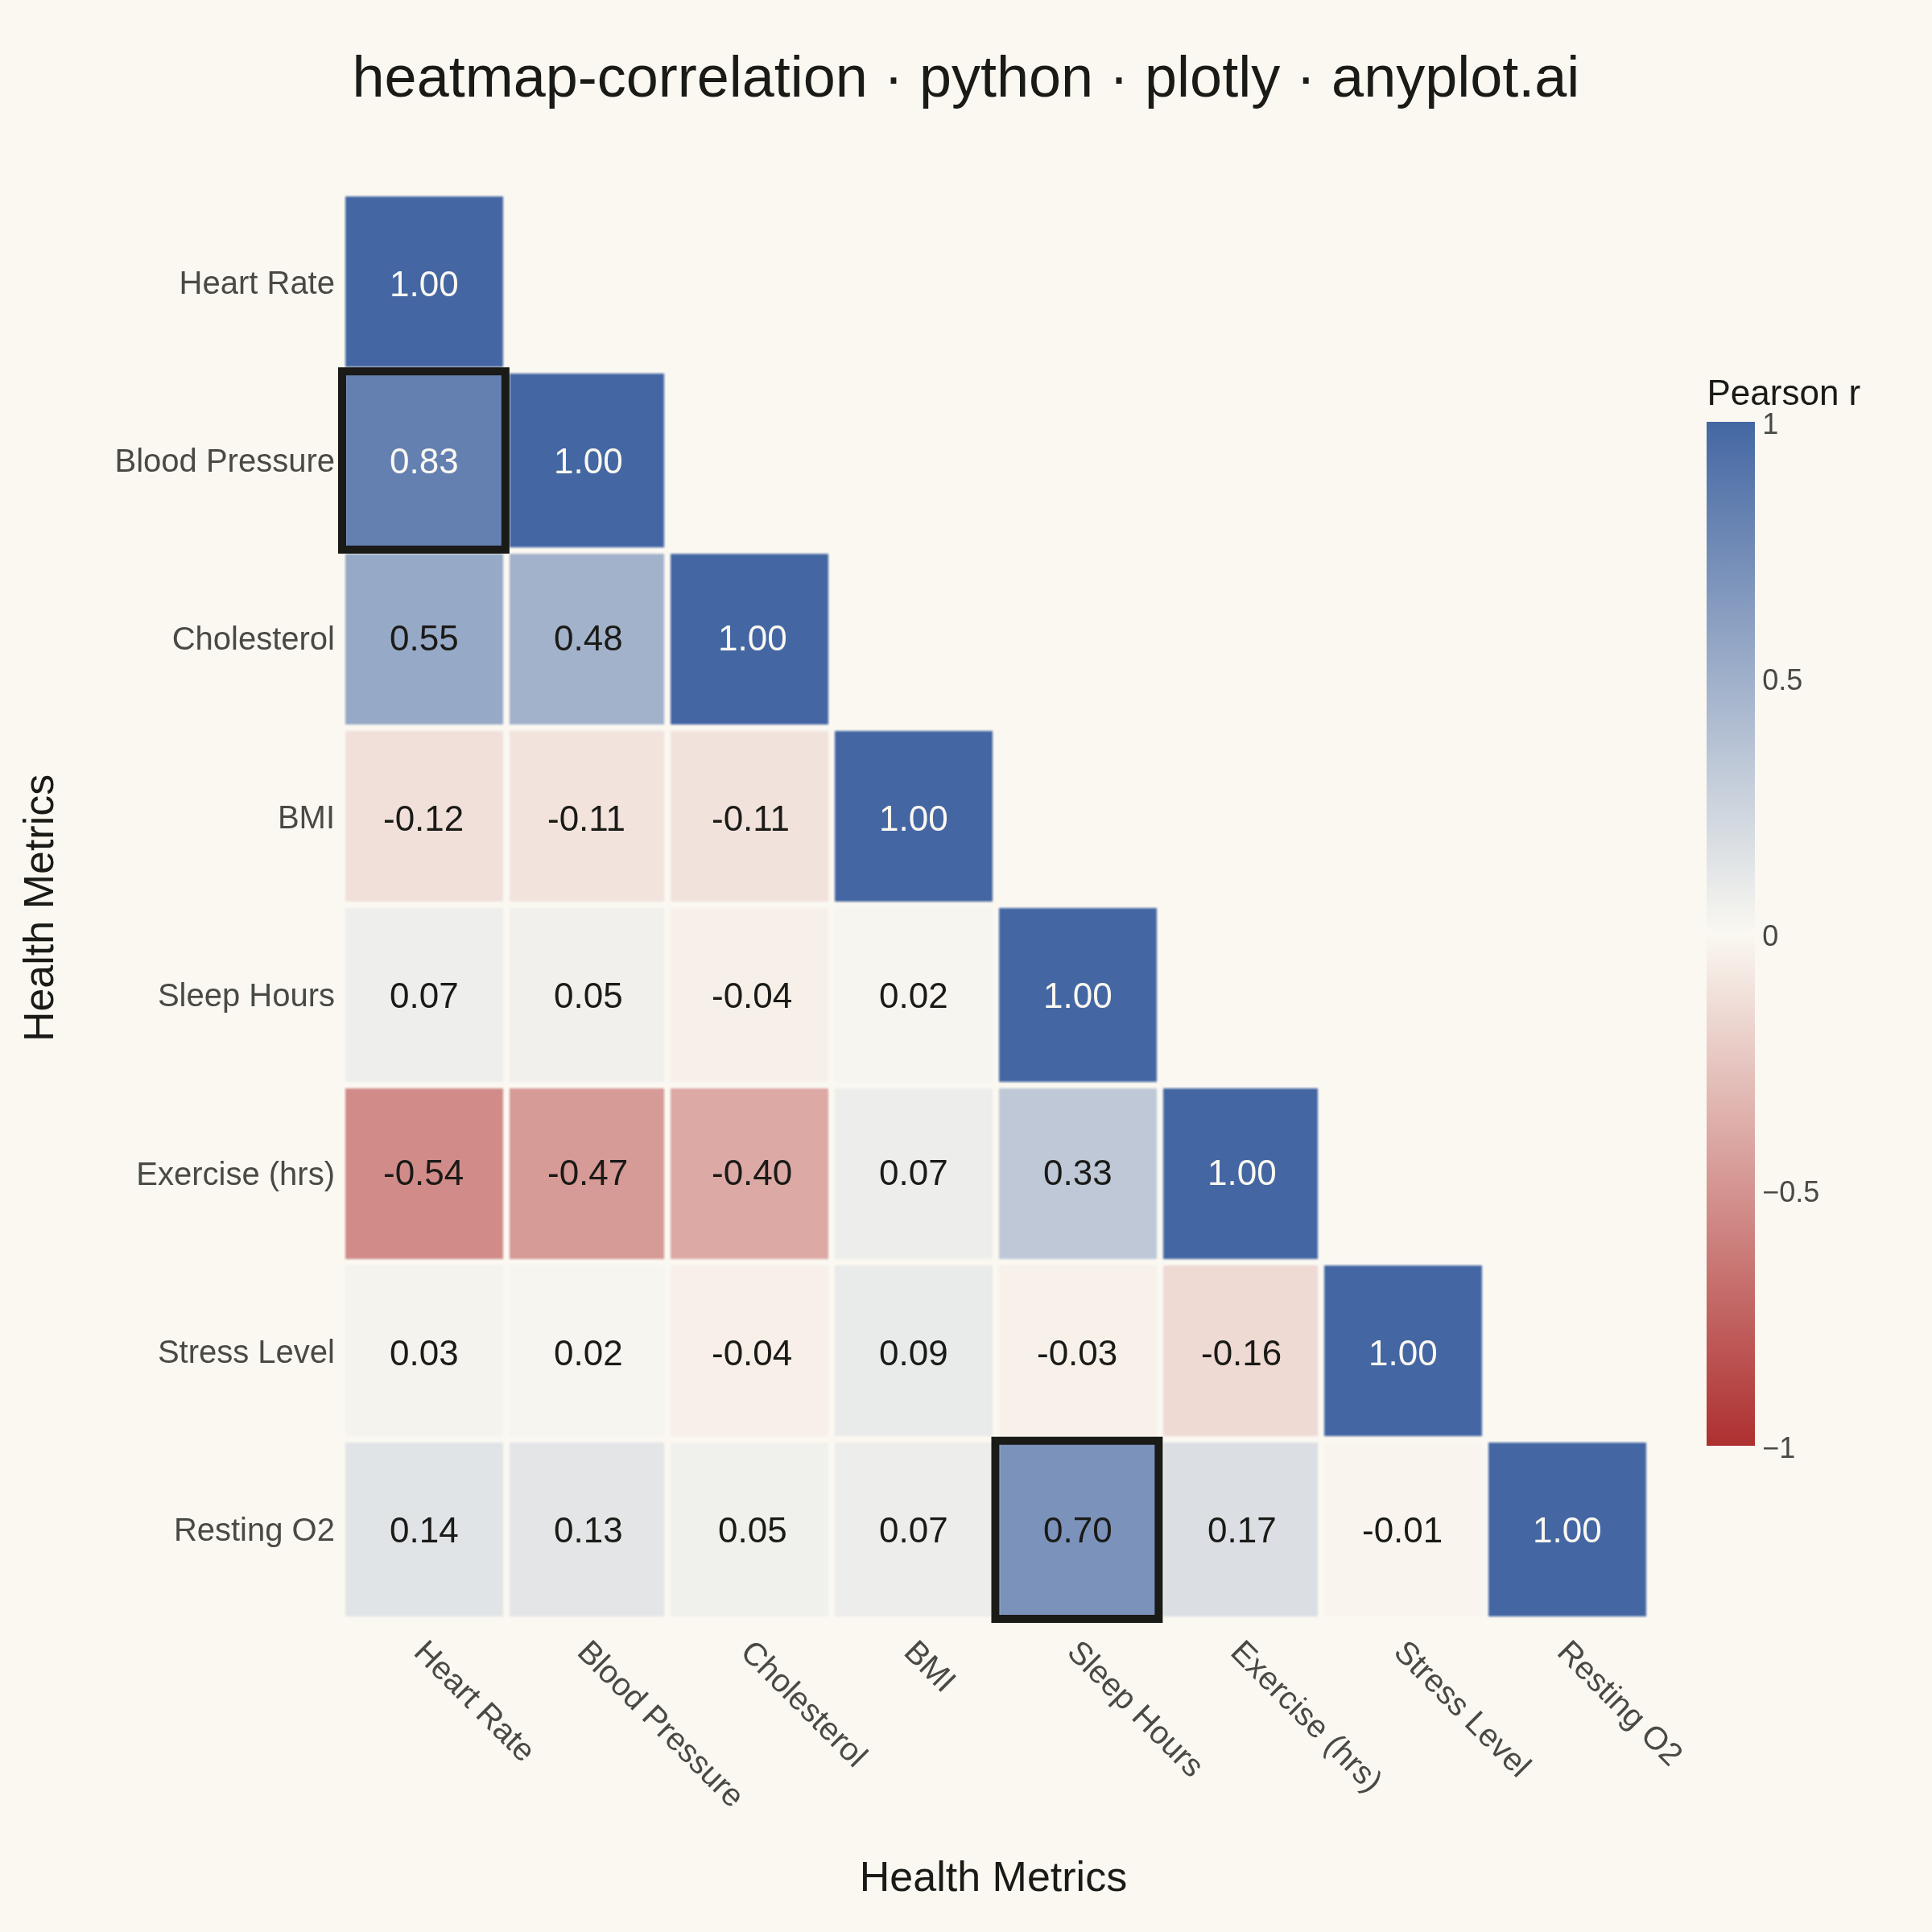
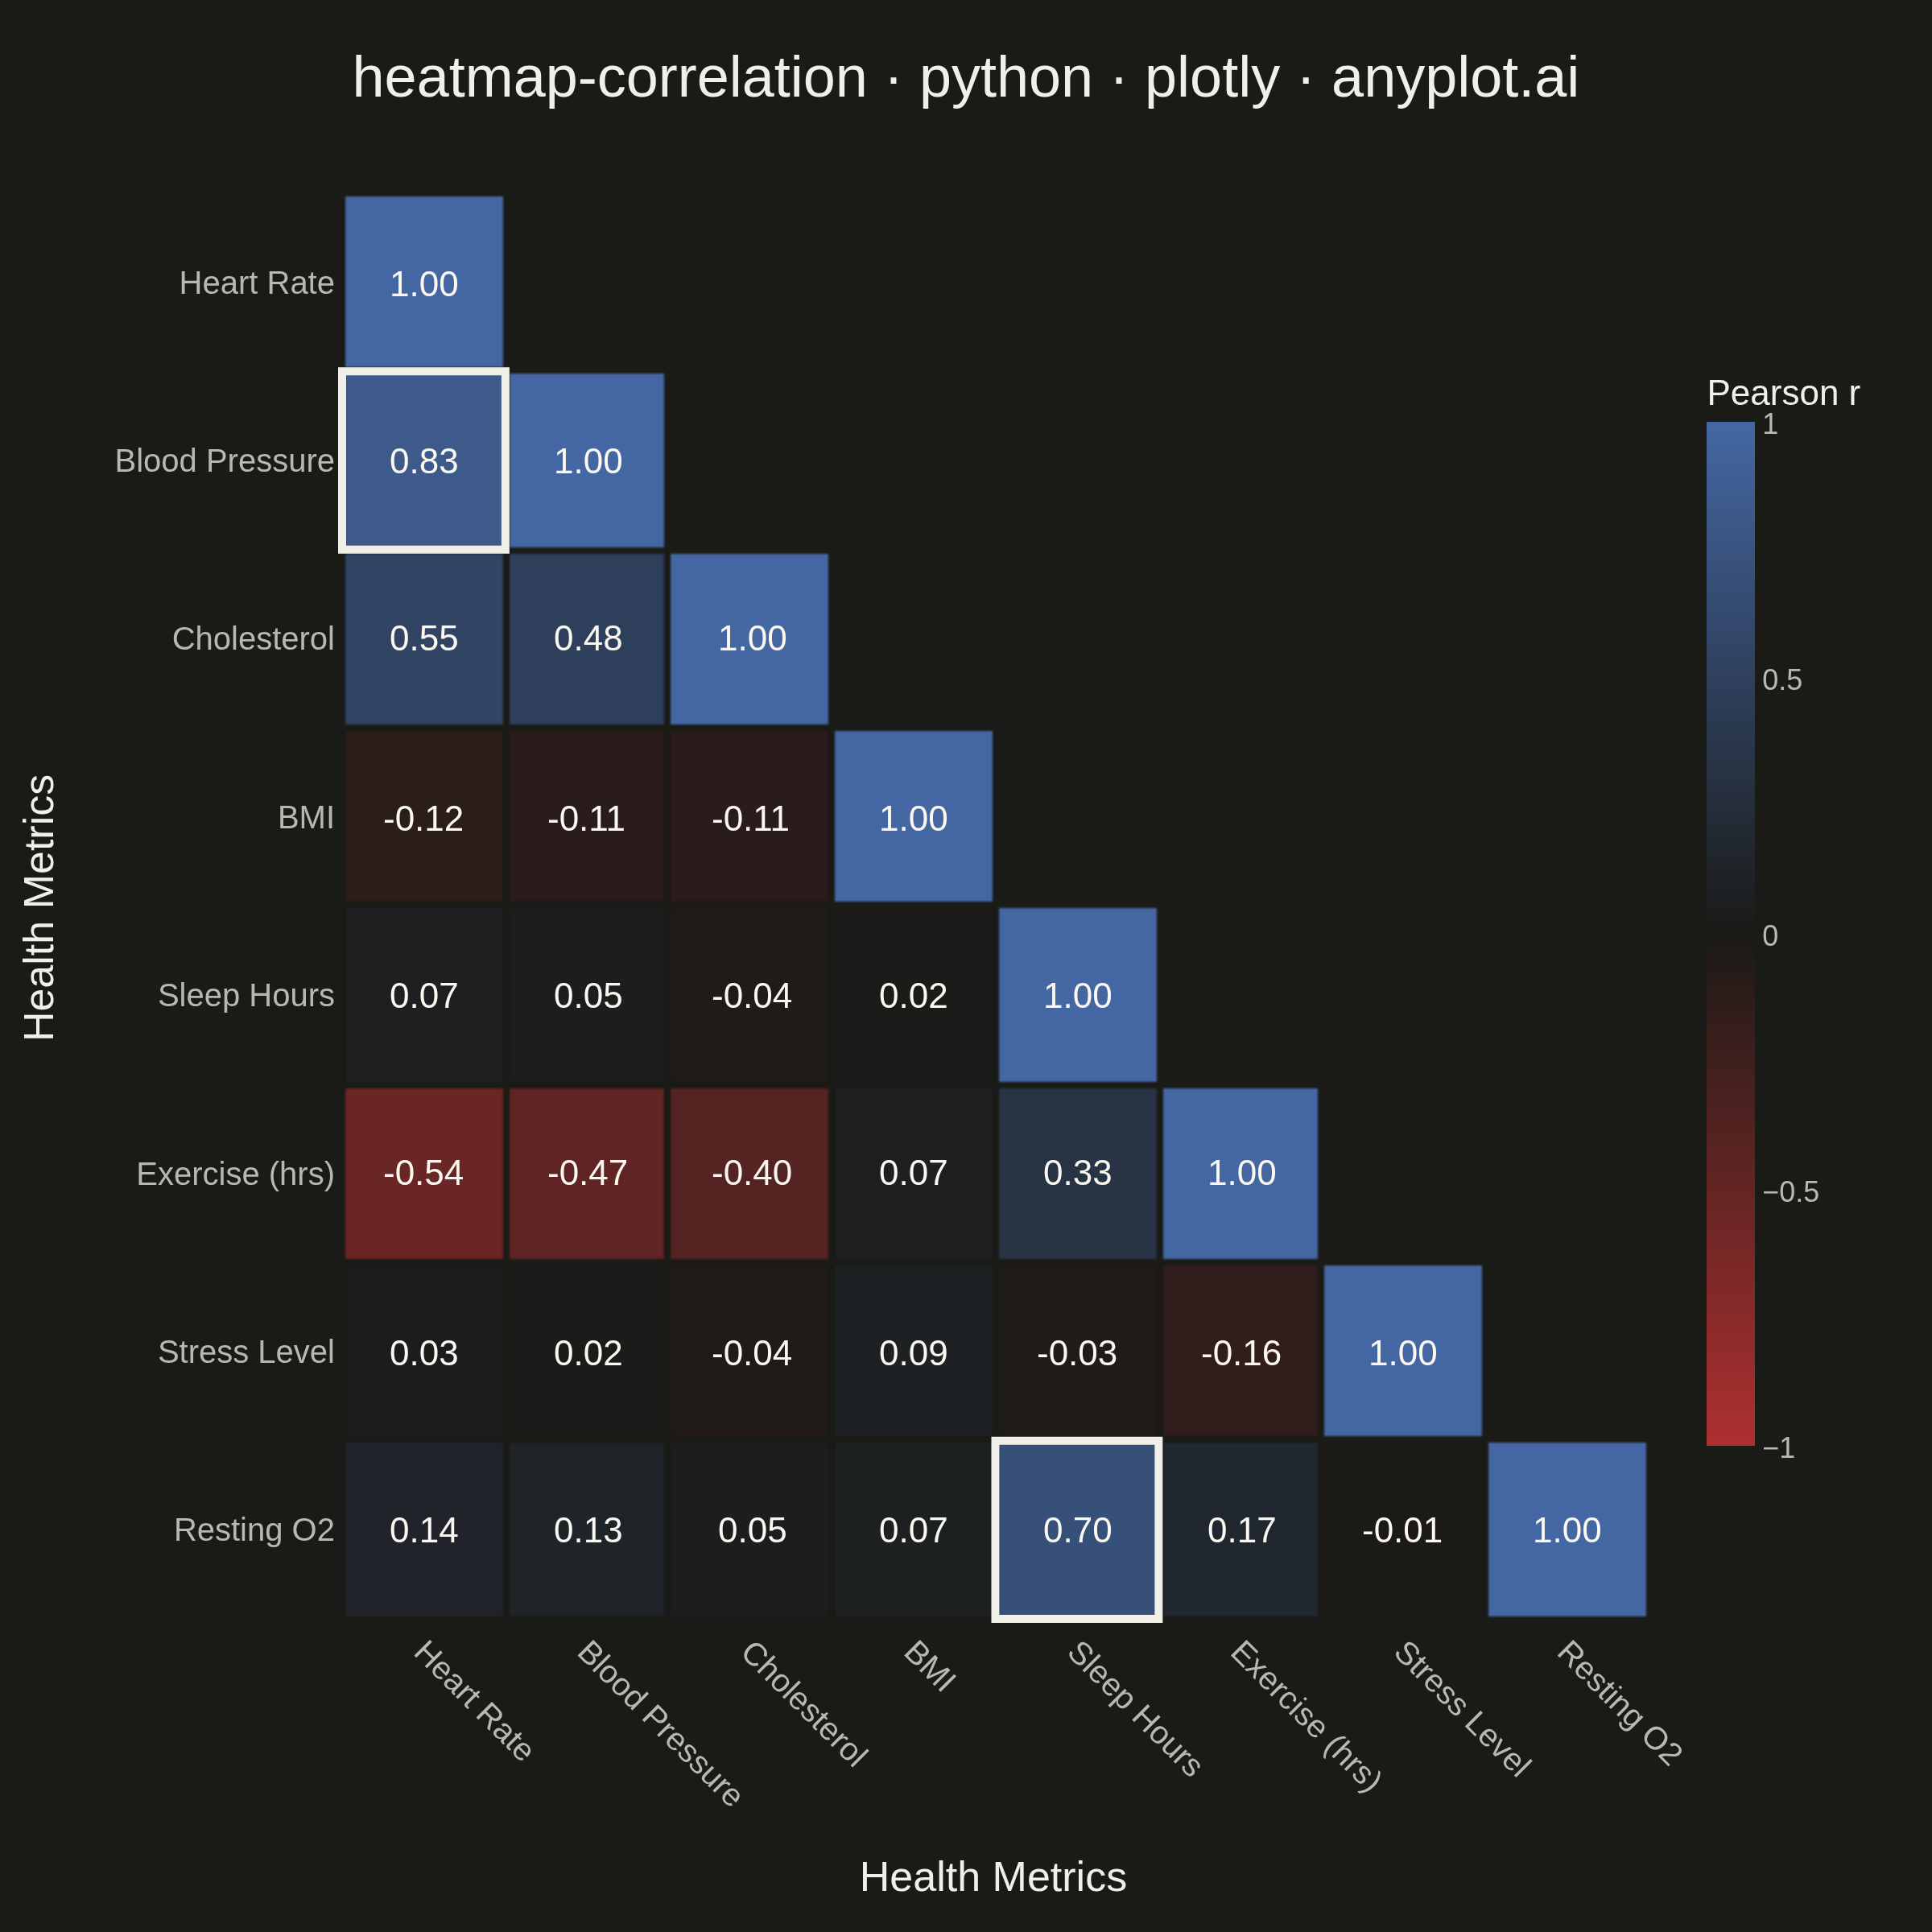
A heatmap specifically designed to display correlation coefficients between variables, using a diverging color scheme centered at zero. The symmetric matrix visualization makes it easy to identify positive correlations, negative correlations, and independent variables at a glance. Essential for exploratory data analysis, feature engineering, and multicollinearity detection in statistical and machine learning workflows.
Preview render from the Plotly implementation.