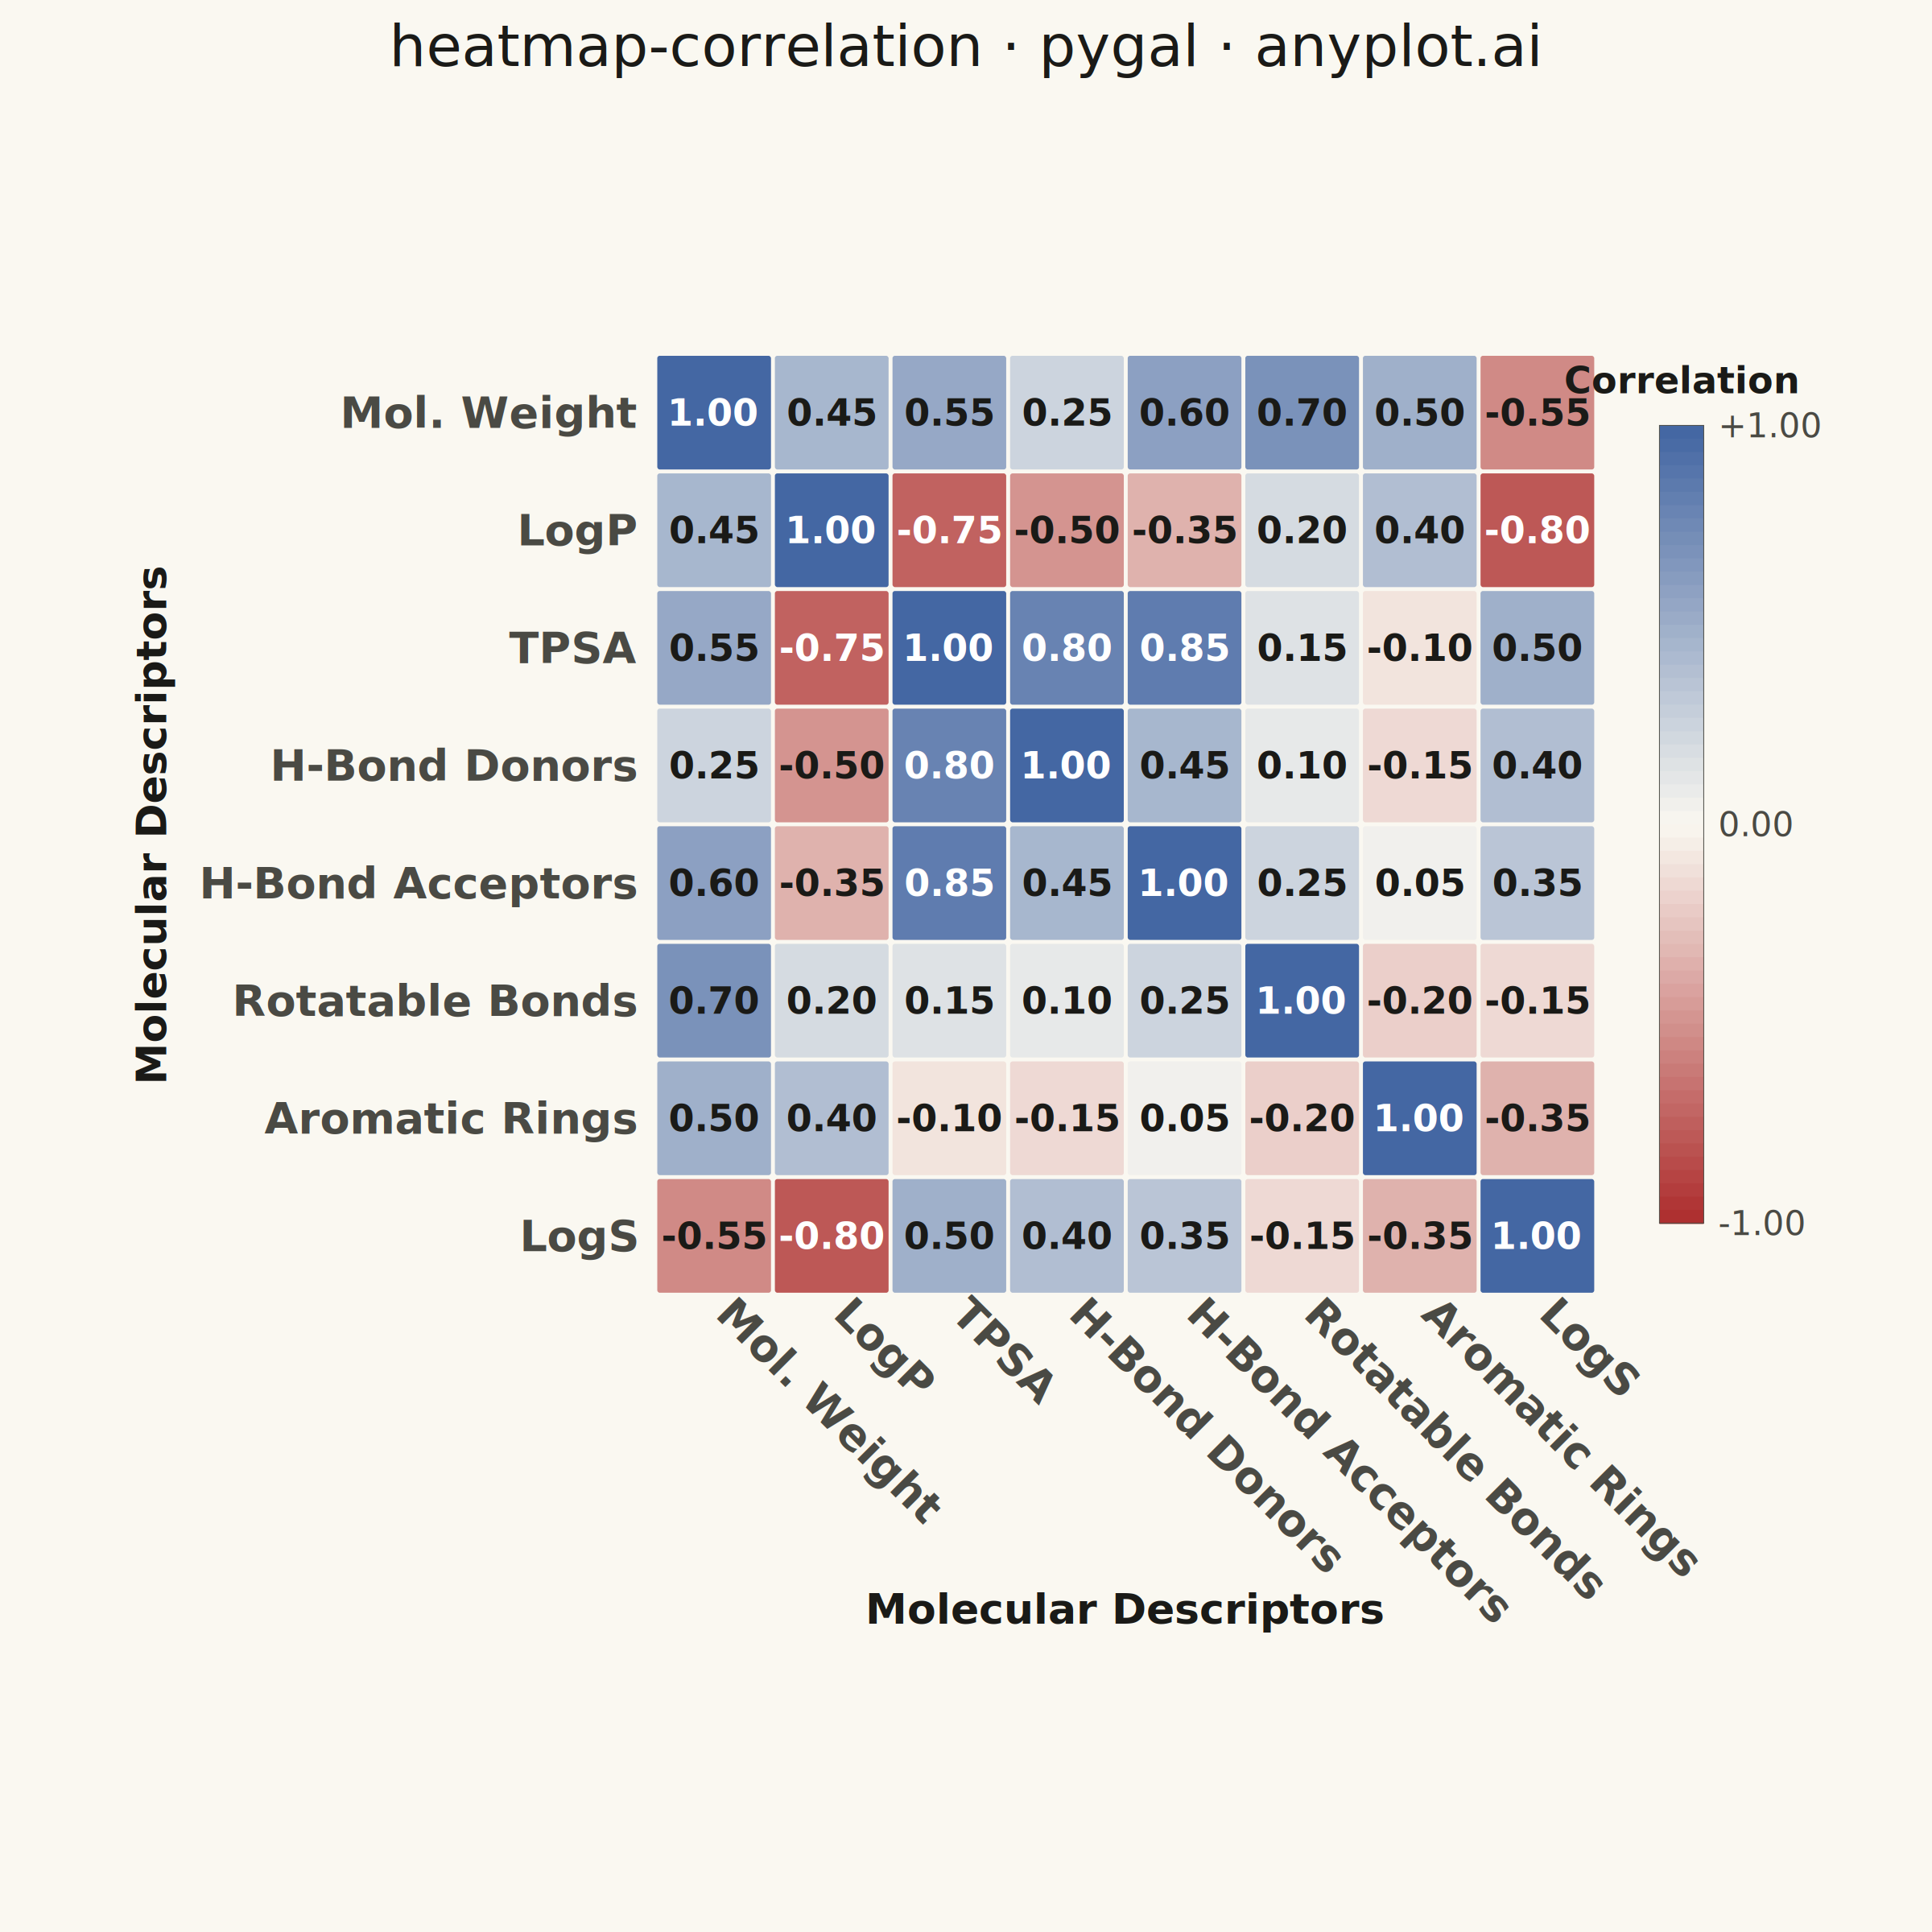
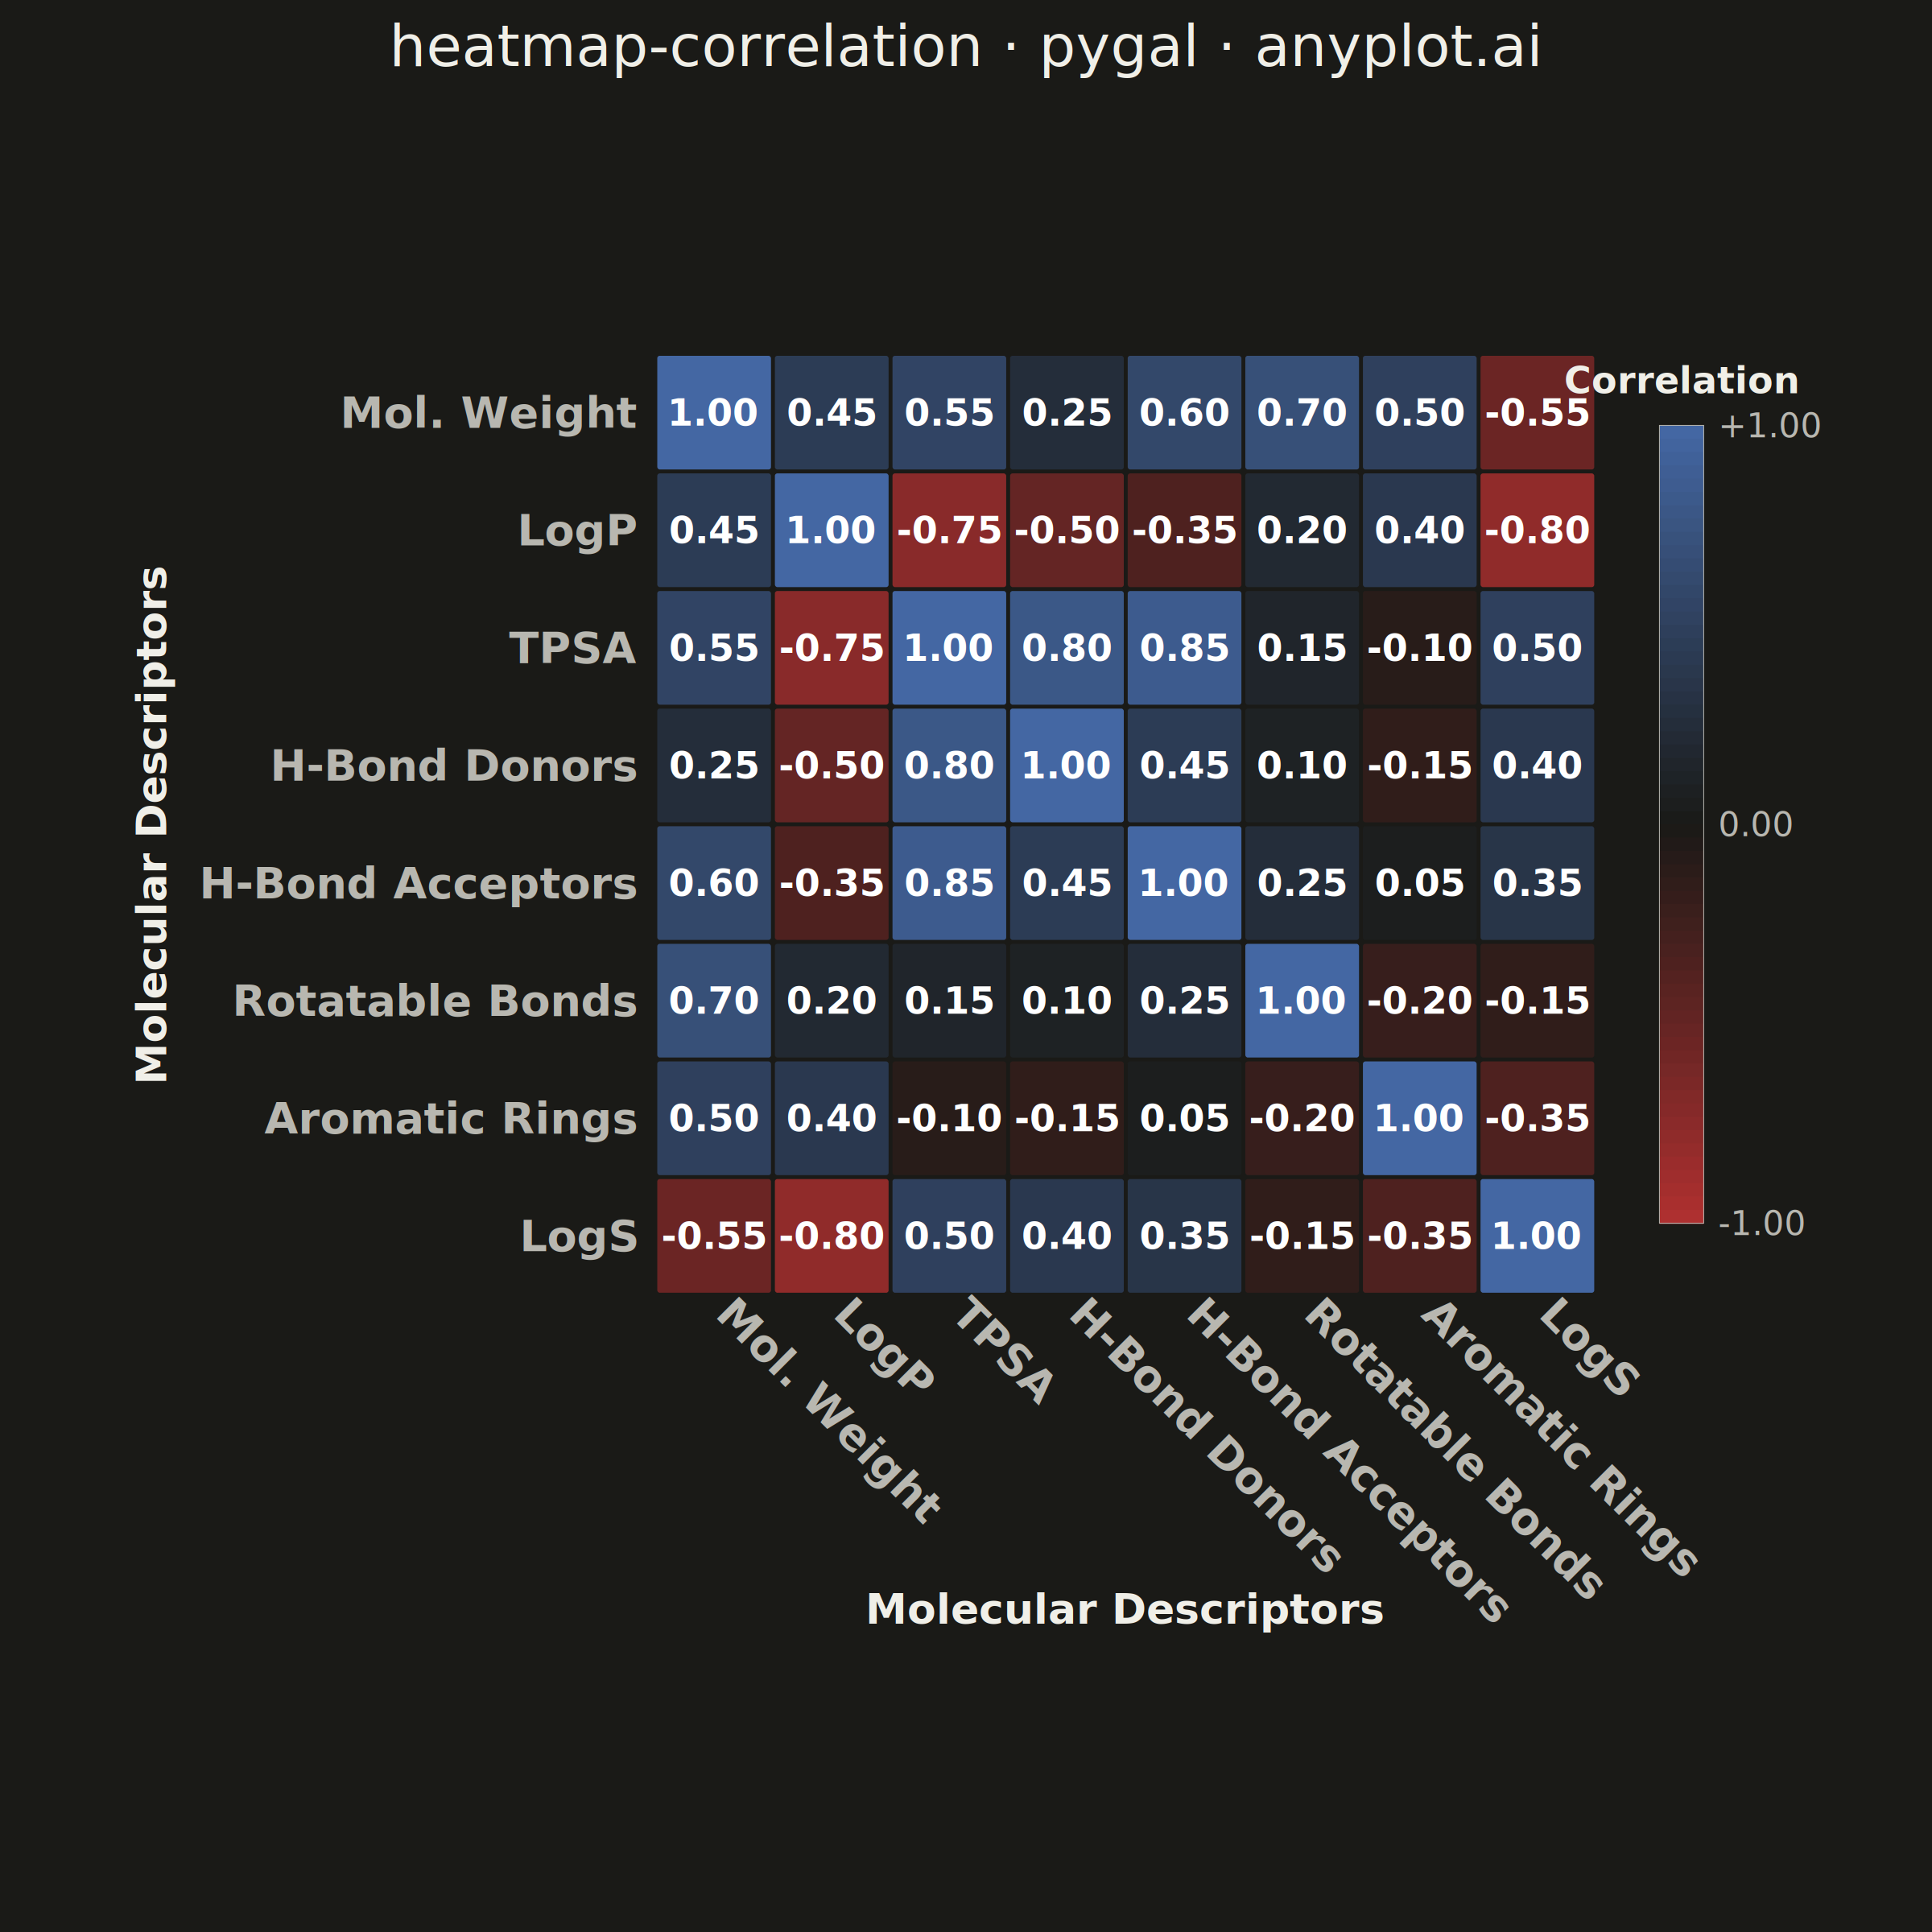
A heatmap specifically designed to display correlation coefficients between variables, using a diverging color scheme centered at zero. The symmetric matrix visualization makes it easy to identify positive correlations, negative correlations, and independent variables at a glance. Essential for exploratory data analysis, feature engineering, and multicollinearity detection in statistical and machine learning workflows.
""" anyplot.ai
heatmap-correlation: Correlation Matrix Heatmap
Library: pygal 3.1.3 | Python 3.13.15
Quality: 87/100 | Updated: 2026-08-18
"""

import os
import sys


# Temporarily remove current directory from path to avoid name collision
_cwd = sys.path[0] if sys.path[0] else "."
if _cwd in sys.path:
    sys.path.remove(_cwd)

from pygal.graph.graph import Graph
from pygal.style import Style


# Restore path
sys.path.insert(0, _cwd)

# Theme tokens
THEME = os.getenv("ANYPLOT_THEME", "light")
PAGE_BG = "#FAF8F1" if THEME == "light" else "#1A1A17"
ELEVATED_BG = "#FFFDF6" if THEME == "light" else "#242420"
INK = "#1A1A17" if THEME == "light" else "#F0EFE8"
INK_SOFT = "#4A4A44" if THEME == "light" else "#B8B7B0"
INK_MUTED = "#6B6A63" if THEME == "light" else "#A8A79F"


class CorrelationHeatmap(Graph):
    """Custom Correlation Matrix Heatmap for pygal - displays correlation coefficients with diverging colors."""

    def __init__(self, *args, **kwargs):
        self.matrix_data = kwargs.pop("matrix_data", [])
        self.labels = kwargs.pop("labels", [])
        self.colormap = kwargs.pop("colormap", [])
        self.show_values = kwargs.pop("show_values", True)
        self.x_axis_title = kwargs.pop("x_axis_title", "")
        self.y_axis_title = kwargs.pop("y_axis_title", "")
        super().__init__(*args, **kwargs)

    def _interpolate_color(self, value):
        """Interpolate color for diverging colormap centered at 0, fixed range -1 to 1."""
        normalized = (value + 1) / 2
        normalized = max(0, min(1, normalized))

        pos = normalized * (len(self.colormap) - 1)
        idx1 = int(pos)
        idx2 = min(idx1 + 1, len(self.colormap) - 1)
        frac = pos - idx1

        c1 = self.colormap[idx1]
        c2 = self.colormap[idx2]

        r1, g1, b1 = int(c1[1:3], 16), int(c1[3:5], 16), int(c1[5:7], 16)
        r2, g2, b2 = int(c2[1:3], 16), int(c2[3:5], 16), int(c2[5:7], 16)

        r = int(r1 + (r2 - r1) * frac)
        g = int(g1 + (g2 - g1) * frac)
        b = int(b1 + (b2 - b1) * frac)

        return f"#{r:02x}{g:02x}{b:02x}"

    def _get_text_color(self, bg_color):
        """Get contrasting text color based on background brightness."""
        r, g, b = int(bg_color[1:3], 16), int(bg_color[3:5], 16), int(bg_color[5:7], 16)
        brightness = (r * 299 + g * 587 + b * 114) / 1000
        return "#FFFFFF" if brightness < 140 else "#1A1A17"

    def _plot(self):
        """Draw the correlation matrix heatmap."""
        if not self.matrix_data:
            return

        n = len(self.matrix_data)

        plot_width = self.view.width
        plot_height = self.view.height

        # Row-label width scales with the longest label so the y-axis title never
        # collides with row text, regardless of how long the variable names are.
        max_row_chars = max((len(label) for label in self.labels), default=0)
        row_label_width = max_row_chars * 54 * 0.56
        y_title_block = 90 if self.y_axis_title else 0

        # Column labels are rotated 45deg, so their vertical drop below the grid
        # scales with label length too — reserve room before the x-axis title.
        max_col_chars = max((len(label) for label in self.labels), default=0)
        col_label_drop = max_col_chars * 54 * 0.56 * 0.7071
        x_title_block = 90 if self.x_axis_title else 0

        label_margin_left = row_label_width + y_title_block + 60
        label_margin_bottom = 25 + col_label_drop + x_title_block + 40
        label_margin_top = 20
        label_margin_right = 320

        available_width = plot_width - label_margin_left - label_margin_right
        available_height = plot_height - label_margin_bottom - label_margin_top

        cell_size = min(available_width, available_height) / n * 0.95
        gap = cell_size * 0.02

        grid_size = n * (cell_size + gap) - gap

        left_edge = self.view.x(0)
        x_offset = left_edge + label_margin_left + (available_width - grid_size) / 2
        y_offset = self.view.y(n) + label_margin_top + (available_height - grid_size) / 2

        plot_node = self.nodes["plot"]
        heatmap_group = self.svg.node(plot_node, class_="correlation-heatmap")

        if self.y_axis_title:
            y_title_size = 52
            y_title_x = left_edge + y_title_block / 2
            y_title_y = y_offset + grid_size / 2
            text_node = self.svg.node(heatmap_group, "text", x=y_title_x, y=y_title_y)
            text_node.set("text-anchor", "middle")
            text_node.set("fill", INK)
            text_node.set("style", f"font-size:{y_title_size}px;font-weight:bold;font-family:sans-serif")
            text_node.set("transform", f"rotate(-90, {y_title_x}, {y_title_y})")
            text_node.text = self.y_axis_title

        row_font_size = min(54, int(cell_size * 0.55))
        for i, label in enumerate(self.labels):
            y = y_offset + i * (cell_size + gap) + cell_size / 2
            text_node = self.svg.node(heatmap_group, "text", x=x_offset - 25, y=y + row_font_size * 0.35)
            text_node.set("text-anchor", "end")
            text_node.set("fill", INK_SOFT)
            text_node.set("style", f"font-size:{row_font_size}px;font-weight:600;font-family:sans-serif")
            text_node.text = label

        col_font_size = min(54, int(cell_size * 0.55))
        col_label_y = y_offset + n * (cell_size + gap) + 25
        for j, label in enumerate(self.labels):
            x = x_offset + j * (cell_size + gap) + cell_size / 2
            text_node = self.svg.node(heatmap_group, "text", x=x, y=col_label_y)
            text_node.set("text-anchor", "start")
            text_node.set("fill", INK_SOFT)
            text_node.set("style", f"font-size:{col_font_size}px;font-weight:600;font-family:sans-serif")
            text_node.set("transform", f"rotate(45, {x}, {col_label_y})")
            text_node.text = label

        if self.x_axis_title:
            x_title_size = 52
            x_title_x = x_offset + grid_size / 2
            x_title_y = col_label_y + col_label_drop + 40
            text_node = self.svg.node(heatmap_group, "text", x=x_title_x, y=x_title_y)
            text_node.set("text-anchor", "middle")
            text_node.set("fill", INK)
            text_node.set("style", f"font-size:{x_title_size}px;font-weight:bold;font-family:sans-serif")
            text_node.text = self.x_axis_title

        value_font_size = min(46, int(cell_size * 0.38))
        for i in range(n):
            for j in range(n):
                value = self.matrix_data[i][j]
                color = self._interpolate_color(value)
                text_color = self._get_text_color(color)

                x = x_offset + j * (cell_size + gap)
                y = y_offset + i * (cell_size + gap)

                rect = self.svg.node(heatmap_group, "rect", x=x, y=y, width=cell_size, height=cell_size, rx=4, ry=4)
                rect.set("fill", color)
                rect.set("stroke", PAGE_BG)
                rect.set("stroke-width", "2")

                if self.show_values:
                    text_x = x + cell_size / 2
                    text_y = y + cell_size / 2 + value_font_size * 0.35

                    text_node = self.svg.node(heatmap_group, "text", x=text_x, y=text_y)
                    text_node.set("text-anchor", "middle")
                    text_node.set("fill", text_color)
                    text_node.set("style", f"font-size:{value_font_size}px;font-weight:bold;font-family:sans-serif")
                    text_node.text = f"{value:.2f}"

        colorbar_width = 55
        colorbar_height = grid_size * 0.85
        colorbar_x = x_offset + grid_size + 80
        colorbar_y = y_offset + (grid_size - colorbar_height) / 2

        n_segments = 60
        segment_height = colorbar_height / n_segments
        for seg_i in range(n_segments):
            seg_value = 1 - (2 * seg_i / (n_segments - 1))
            seg_color = self._interpolate_color(seg_value)
            seg_y = colorbar_y + seg_i * segment_height

            self.svg.node(
                heatmap_group,
                "rect",
                x=colorbar_x,
                y=seg_y,
                width=colorbar_width,
                height=segment_height + 1,
                fill=seg_color,
            )

        self.svg.node(
            heatmap_group,
            "rect",
            x=colorbar_x,
            y=colorbar_y,
            width=colorbar_width,
            height=colorbar_height,
            fill="none",
            stroke=INK_SOFT,
        )

        cb_label_size = 42
        text_node = self.svg.node(
            heatmap_group, "text", x=colorbar_x + colorbar_width + 18, y=colorbar_y + cb_label_size * 0.35
        )
        text_node.set("fill", INK_SOFT)
        text_node.set("style", f"font-size:{cb_label_size}px;font-family:sans-serif")
        text_node.text = "+1.00"

        mid_y = colorbar_y + colorbar_height / 2
        text_node = self.svg.node(
            heatmap_group, "text", x=colorbar_x + colorbar_width + 18, y=mid_y + cb_label_size * 0.35
        )
        text_node.set("fill", INK_SOFT)
        text_node.set("style", f"font-size:{cb_label_size}px;font-family:sans-serif")
        text_node.text = " 0.00"

        text_node = self.svg.node(
            heatmap_group,
            "text",
            x=colorbar_x + colorbar_width + 18,
            y=colorbar_y + colorbar_height + cb_label_size * 0.35,
        )
        text_node.set("fill", INK_SOFT)
        text_node.set("style", f"font-size:{cb_label_size}px;font-family:sans-serif")
        text_node.text = "-1.00"

        cb_title_size = 46
        cb_title_x = colorbar_x + colorbar_width / 2
        cb_title_y = colorbar_y - 40
        text_node = self.svg.node(heatmap_group, "text", x=cb_title_x, y=cb_title_y)
        text_node.set("text-anchor", "middle")
        text_node.set("fill", INK)
        text_node.set("style", f"font-size:{cb_title_size}px;font-weight:bold;font-family:sans-serif")
        text_node.text = "Correlation"

    def _compute(self):
        """Compute the box for rendering."""
        n = len(self.matrix_data) if self.matrix_data else 1
        self._box.xmin = 0
        self._box.xmax = n
        self._box.ymin = 0
        self._box.ymax = n


# Data: Correlation matrix for molecular descriptors (cheminformatics QSAR feature set)
variables = [
    "Mol. Weight",
    "LogP",
    "TPSA",
    "H-Bond Donors",
    "H-Bond Acceptors",
    "Rotatable Bonds",
    "Aromatic Rings",
    "LogS",
]
n = len(variables)

matrix_data = [
    [1.00, 0.45, 0.55, 0.25, 0.60, 0.70, 0.50, -0.55],
    [0.45, 1.00, -0.75, -0.50, -0.35, 0.20, 0.40, -0.80],
    [0.55, -0.75, 1.00, 0.80, 0.85, 0.15, -0.10, 0.50],
    [0.25, -0.50, 0.80, 1.00, 0.45, 0.10, -0.15, 0.40],
    [0.60, -0.35, 0.85, 0.45, 1.00, 0.25, 0.05, 0.35],
    [0.70, 0.20, 0.15, 0.10, 0.25, 1.00, -0.20, -0.15],
    [0.50, 0.40, -0.10, -0.15, 0.05, -0.20, 1.00, -0.35],
    [-0.55, -0.80, 0.50, 0.40, 0.35, -0.15, -0.35, 1.00],
]

# Custom style with theme-adaptive colors
custom_style = Style(
    background=PAGE_BG,
    plot_background=PAGE_BG,
    foreground=INK,
    foreground_strong=INK,
    foreground_subtle=INK_MUTED,
    colors=("#009E73",),
    title_font_size=72,
    legend_font_size=48,
    label_font_size=50,
    value_font_size=44,
    font_family="sans-serif",
)


def _lerp_hex(c0, c1, t):
    """Linearly interpolate between two hex colors."""
    r0, g0, b0 = (int(c0[i : i + 2], 16) for i in (1, 3, 5))
    r1, g1, b1 = (int(c1[i : i + 2], 16) for i in (1, 3, 5))
    r, g, b = (int(round(a + (b - a) * t)) for a, b in ((r0, r1), (g0, g1), (b0, b1)))
    return f"#{r:02x}{g:02x}{b:02x}"


# Diverging Imprint colormap: matte-red (negative) -> theme-adaptive midpoint (zero) -> blue (positive)
_half_stops = 16
diverging_colormap = [_lerp_hex("#AE3030", PAGE_BG, i / _half_stops) for i in range(_half_stops)] + [
    _lerp_hex(PAGE_BG, "#4467A3", i / _half_stops) for i in range(_half_stops + 1)
]

# Create correlation heatmap
chart = CorrelationHeatmap(
    width=2400,
    height=2400,
    style=custom_style,
    title="heatmap-correlation · pygal · anyplot.ai",
    matrix_data=matrix_data,
    labels=variables,
    colormap=diverging_colormap,
    show_values=True,
    show_legend=False,
    margin=120,
    margin_top=60,
    margin_bottom=100,
    show_x_labels=False,
    show_y_labels=False,
    x_axis_title="Molecular Descriptors",
    y_axis_title="Molecular Descriptors",
)

chart.add("", [0])

# Save outputs with theme-suffixed filenames
chart.render_to_file(f"plot-{THEME}.svg")
chart.render_to_png(f"plot-{THEME}.png")

# Save HTML for interactivity
html_content = f"""<!DOCTYPE html>
<html>
<head>
    <meta charset="utf-8">
    <title>heatmap-correlation - pygal</title>
    <style>
        body {{ margin: 0; display: flex; justify-content: center; align-items: center; min-height: 100vh; background: {PAGE_BG}; }}
        .chart {{ max-width: 100%; height: auto; }}
    </style>
</head>
<body>
    <figure class="chart">
        {chart.render(is_unicode=True)}
    </figure>
</body>
</html>
"""

with open(f"plot-{THEME}.html", "w", encoding="utf-8") as f:
    f.write(html_content)
Runnable source as JSON, for any HTTP client: https://api.anyplot.ai/specs/heatmap-correlation/pygal/code. Any spec id and library id listed in llms-full.txt fit the same URL shape; every URL below is complete and callable.
{
  "spec_id": "heatmap-correlation",
  "language": "python",
  "library": "pygal",
  "page": "https://anyplot.ai/heatmap-correlation/python/pygal",
  "hub": "https://anyplot.ai/heatmap-correlation",
  "code_json": "https://api.anyplot.ai/specs/heatmap-correlation/pygal/code",
  "spec_json": "https://api.anyplot.ai/specs/heatmap-correlation",
  "render_light_png": "https://storage.googleapis.com/anyplot-images/plots/heatmap-correlation/python/pygal/plot-light.png",
  "render_dark_png": "https://storage.googleapis.com/anyplot-images/plots/heatmap-correlation/python/pygal/plot-dark.png",
  "interactive_light_html": "https://storage.googleapis.com/anyplot-images/plots/heatmap-correlation/python/pygal/plot-light.html",
  "interactive_dark_html": "https://storage.googleapis.com/anyplot-images/plots/heatmap-correlation/python/pygal/plot-dark.html",
  "quality_score": 87.0,
  "license": "MIT",
  "guide": "https://anyplot.ai/llms.txt"
}
Part of Correlation Matrix Heatmap on anyplot.ai.