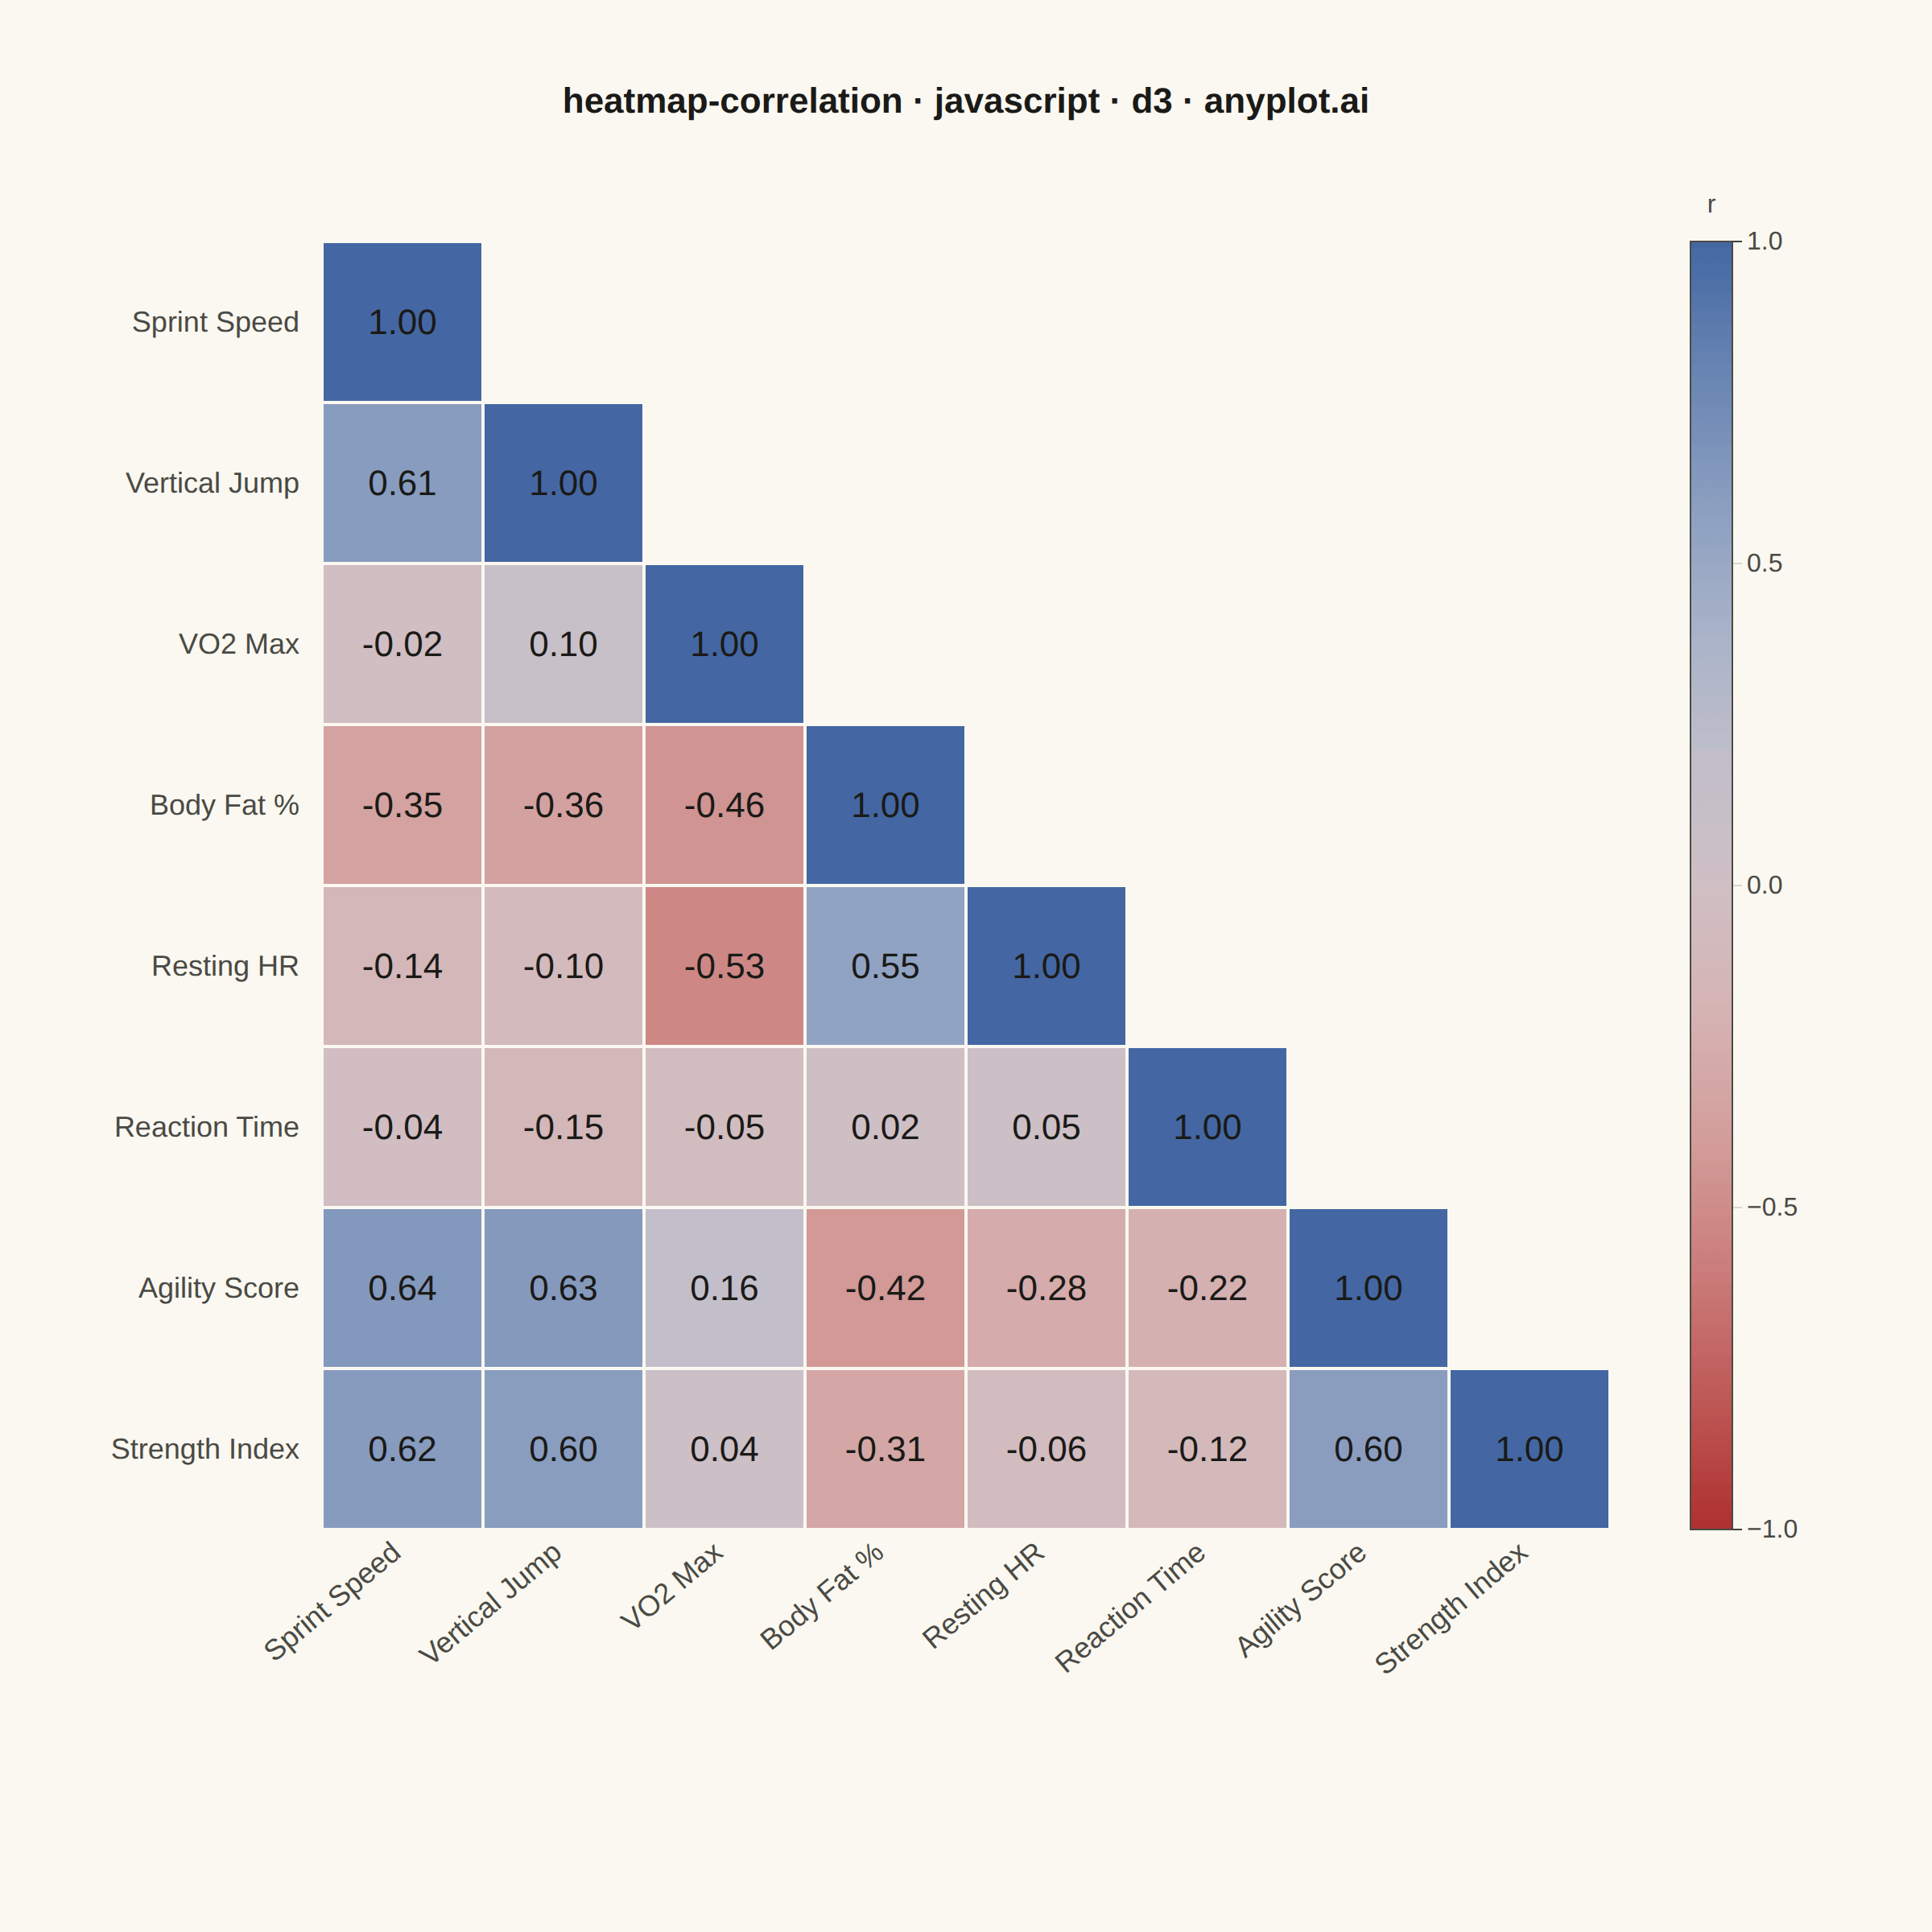
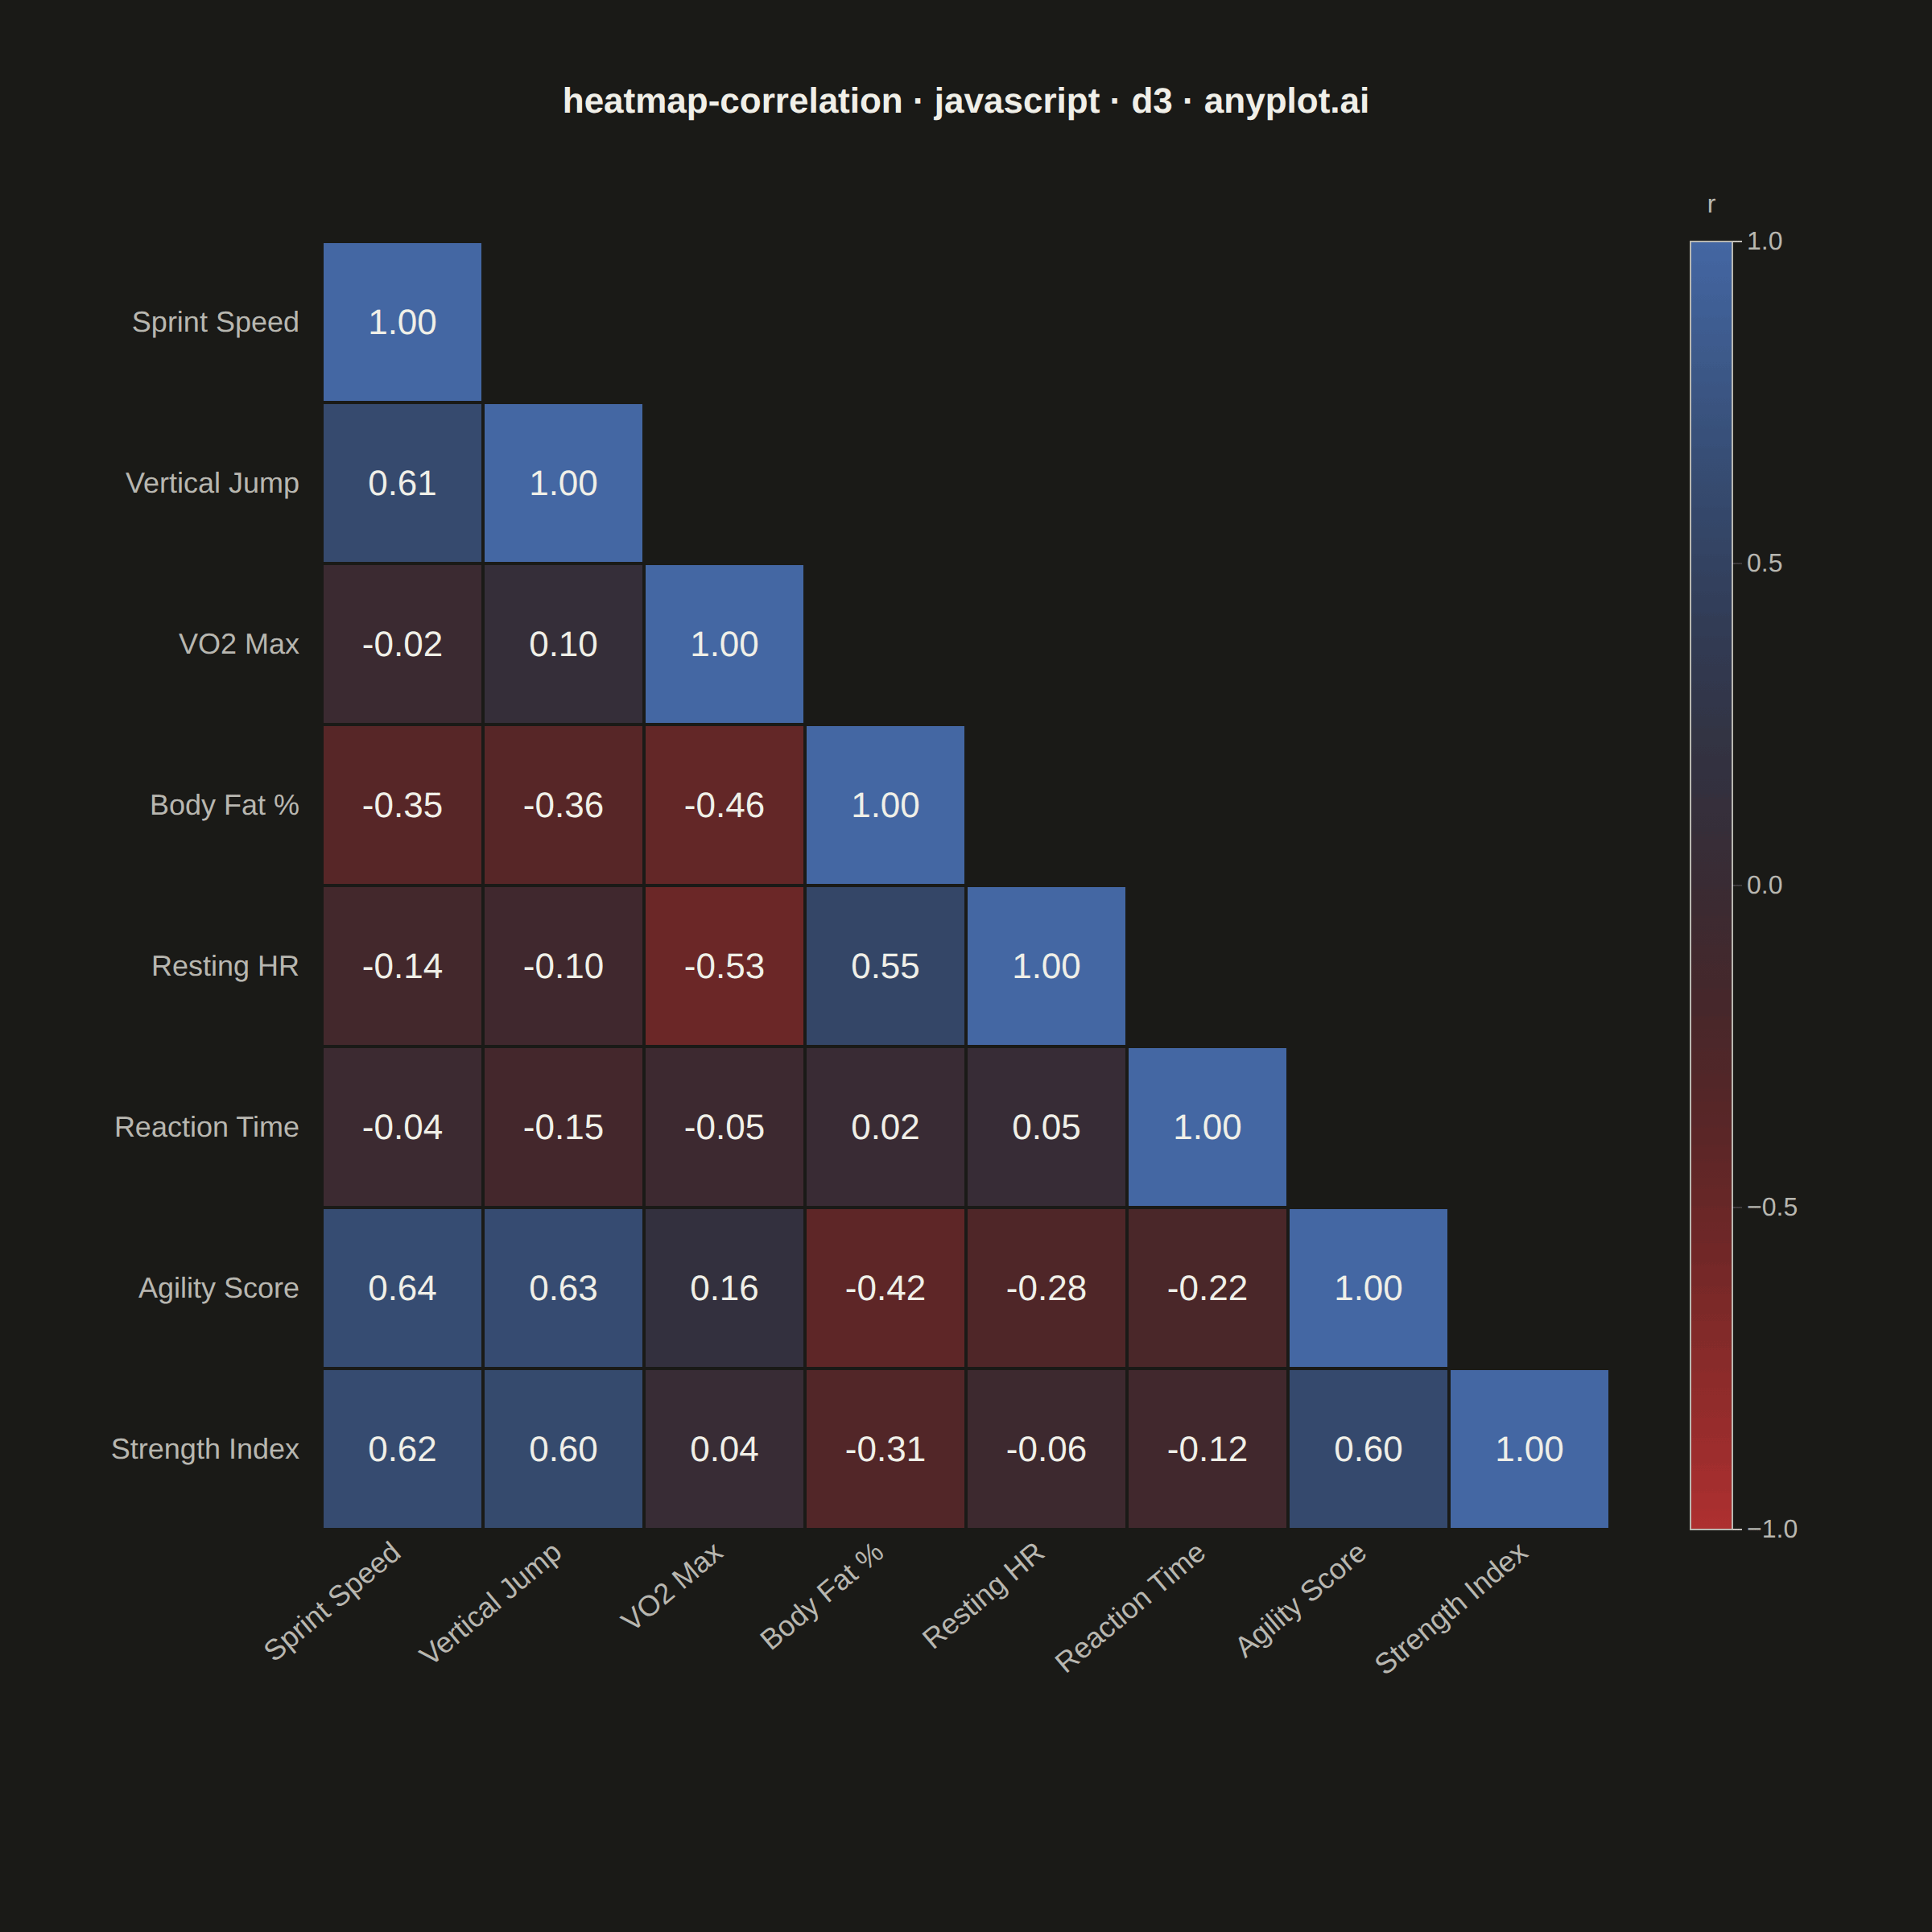
The same plot in 14 other libraries — JavaScript: Chart.js, Apache ECharts, Highcharts, MUI X Charts; Python: Altair, Bokeh, lets-plot, Matplotlib, Plotly, plotnine, Pygal, Seaborn; R: ggplot2; Julia: Makie.jl. Compare all 15 side by side: Correlation Matrix Heatmap in Python, R, Julia and JavaScript.
A heatmap specifically designed to display correlation coefficients between variables, using a diverging color scheme centered at zero. The symmetric matrix visualization makes it easy to identify positive correlations, negative correlations, and independent variables at a glance. Essential for exploratory data analysis, feature engineering, and multicollinearity detection in statistical and machine learning workflows.
// anyplot.ai
// heatmap-correlation: Correlation Matrix Heatmap
// Library: d3 7.9.0 | JavaScript 22.23.2
// Quality: 93/100 | Created: 2026-08-18
//# anyplot-orientation: square

const t = window.ANYPLOT_TOKENS;
const { width, height } = window.ANYPLOT_SIZE;

// --- Data: synthetic athletic-performance testing battery -------------------
// A deterministic LCG stands in for a seeded RNG (the browser has none).
const lcg = (seed) => {
  let state = seed >>> 0;
  return () => {
    state = (Math.imul(state, 1664525) + 1013904223) >>> 0;
    return state / 4294967296;
  };
};
const rand = lcg(42);
const randNormal = () => {
  const u1 = Math.max(rand(), 1e-9);
  const u2 = rand();
  return Math.sqrt(-2 * Math.log(u1)) * Math.cos(2 * Math.PI * u2);
};

const labels = [
  "Sprint Speed", "Vertical Jump", "VO2 Max", "Body Fat %",
  "Resting HR", "Reaction Time", "Agility Score", "Strength Index",
];

// Two latent factors (explosive power, aerobic fitness) drive realistic
// cross-correlations between the eight test metrics, plus per-metric noise.
const athletes = 200;
const series = labels.map(() => []);
for (let i = 0; i < athletes; i += 1) {
  const power = randNormal();
  const fitness = randNormal();
  series[0].push(0.7 * power + 0.5 * randNormal()); // Sprint Speed
  series[1].push(0.65 * power + 0.55 * randNormal()); // Vertical Jump
  series[2].push(0.7 * fitness + 0.5 * randNormal()); // VO2 Max
  series[3].push(-0.5 * fitness - 0.3 * power + 0.55 * randNormal()); // Body Fat %
  series[4].push(-0.6 * fitness + 0.55 * randNormal()); // Resting HR
  series[5].push(-0.2 * power + 0.9 * randNormal()); // Reaction Time
  series[6].push(0.6 * power + 0.2 * fitness + 0.5 * randNormal()); // Agility Score
  series[7].push(0.55 * power + 0.55 * randNormal()); // Strength Index
}

const mean = (a) => a.reduce((s, v) => s + v, 0) / a.length;
const pearson = (a, b) => {
  const ma = mean(a);
  const mb = mean(b);
  let num = 0;
  let da = 0;
  let db = 0;
  for (let i = 0; i < a.length; i += 1) {
    num += (a[i] - ma) * (b[i] - mb);
    da += (a[i] - ma) ** 2;
    db += (b[i] - mb) ** 2;
  }
  return num / Math.sqrt(da * db);
};

const n = labels.length;
const corr = series.map((a) => series.map((b) => pearson(a, b)));

// --- Layout -------------------------------------------------------------
const margin = { top: 150, right: 200, bottom: 250, left: 200 };
const side = Math.min(width - margin.left - margin.right, height - margin.top - margin.bottom);
const cell = side / n;

const svg = d3.select("#container").append("svg").attr("width", width).attr("height", height);

// --- Color scale: Imprint diverging, fixed -1..1 domain per spec -----------
const colorScale = d3.scaleSequential(d3.interpolateRgbBasis(t.div)).domain([-1, 1]);
const relLuminance = (hex) => {
  const c = hex.replace("#", "");
  const r = parseInt(c.slice(0, 2), 16) / 255;
  const g = parseInt(c.slice(2, 4), 16) / 255;
  const b = parseInt(c.slice(4, 6), 16) / 255;
  return 0.2126 * r + 0.7152 * g + 0.0722 * b;
};
const lightText = t.pageBg;
const textColorFor = (value) => (relLuminance(colorScale(value)) < 0.5 ? lightText : t.ink);

// --- Matrix (lower triangle only — upper half is redundant) ----------------
const g = svg.append("g").attr("transform", `translate(${margin.left},${margin.top})`);
const cells = [];
for (let row = 0; row < n; row += 1) {
  for (let col = 0; col <= row; col += 1) {
    cells.push({ row, col, value: corr[row][col] });
  }
}

g.selectAll("rect").data(cells).join("rect")
  .attr("x", (d) => d.col * cell)
  .attr("y", (d) => d.row * cell)
  .attr("width", cell)
  .attr("height", cell)
  .attr("fill", (d) => colorScale(d.value))
  .attr("stroke", t.pageBg)
  .attr("stroke-width", 2);

g.selectAll("text.cell-label").data(cells).join("text")
  .attr("class", "cell-label")
  .attr("x", (d) => d.col * cell + cell / 2)
  .attr("y", (d) => d.row * cell + cell / 2)
  .attr("text-anchor", "middle")
  .attr("dominant-baseline", "central")
  .style("font-size", "22px")
  .style("font-weight", 500)
  .attr("fill", (d) => textColorFor(d.value))
  .text((d) => d.value.toFixed(2));

// --- Row labels (left) -------------------------------------------------
g.selectAll("text.row-label").data(labels).join("text")
  .attr("class", "row-label")
  .attr("x", -14)
  .attr("y", (_, i) => i * cell + cell / 2)
  .attr("text-anchor", "end")
  .attr("dominant-baseline", "central")
  .style("font-size", "18px")
  .attr("fill", t.inkSoft)
  .text((d) => d);

// --- Column labels (bottom, rotated) ------------------------------------
g.selectAll("text.col-label").data(labels).join("text")
  .attr("class", "col-label")
  .attr("transform", (_, i) => `translate(${i * cell + cell / 2},${side + 16}) rotate(-40)`)
  .attr("text-anchor", "end")
  .style("font-size", "18px")
  .attr("fill", t.inkSoft)
  .text((d) => d);

// --- Colorbar legend (fixed -1..1 range) --------------------------------
const barX = side + 50;
const barWidth = 26;
const defs = svg.append("defs");
const gradient = defs.append("linearGradient")
  .attr("id", "div-gradient")
  .attr("x1", "0").attr("x2", "0").attr("y1", "1").attr("y2", "0");
d3.range(0, 1.0001, 0.1).forEach((frac) => {
  gradient.append("stop")
    .attr("offset", `${frac * 100}%`)
    .attr("stop-color", colorScale(-1 + frac * 2));
});

const bar = g.append("g").attr("transform", `translate(${barX},0)`);
bar.append("rect")
  .attr("width", barWidth)
  .attr("height", side)
  .attr("fill", "url(#div-gradient)")
  .attr("stroke", t.inkSoft);

const barScale = d3.scaleLinear().domain([-1, 1]).range([side, 0]);
const barTicks = bar.append("g").attr("transform", `translate(${barWidth},0)`)
  .call(d3.axisRight(barScale).tickValues([-1, -0.5, 0, 0.5, 1]).tickSize(6));
barTicks.selectAll("text").attr("fill", t.inkSoft).style("font-size", "16px");
barTicks.selectAll("line").attr("stroke", t.grid);
barTicks.select(".domain").attr("stroke", t.inkSoft);

bar.append("text")
  .attr("x", barWidth / 2)
  .attr("y", -18)
  .attr("text-anchor", "middle")
  .style("font-size", "16px")
  .attr("fill", t.inkSoft)
  .text("r");

// --- Title ----------------------------------------------------------------
svg.append("text")
  .attr("x", width / 2)
  .attr("y", 70)
  .attr("text-anchor", "middle")
  .attr("fill", t.ink)
  .style("font-size", "22px")
  .style("font-weight", 600)
  .text("heatmap-correlation · javascript · d3 · anyplot.ai");
Runnable source as JSON, for any HTTP client: https://api.anyplot.ai/specs/heatmap-correlation/d3/code. Any spec id and library id listed in llms-full.txt fit the same URL shape; every URL below is complete and callable.
{
  "spec_id": "heatmap-correlation",
  "language": "javascript",
  "library": "d3",
  "page": "https://anyplot.ai/heatmap-correlation/javascript/d3",
  "hub": "https://anyplot.ai/heatmap-correlation",
  "code_json": "https://api.anyplot.ai/specs/heatmap-correlation/d3/code",
  "spec_json": "https://api.anyplot.ai/specs/heatmap-correlation",
  "render_light_png": "https://storage.googleapis.com/anyplot-images/plots/heatmap-correlation/javascript/d3/plot-light.png",
  "render_dark_png": "https://storage.googleapis.com/anyplot-images/plots/heatmap-correlation/javascript/d3/plot-dark.png",
  "interactive_light_html": "https://storage.googleapis.com/anyplot-images/plots/heatmap-correlation/javascript/d3/plot-light.html",
  "interactive_dark_html": "https://storage.googleapis.com/anyplot-images/plots/heatmap-correlation/javascript/d3/plot-dark.html",
  "quality_score": 93.0,
  "license": "MIT",
  "guide": "https://anyplot.ai/llms.txt"
}
Part of Correlation Matrix Heatmap on anyplot.ai.