The same plot in 14 other libraries — JavaScript: Chart.js, D3.js, Highcharts, MUI X Charts; Python: Altair, Bokeh, lets-plot, Matplotlib, Plotly, plotnine, Pygal, Seaborn; R: ggplot2; Julia: Makie.jl. Compare all 15 side by side: Correlation Matrix Heatmap in Python, R, Julia and JavaScript.
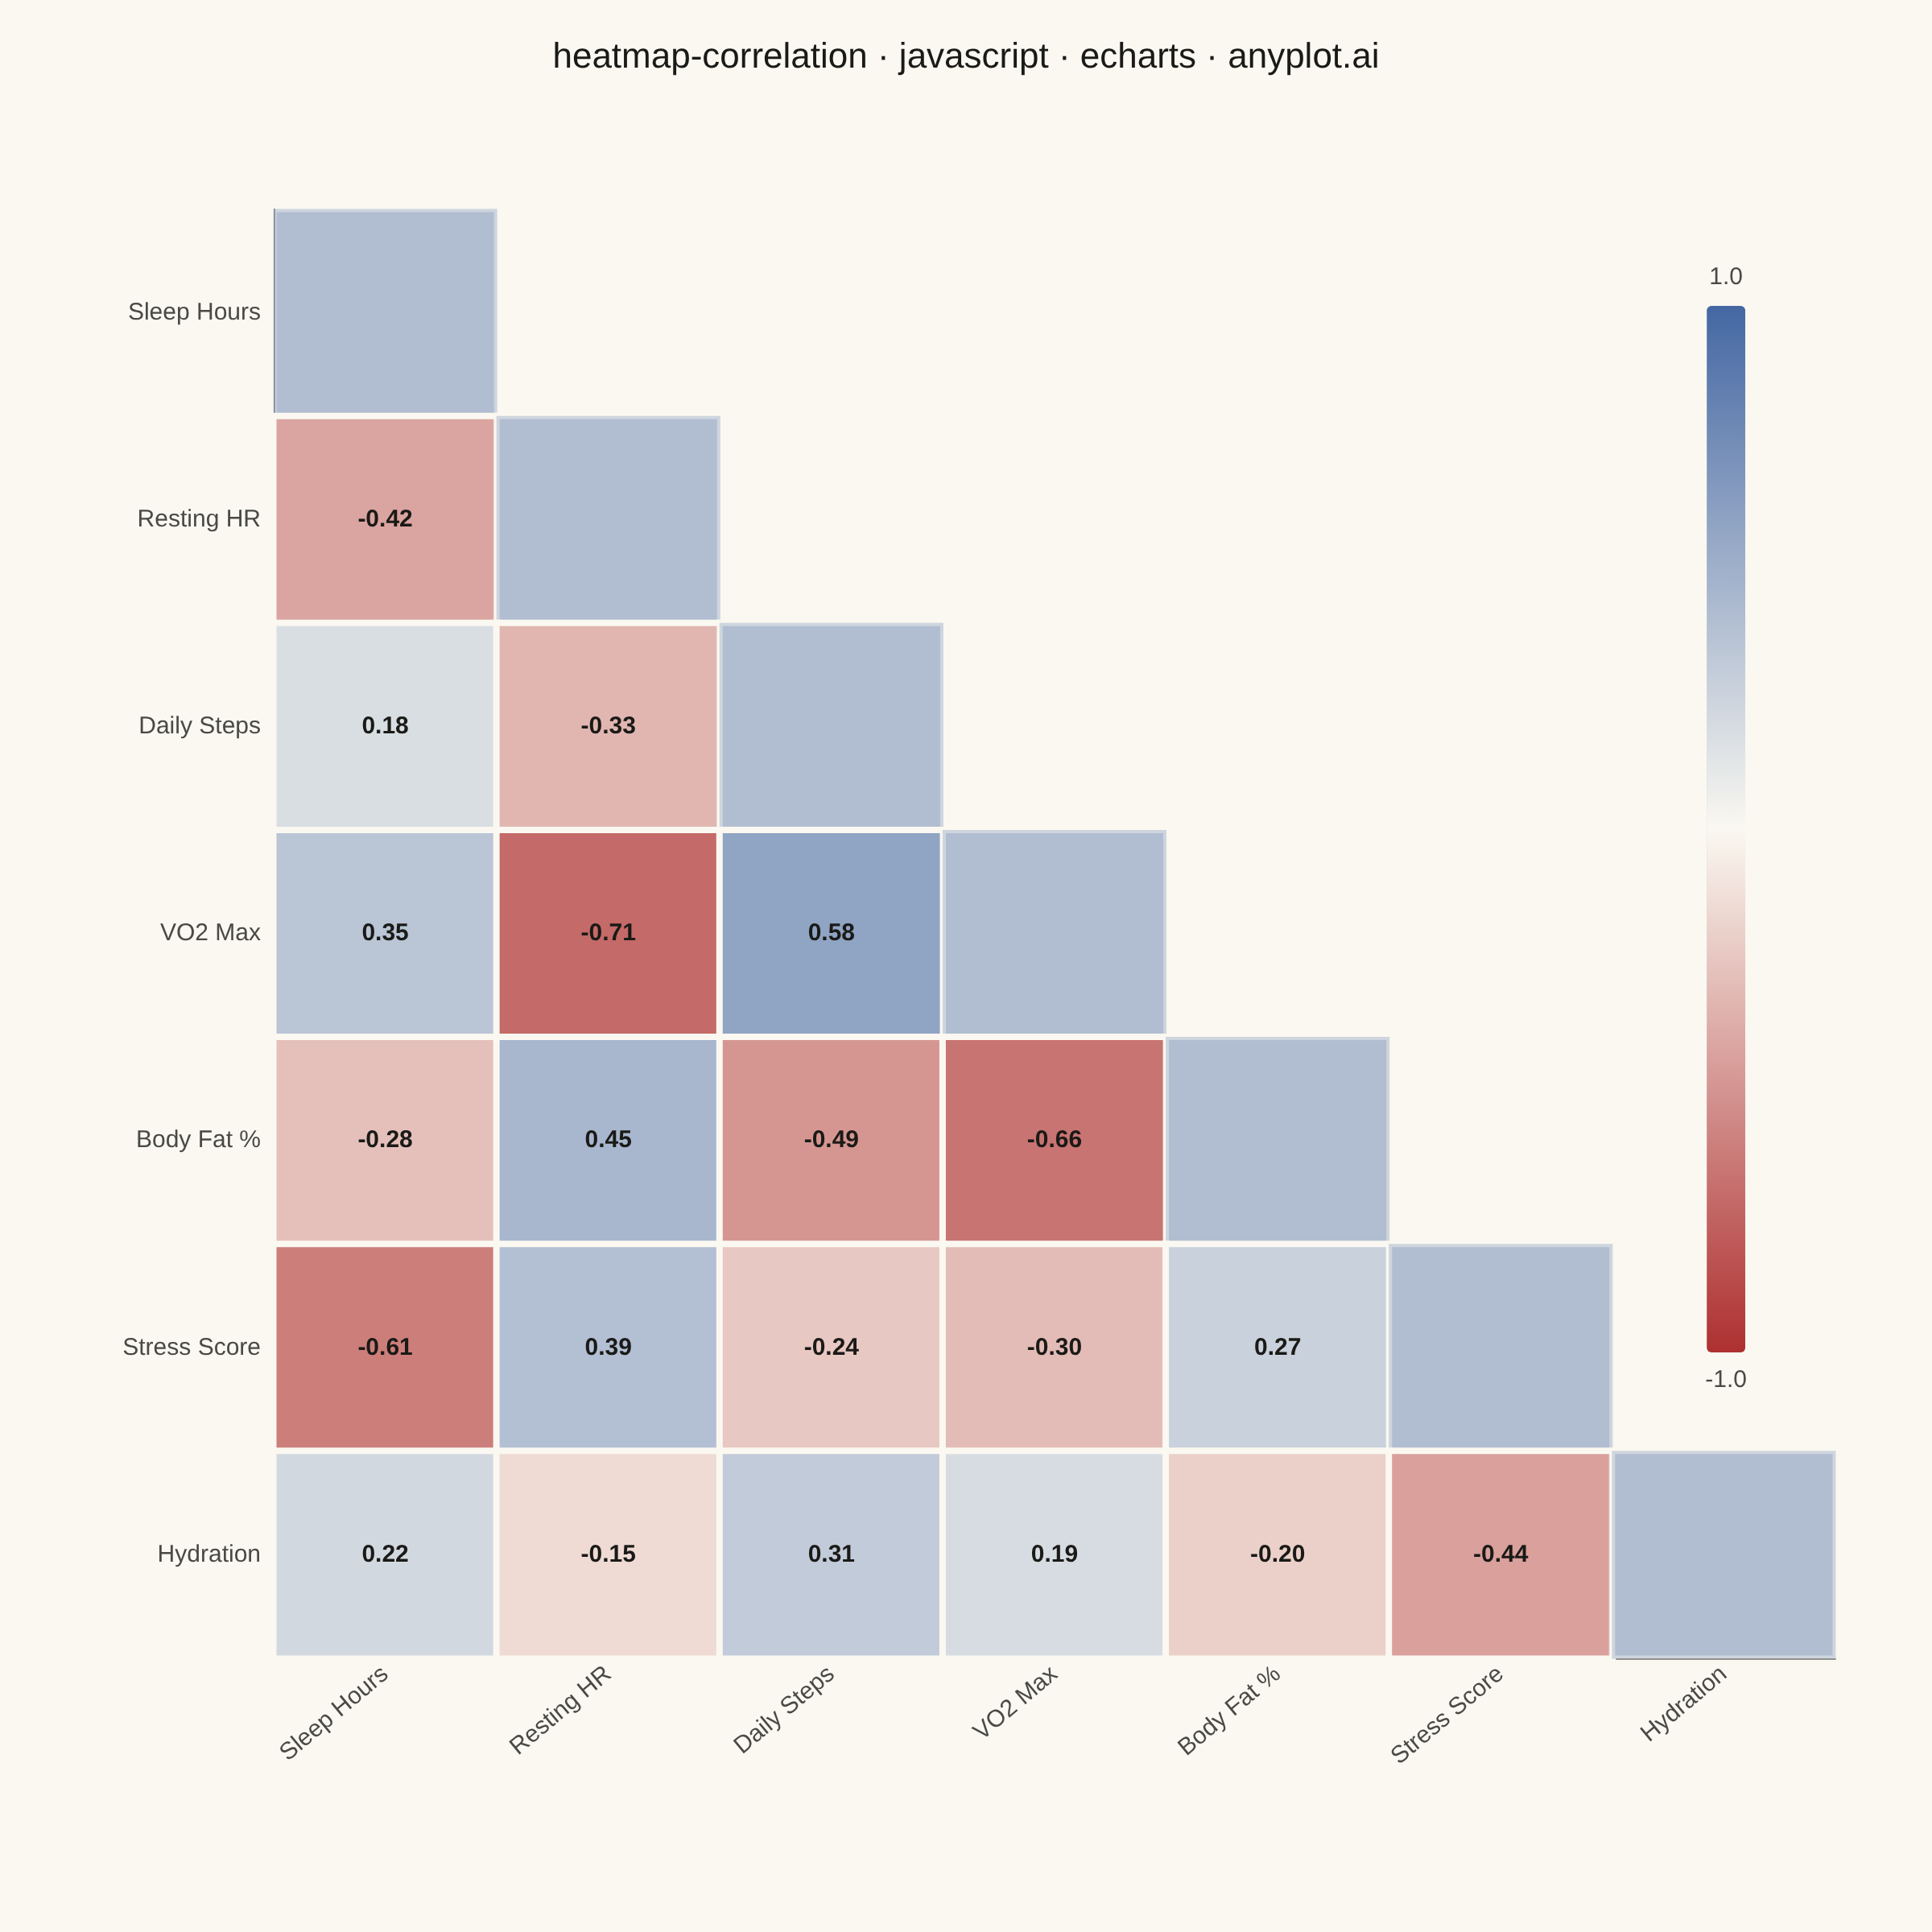
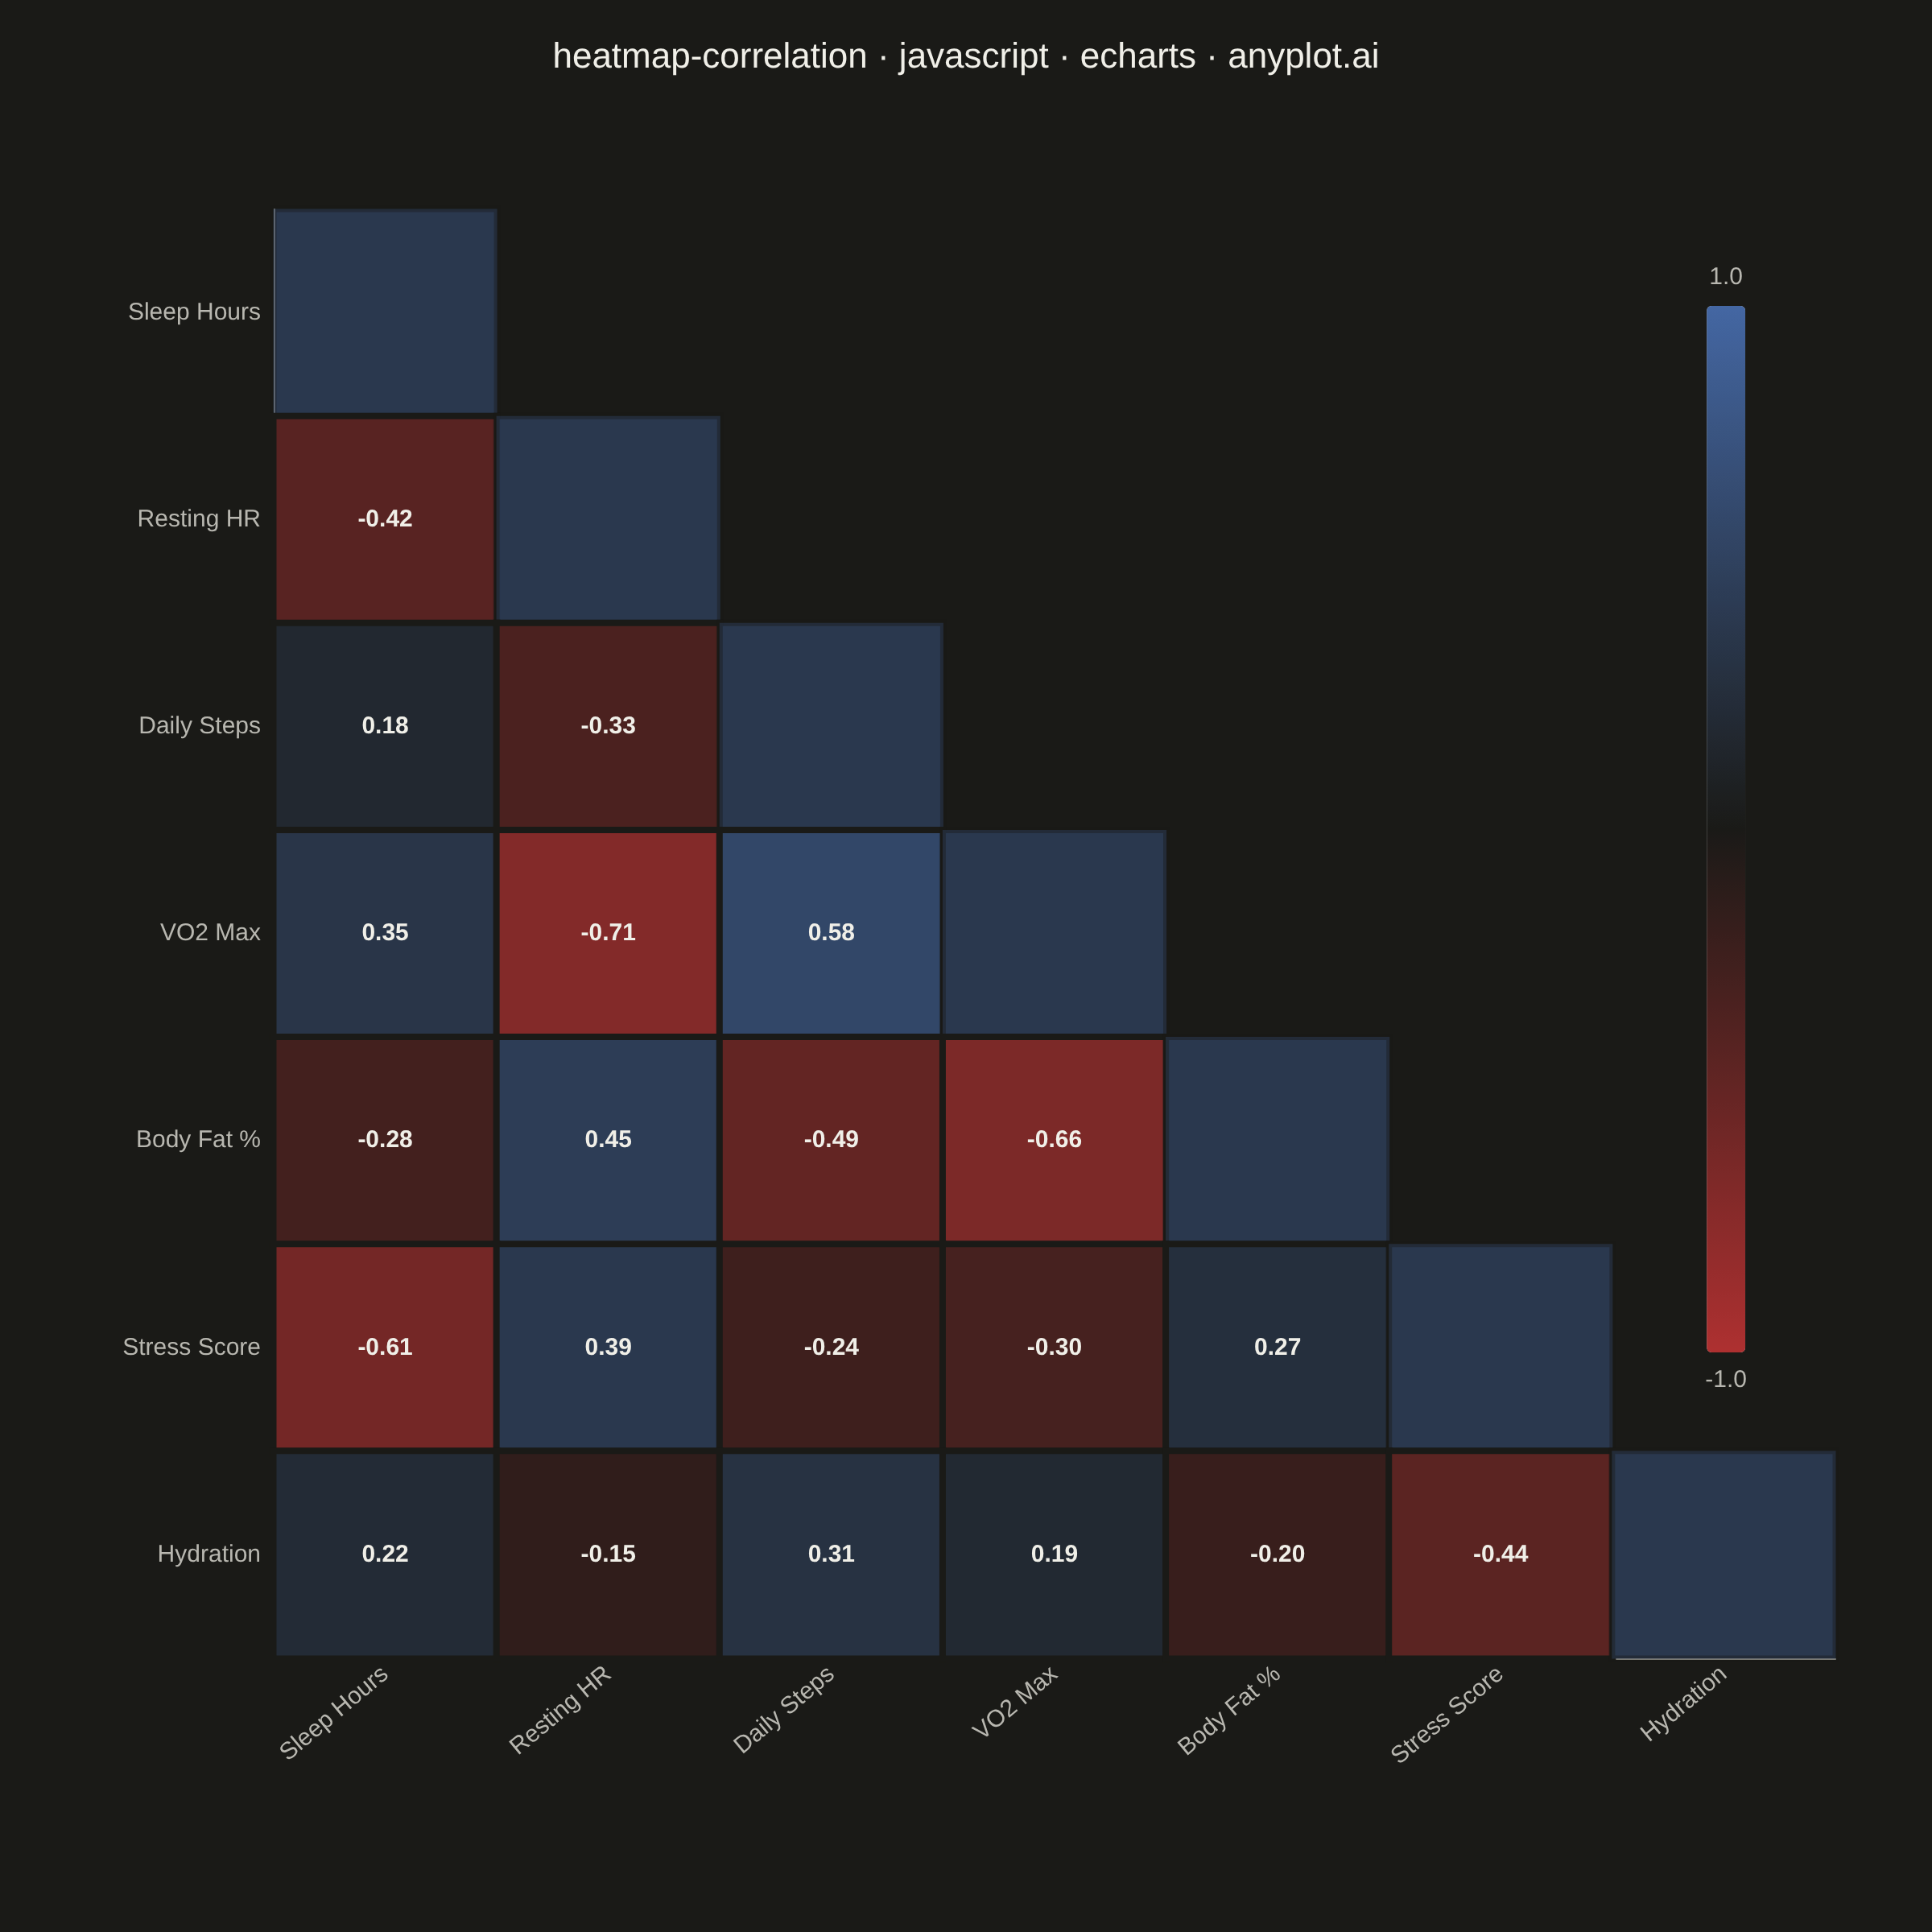
A heatmap specifically designed to display correlation coefficients between variables, using a diverging color scheme centered at zero. The symmetric matrix visualization makes it easy to identify positive correlations, negative correlations, and independent variables at a glance. Essential for exploratory data analysis, feature engineering, and multicollinearity detection in statistical and machine learning workflows.
// anyplot.ai
// heatmap-correlation: Correlation Matrix Heatmap
// Library: echarts 6.1.0 | JavaScript 22.23.2
// Quality: 91/100 | Created: 2026-08-20

//# anyplot-orientation: square
const t = window.ANYPLOT_TOKENS;

// --- Data (in-memory, deterministic) ----------------------------------------
// Pairwise correlations among wellness-tracking metrics from a fitness cohort.
const variables = [
  "Sleep Hours",
  "Resting HR",
  "Daily Steps",
  "VO2 Max",
  "Body Fat %",
  "Stress Score",
  "Hydration",
];

const correlationMatrix = [
  [1.0, -0.42, 0.18, 0.35, -0.28, -0.61, 0.22],
  [-0.42, 1.0, -0.33, -0.71, 0.45, 0.39, -0.15],
  [0.18, -0.33, 1.0, 0.58, -0.49, -0.24, 0.31],
  [0.35, -0.71, 0.58, 1.0, -0.66, -0.3, 0.19],
  [-0.28, 0.45, -0.49, -0.66, 1.0, 0.27, -0.2],
  [-0.61, 0.39, -0.24, -0.3, 0.27, 1.0, -0.44],
  [0.22, -0.15, 0.31, 0.19, -0.2, -0.44, 1.0],
];

// Per-cell label color: pick whichever ink anchor (dark vs light) wins more
// WCAG contrast against the cell's interpolated imprint_div fill, since the
// diverging colormap's red and blue endpoints have different luminance and a
// single fixed text color can't stay legible across the whole range.
const relLuminance = (r, g, b) => {
  const chan = (v) => {
    const c = v / 255;
    return c <= 0.03928 ? c / 12.92 : ((c + 0.055) / 1.055) ** 2.4;
  };
  return 0.2126 * chan(r) + 0.7152 * chan(g) + 0.0722 * chan(b);
};

const [redRgb, midRgb, blueRgb] = t.div.map((hex) => [1, 3, 5].map((i) => parseInt(hex.slice(i, i + 2), 16)));
const DARK_TEXT = "#1A1A17";
const LIGHT_TEXT = "#F0EFE8";
const darkLum = relLuminance(26, 26, 23);
const lightLum = relLuminance(240, 239, 232);

const labelColorFor = (value) => {
  const [from, to] = value <= 0 ? [midRgb, redRgb] : [midRgb, blueRgb];
  const cellLum = relLuminance(...from.map((v, i) => v + (to[i] - v) * Math.abs(value)));
  const darkContrast = (Math.max(cellLum, darkLum) + 0.05) / (Math.min(cellLum, darkLum) + 0.05);
  const lightContrast = (Math.max(cellLum, lightLum) + 0.05) / (Math.min(cellLum, lightLum) + 0.05);
  return darkContrast >= lightContrast ? DARK_TEXT : LIGHT_TEXT;
};

// Mask the upper triangle to remove the redundant mirrored half — only the
// diagonal and lower triangle carry a cell, matching the row/column order.
// Diagonal (self-correlation, always 1.00) is muted and unlabeled so focus
// stays on the informative off-diagonal correlations.
const heatmapData = [];
for (let row = 0; row < variables.length; row++) {
  for (let col = 0; col <= row; col++) {
    const value = correlationMatrix[row][col];
    const isDiagonal = col === row;
    heatmapData.push({
      value: [col, row, value],
      label: isDiagonal ? { show: false } : { color: labelColorFor(value) },
      itemStyle: isDiagonal ? { opacity: 0.4 } : {},
    });
  }
}

// --- Init --------------------------------------------------------------------
const chart = echarts.init(document.getElementById("container"));

// --- Title (scaled to length per anyplot title-fontsize rule) ---------------
const title = "heatmap-correlation · javascript · echarts · anyplot.ai";
const titleFontSize = Math.round(22 * Math.min(1, 67 / title.length));

// --- Option -------------------------------------------------------------------
chart.setOption({
  animation: false,
  backgroundColor: "transparent",
  title: {
    text: title,
    left: "center",
    top: 20,
    textStyle: { color: t.ink, fontSize: titleFontSize, fontWeight: 500 },
  },
  grid: { left: 170, right: 60, top: 130, bottom: 170 },
  xAxis: {
    type: "category",
    data: variables,
    splitArea: { show: false },
    axisLine: { lineStyle: { color: t.inkSoft } },
    axisTick: { show: false },
    axisLabel: { color: t.inkSoft, fontSize: 15, rotate: 40 },
  },
  yAxis: {
    type: "category",
    data: variables,
    inverse: true,
    splitArea: { show: false },
    axisLine: { lineStyle: { color: t.inkSoft } },
    axisTick: { show: false },
    axisLabel: { color: t.inkSoft, fontSize: 15 },
  },
  // Placed inside the grid's own top-right column, which the triangle mask
  // leaves blank for every row but the last — reuses that space instead of
  // reserving a separate margin, so the matrix itself can fill more of the
  // canvas.
  visualMap: {
    type: "continuous",
    min: -1,
    max: 1,
    calculable: false,
    orient: "vertical",
    right: 100,
    top: 150,
    itemHeight: 650,
    itemWidth: 24,
    inRange: { color: t.div },
    text: ["1.0", "-1.0"],
    textStyle: { color: t.inkSoft, fontSize: 15 },
  },
  series: [
    {
      type: "heatmap",
      data: heatmapData,
      itemStyle: { borderColor: t.pageBg, borderWidth: 4 },
      label: {
        show: true,
        fontSize: 15,
        fontWeight: 600,
        formatter: (params) => params.value[2].toFixed(2),
      },
    },
  ],
});
Runnable source as JSON, for any HTTP client: https://api.anyplot.ai/specs/heatmap-correlation/echarts/code. Any spec id and library id listed in llms-full.txt fit the same URL shape; every URL below is complete and callable.
{
  "spec_id": "heatmap-correlation",
  "language": "javascript",
  "library": "echarts",
  "page": "https://anyplot.ai/heatmap-correlation/javascript/echarts",
  "hub": "https://anyplot.ai/heatmap-correlation",
  "code_json": "https://api.anyplot.ai/specs/heatmap-correlation/echarts/code",
  "spec_json": "https://api.anyplot.ai/specs/heatmap-correlation",
  "render_light_png": "https://storage.googleapis.com/anyplot-images/plots/heatmap-correlation/javascript/echarts/plot-light.png",
  "render_dark_png": "https://storage.googleapis.com/anyplot-images/plots/heatmap-correlation/javascript/echarts/plot-dark.png",
  "interactive_light_html": "https://storage.googleapis.com/anyplot-images/plots/heatmap-correlation/javascript/echarts/plot-light.html",
  "interactive_dark_html": "https://storage.googleapis.com/anyplot-images/plots/heatmap-correlation/javascript/echarts/plot-dark.html",
  "quality_score": 91.0,
  "license": "MIT",
  "guide": "https://anyplot.ai/llms.txt"
}
Part of Correlation Matrix Heatmap on anyplot.ai.