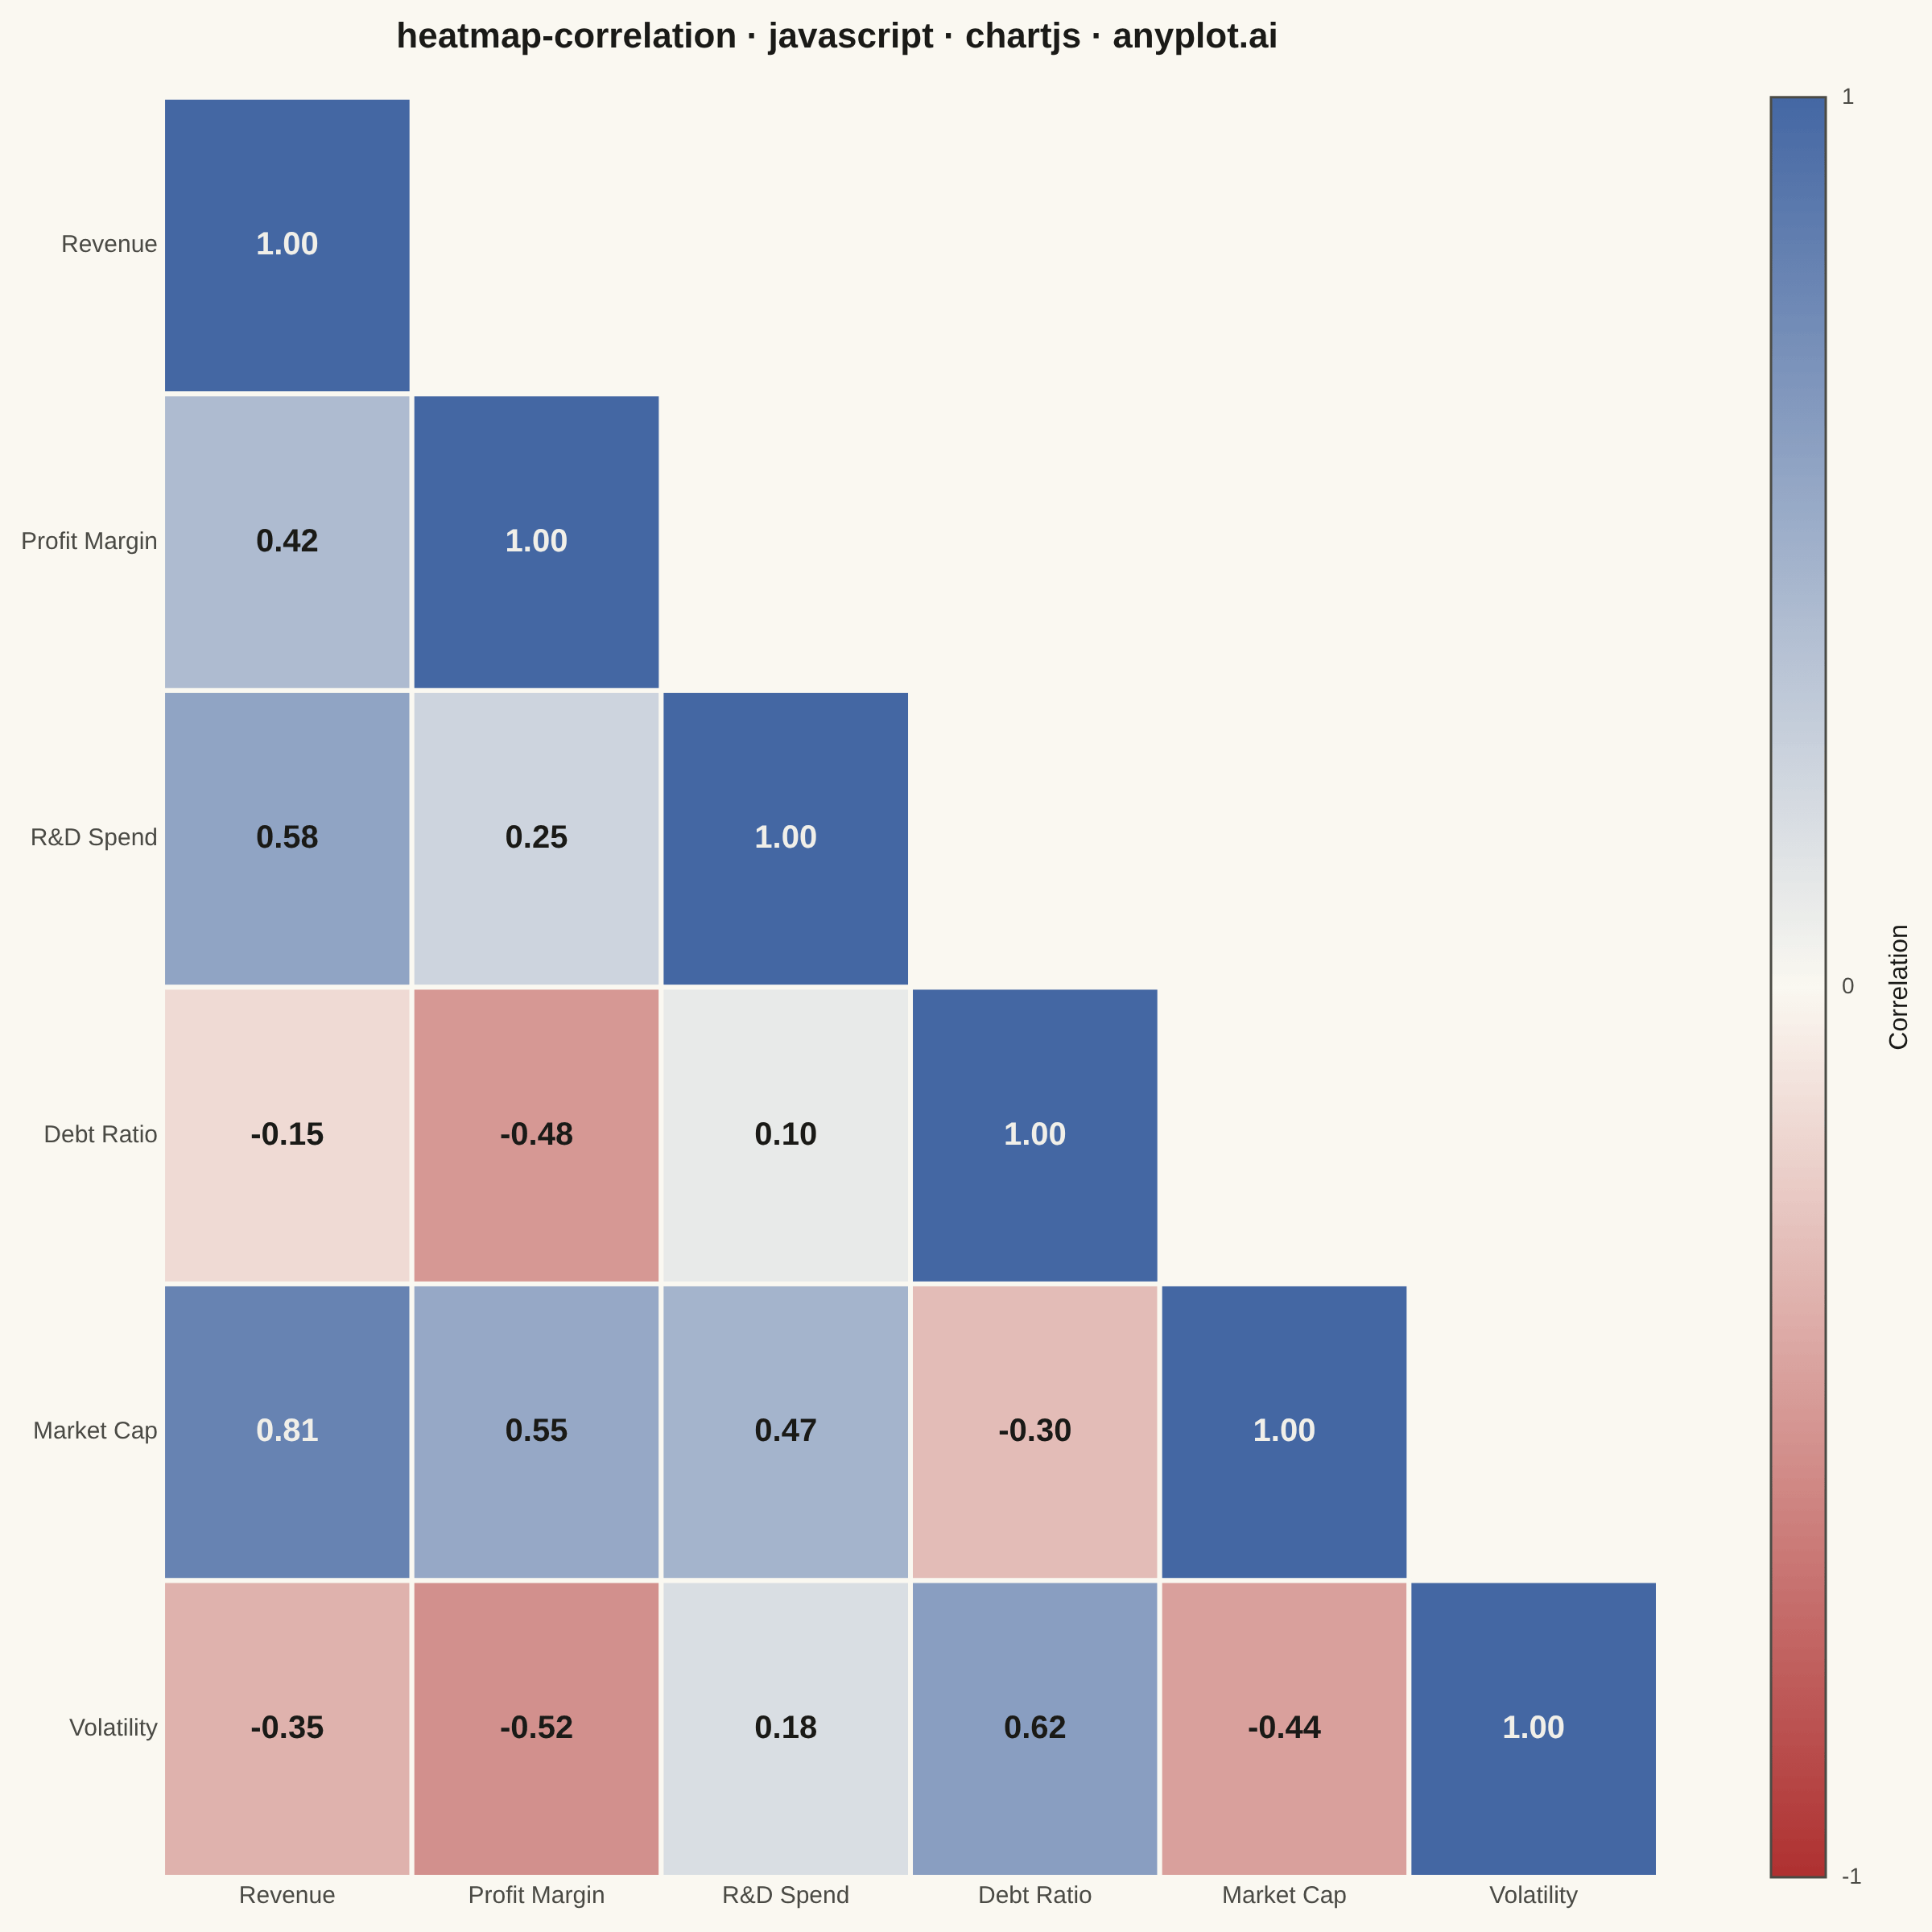
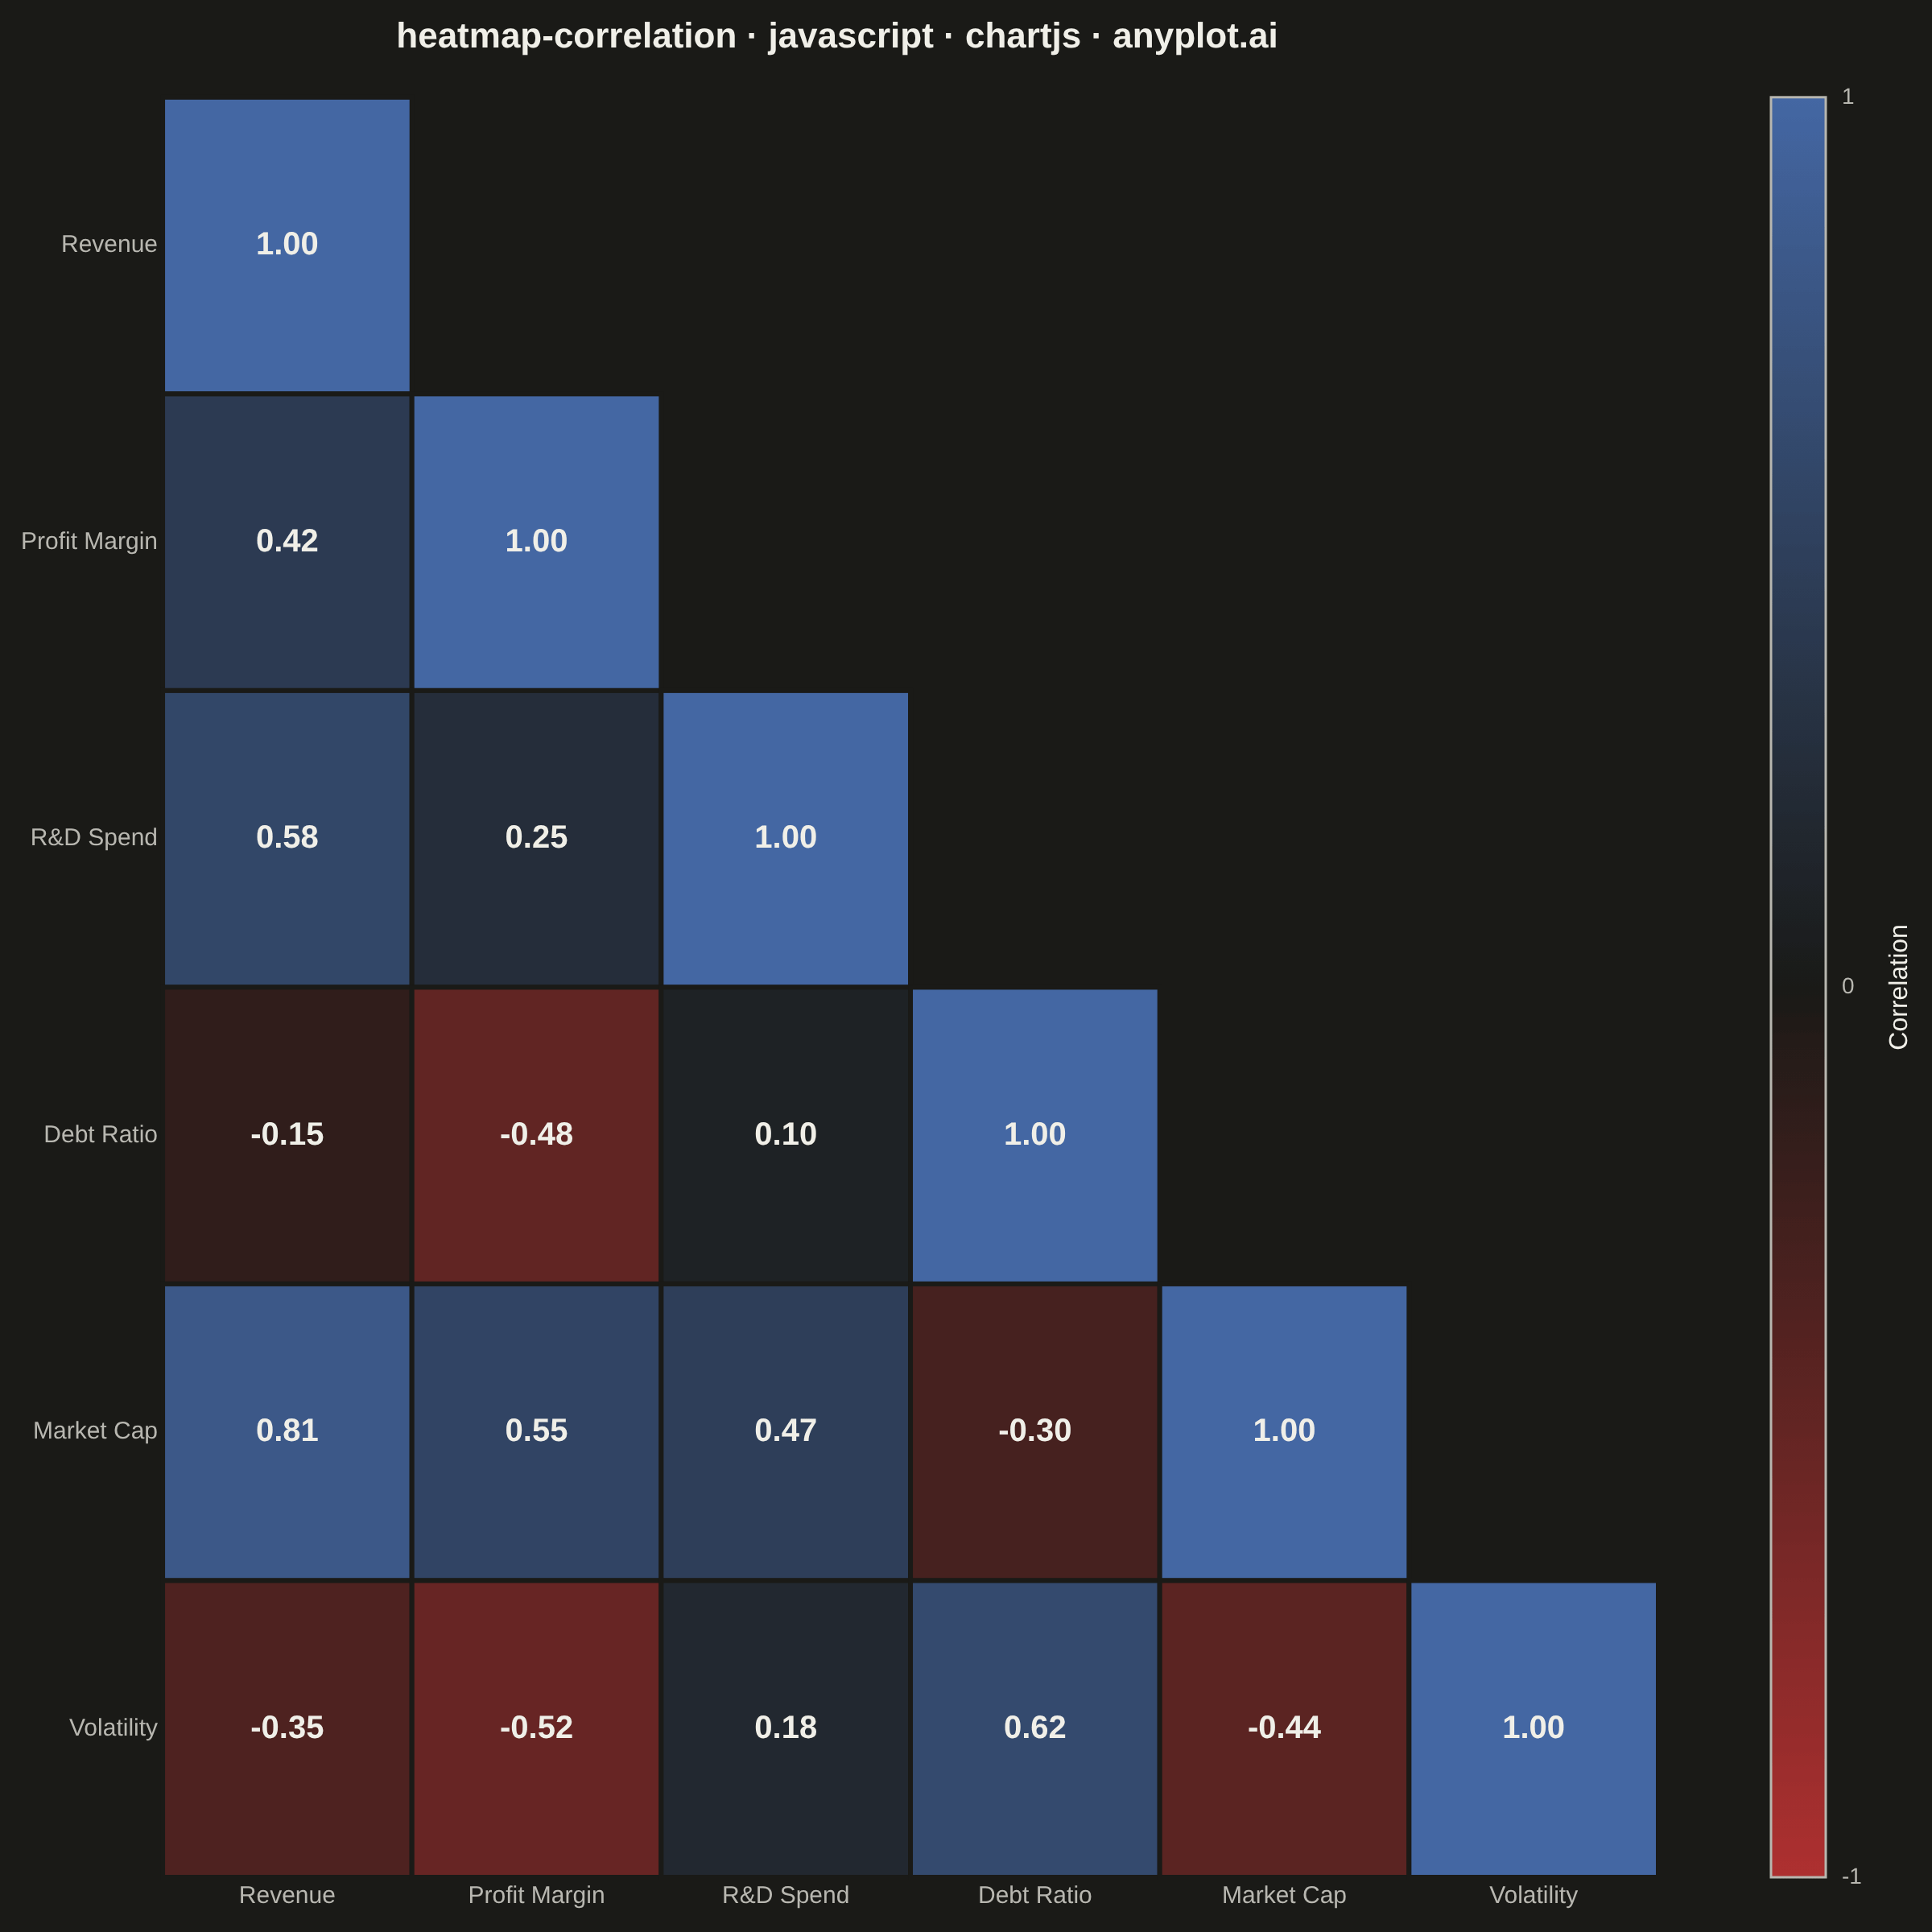
The same plot in 14 other libraries — JavaScript: D3.js, Apache ECharts, Highcharts, MUI X Charts; Python: Altair, Bokeh, lets-plot, Matplotlib, Plotly, plotnine, Pygal, Seaborn; R: ggplot2; Julia: Makie.jl. Compare all 15 side by side: Correlation Matrix Heatmap in Python, R, Julia and JavaScript.
A heatmap specifically designed to display correlation coefficients between variables, using a diverging color scheme centered at zero. The symmetric matrix visualization makes it easy to identify positive correlations, negative correlations, and independent variables at a glance. Essential for exploratory data analysis, feature engineering, and multicollinearity detection in statistical and machine learning workflows.
// anyplot.ai
// heatmap-correlation: Correlation Matrix Heatmap
// Library: chartjs 4.4.7 | JavaScript 22.23.2
// Quality: 91/100 | Created: 2026-08-18
//# anyplot-orientation: square

const t = window.ANYPLOT_TOKENS;

// --- Data (in-memory, deterministic) ----------------------------------------
// Financial metrics tracked across a portfolio of companies.
const variables = [
  "Revenue",
  "Profit Margin",
  "R&D Spend",
  "Debt Ratio",
  "Market Cap",
  "Volatility",
];

// Symmetric correlation matrix, hand-authored to reflect plausible
// relationships (diagonal = 1, values in [-1, 1]).
const correlationMatrix = [
  [1.0, 0.42, 0.58, -0.15, 0.81, -0.35],
  [0.42, 1.0, 0.25, -0.48, 0.55, -0.52],
  [0.58, 0.25, 1.0, 0.1, 0.47, 0.18],
  [-0.15, -0.48, 0.1, 1.0, -0.3, 0.62],
  [0.81, 0.55, 0.47, -0.3, 1.0, -0.44],
  [-0.35, -0.52, 0.18, 0.62, -0.44, 1.0],
];
const n = variables.length;

// --- Color helpers (Imprint imprint_div, theme-adaptive midpoint) ----------
function hexToRgb(hex) {
  const num = parseInt(hex.replace("#", ""), 16);
  return [(num >> 16) & 255, (num >> 8) & 255, num & 255];
}
function lerp(a, b, f) {
  return Math.round(a + (b - a) * f);
}
function lerpColor(hexA, hexB, f) {
  const a = hexToRgb(hexA);
  const b = hexToRgb(hexB);
  return [lerp(a[0], b[0], f), lerp(a[1], b[1], f), lerp(a[2], b[2], f)];
}
function divergingRgb(value) {
  const [neg, mid, pos] = t.div;
  return value <= 0
    ? lerpColor(neg, mid, value + 1)
    : lerpColor(mid, pos, value);
}
function rgbToCss(rgb) {
  return `rgb(${rgb[0]}, ${rgb[1]}, ${rgb[2]})`;
}
function relativeLuminance(rgb) {
  return 0.299 * rgb[0] + 0.587 * rgb[1] + 0.114 * rgb[2];
}
// Cell fills span the full imprint_div range, so label contrast is judged
// against the fill itself — not the page theme — using the two Imprint ink
// tones directly (light-theme ink for pale fills, dark-theme ink for dark
// saturated fills), independent of ANYPLOT_THEME.
function textColorFor(rgb) {
  return relativeLuminance(rgb) > 140 ? "#1A1A17" : "#F0EFE8";
}

// --- Mount -------------------------------------------------------------------
const canvas = document.createElement("canvas");
document.getElementById("container").appendChild(canvas);

// Only the lower triangle (incl. diagonal) is drawn — the upper triangle is
// redundant for a symmetric matrix (see spec "Consider masking").
const cellData = [];
for (let row = 0; row < n; row++) {
  for (let col = 0; col <= row; col++) {
    cellData.push({ x: col, y: row });
  }
}

// --- Chart --------------------------------------------------------------
// Chart.js has no native matrix/heatmap type; a scatter chart supplies
// properly scaled category axes while a custom plugin paints the cells,
// value labels, and colorbar directly on the canvas.
const heatmapPlugin = {
  id: "correlationHeatmap",
  afterDraw(chart) {
    const { ctx, chartArea, scales } = chart;
    const xScale = scales.x;
    const yScale = scales.y;
    const cellW = xScale.getPixelForValue(1) - xScale.getPixelForValue(0);
    const cellH = yScale.getPixelForValue(1) - yScale.getPixelForValue(0);

    ctx.save();
    ctx.textAlign = "center";
    ctx.textBaseline = "middle";
    ctx.font = "600 20px sans-serif";

    for (const { x: col, y: row } of cellData) {
      const value = correlationMatrix[row][col];
      const rgb = divergingRgb(value);
      const cx = xScale.getPixelForValue(col);
      const cy = yScale.getPixelForValue(row);

      ctx.fillStyle = rgbToCss(rgb);
      ctx.fillRect(
        cx - cellW / 2,
        cy - Math.abs(cellH) / 2,
        cellW,
        Math.abs(cellH),
      );
      ctx.strokeStyle = t.pageBg;
      ctx.lineWidth = 3;
      ctx.strokeRect(
        cx - cellW / 2,
        cy - Math.abs(cellH) / 2,
        cellW,
        Math.abs(cellH),
      );

      ctx.fillStyle = textColorFor(rgb);
      ctx.fillText(value.toFixed(2), cx, cy);
    }

    // --- Colorbar (fixed -1..1 range) --------------------------------------
    const barW = 34;
    const barX = chartArea.right + 70;
    const barTop = chartArea.top;
    const barBottom = chartArea.bottom;
    const posColor = rgbToCss(divergingRgb(1));
    const midColor = rgbToCss(divergingRgb(0));
    const negColor = rgbToCss(divergingRgb(-1));

    const gradient = ctx.createLinearGradient(0, barTop, 0, barBottom);
    gradient.addColorStop(0, posColor);
    gradient.addColorStop(0.5, midColor);
    gradient.addColorStop(1, negColor);
    ctx.fillStyle = gradient;
    ctx.fillRect(barX, barTop, barW, barBottom - barTop);
    ctx.strokeStyle = t.inkSoft;
    ctx.lineWidth = 1.5;
    ctx.strokeRect(barX, barTop, barW, barBottom - barTop);

    ctx.font = "14px sans-serif";
    ctx.fillStyle = t.inkSoft;
    ctx.textAlign = "left";
    ctx.textBaseline = "middle";
    ctx.fillText("1", barX + barW + 10, barTop);
    ctx.fillText("0", barX + barW + 10, (barTop + barBottom) / 2);
    ctx.fillText("-1", barX + barW + 10, barBottom);

    ctx.save();
    ctx.translate(barX + barW + 46, (barTop + barBottom) / 2);
    ctx.rotate(-Math.PI / 2);
    ctx.textAlign = "center";
    ctx.font = "16px sans-serif";
    ctx.fillStyle = t.ink;
    ctx.fillText("Correlation", 0, 0);
    ctx.restore();

    ctx.restore();
  },
};

new Chart(canvas, {
  type: "scatter",
  data: {
    datasets: [
      {
        data: variables.map((_, i) => ({ x: i, y: i })),
        pointStyle: false,
        showLine: false,
      },
    ],
  },
  options: {
    responsive: true,
    maintainAspectRatio: false,
    animation: false,
    layout: {
      padding: { top: 10, right: 170, bottom: 10, left: 10 },
    },
    plugins: {
      title: {
        display: true,
        text: "heatmap-correlation · javascript · chartjs · anyplot.ai",
        color: t.ink,
        font: { size: 22 },
        padding: { bottom: 24 },
      },
      legend: { display: false },
      tooltip: { enabled: false },
    },
    scales: {
      x: {
        type: "category",
        labels: variables,
        bounds: "ticks",
        offset: true,
        position: "bottom",
        grid: { display: false, drawTicks: false },
        border: { display: false },
        ticks: { color: t.inkSoft, font: { size: 15 } },
      },
      y: {
        type: "category",
        labels: variables,
        bounds: "ticks",
        offset: true,
        grid: { display: false, drawTicks: false },
        border: { display: false },
        ticks: { color: t.inkSoft, font: { size: 15 } },
      },
    },
  },
  plugins: [heatmapPlugin],
});
Runnable source as JSON, for any HTTP client: https://api.anyplot.ai/specs/heatmap-correlation/chartjs/code. Any spec id and library id listed in llms-full.txt fit the same URL shape; every URL below is complete and callable.
{
  "spec_id": "heatmap-correlation",
  "language": "javascript",
  "library": "chartjs",
  "page": "https://anyplot.ai/heatmap-correlation/javascript/chartjs",
  "hub": "https://anyplot.ai/heatmap-correlation",
  "code_json": "https://api.anyplot.ai/specs/heatmap-correlation/chartjs/code",
  "spec_json": "https://api.anyplot.ai/specs/heatmap-correlation",
  "render_light_png": "https://storage.googleapis.com/anyplot-images/plots/heatmap-correlation/javascript/chartjs/plot-light.png",
  "render_dark_png": "https://storage.googleapis.com/anyplot-images/plots/heatmap-correlation/javascript/chartjs/plot-dark.png",
  "interactive_light_html": "https://storage.googleapis.com/anyplot-images/plots/heatmap-correlation/javascript/chartjs/plot-light.html",
  "interactive_dark_html": "https://storage.googleapis.com/anyplot-images/plots/heatmap-correlation/javascript/chartjs/plot-dark.html",
  "quality_score": 91.0,
  "license": "MIT",
  "guide": "https://anyplot.ai/llms.txt"
}
Part of Correlation Matrix Heatmap on anyplot.ai.