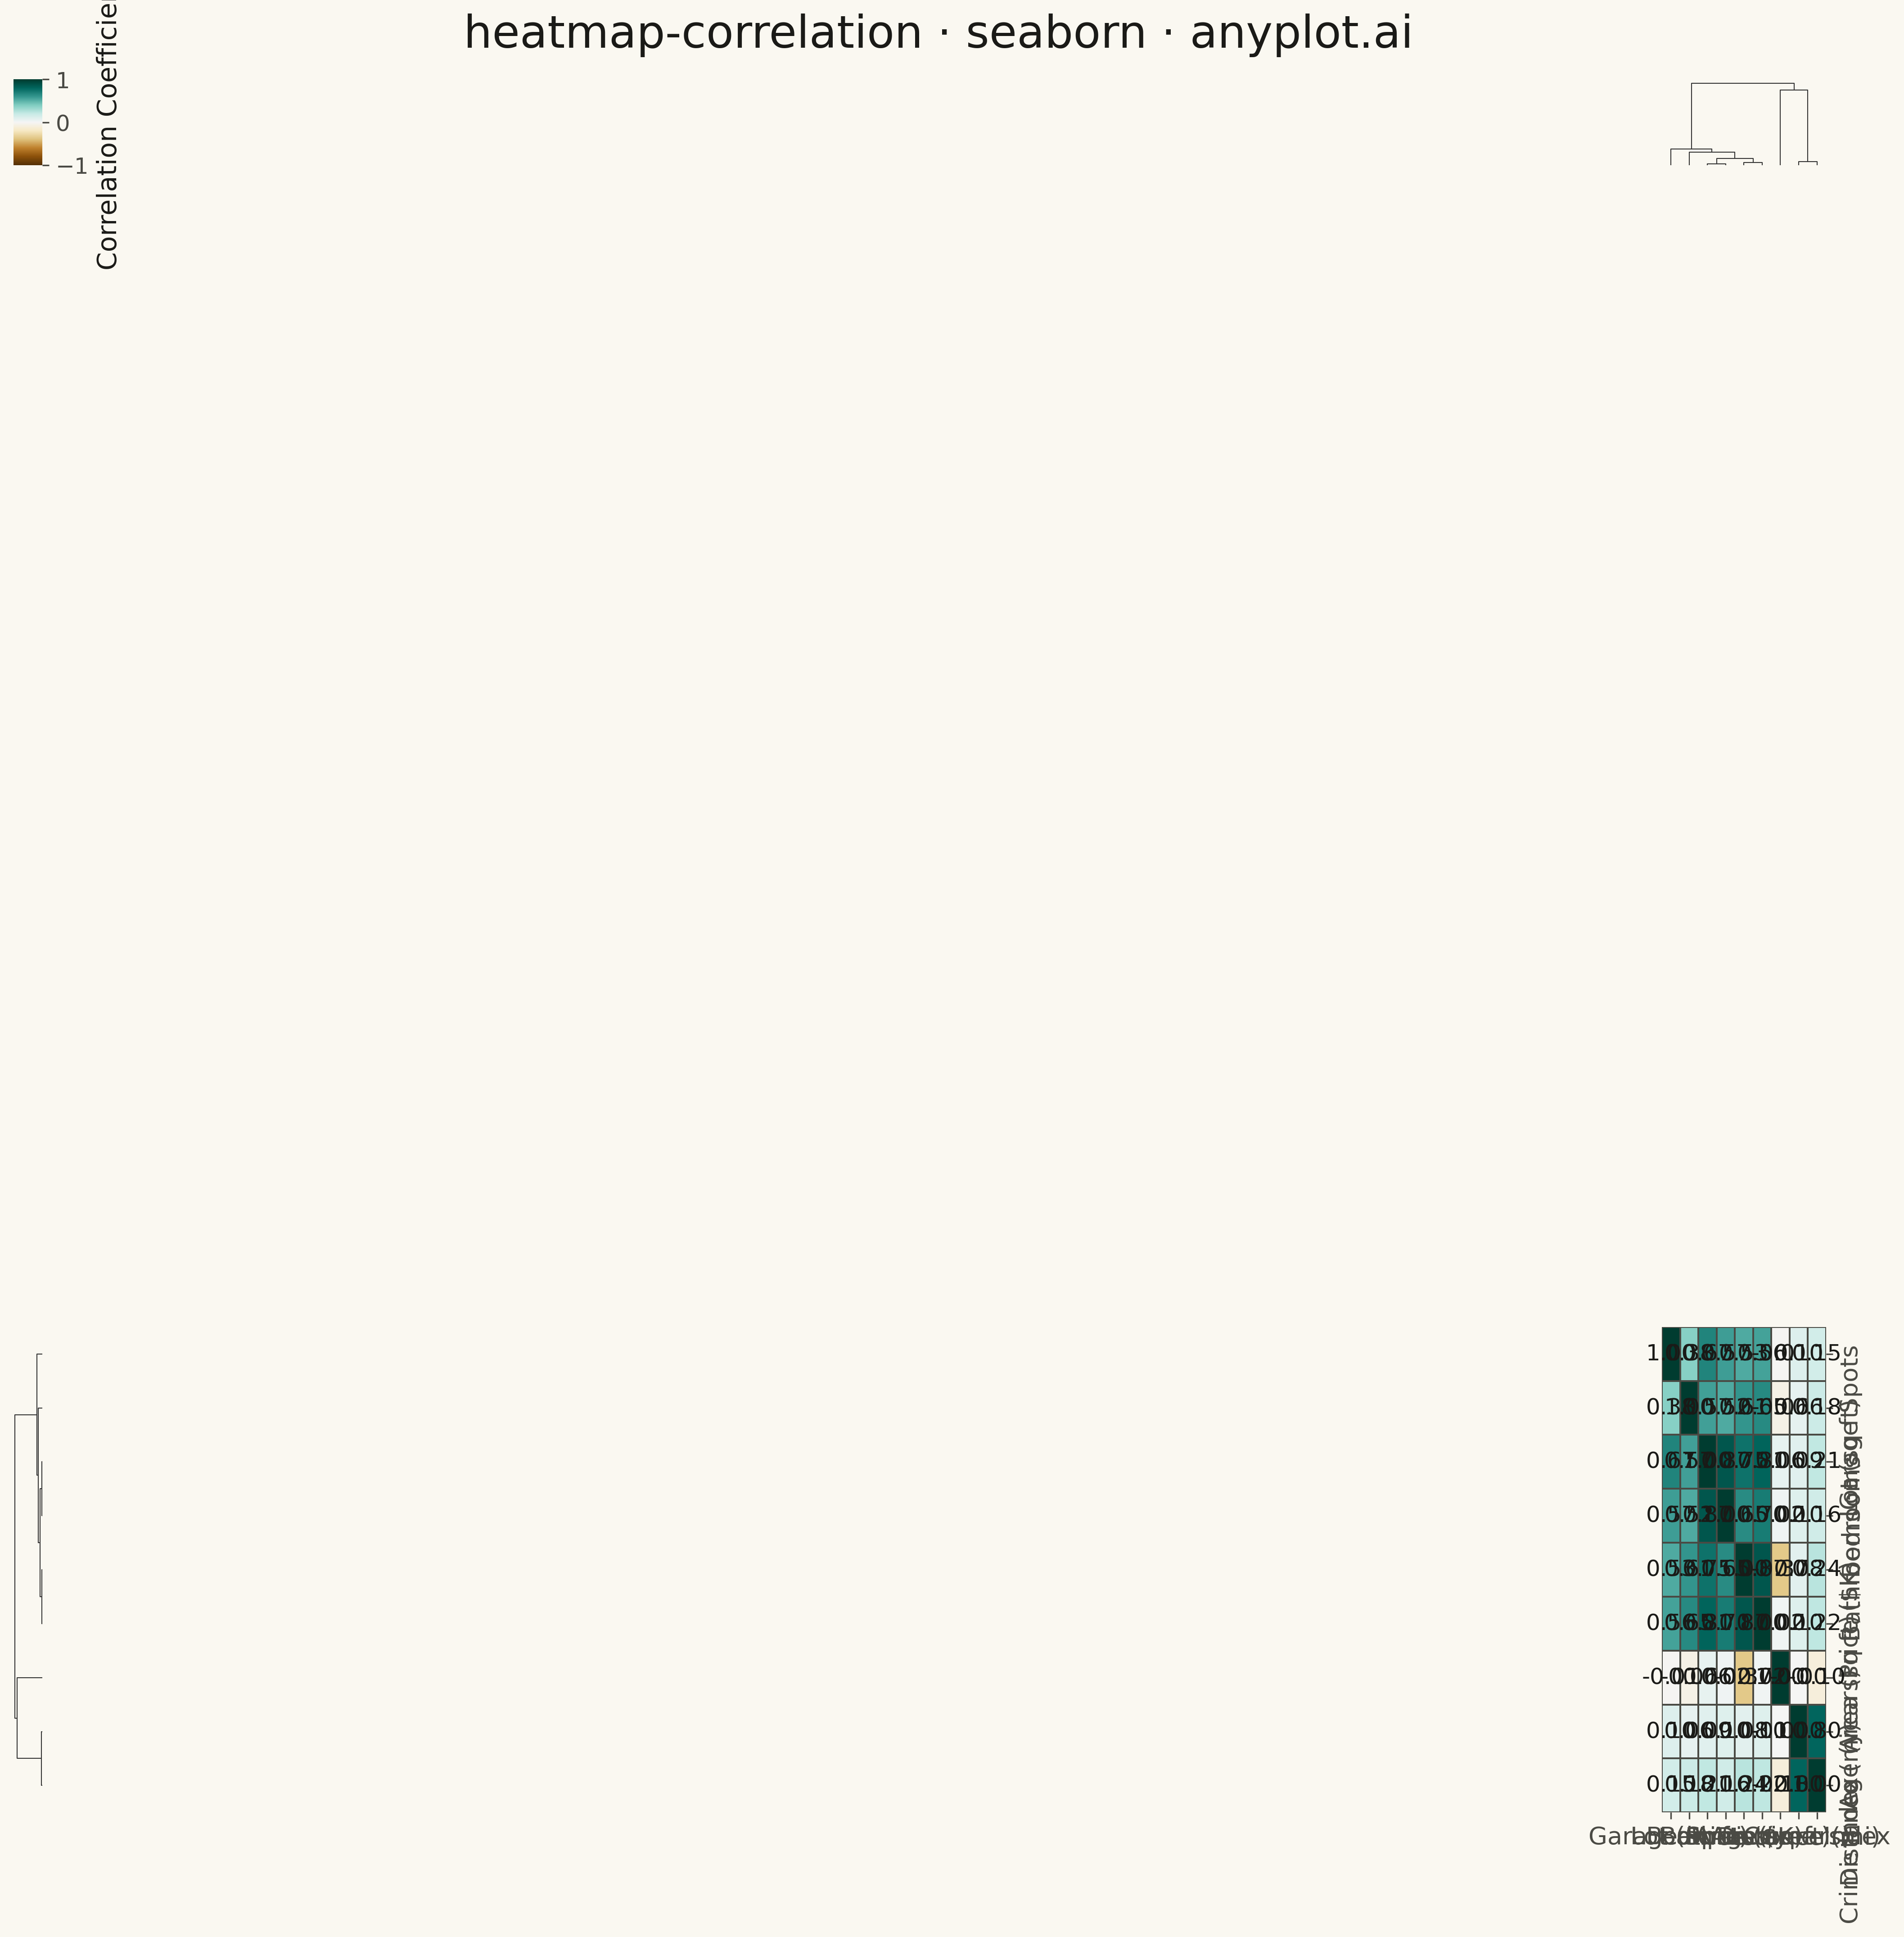
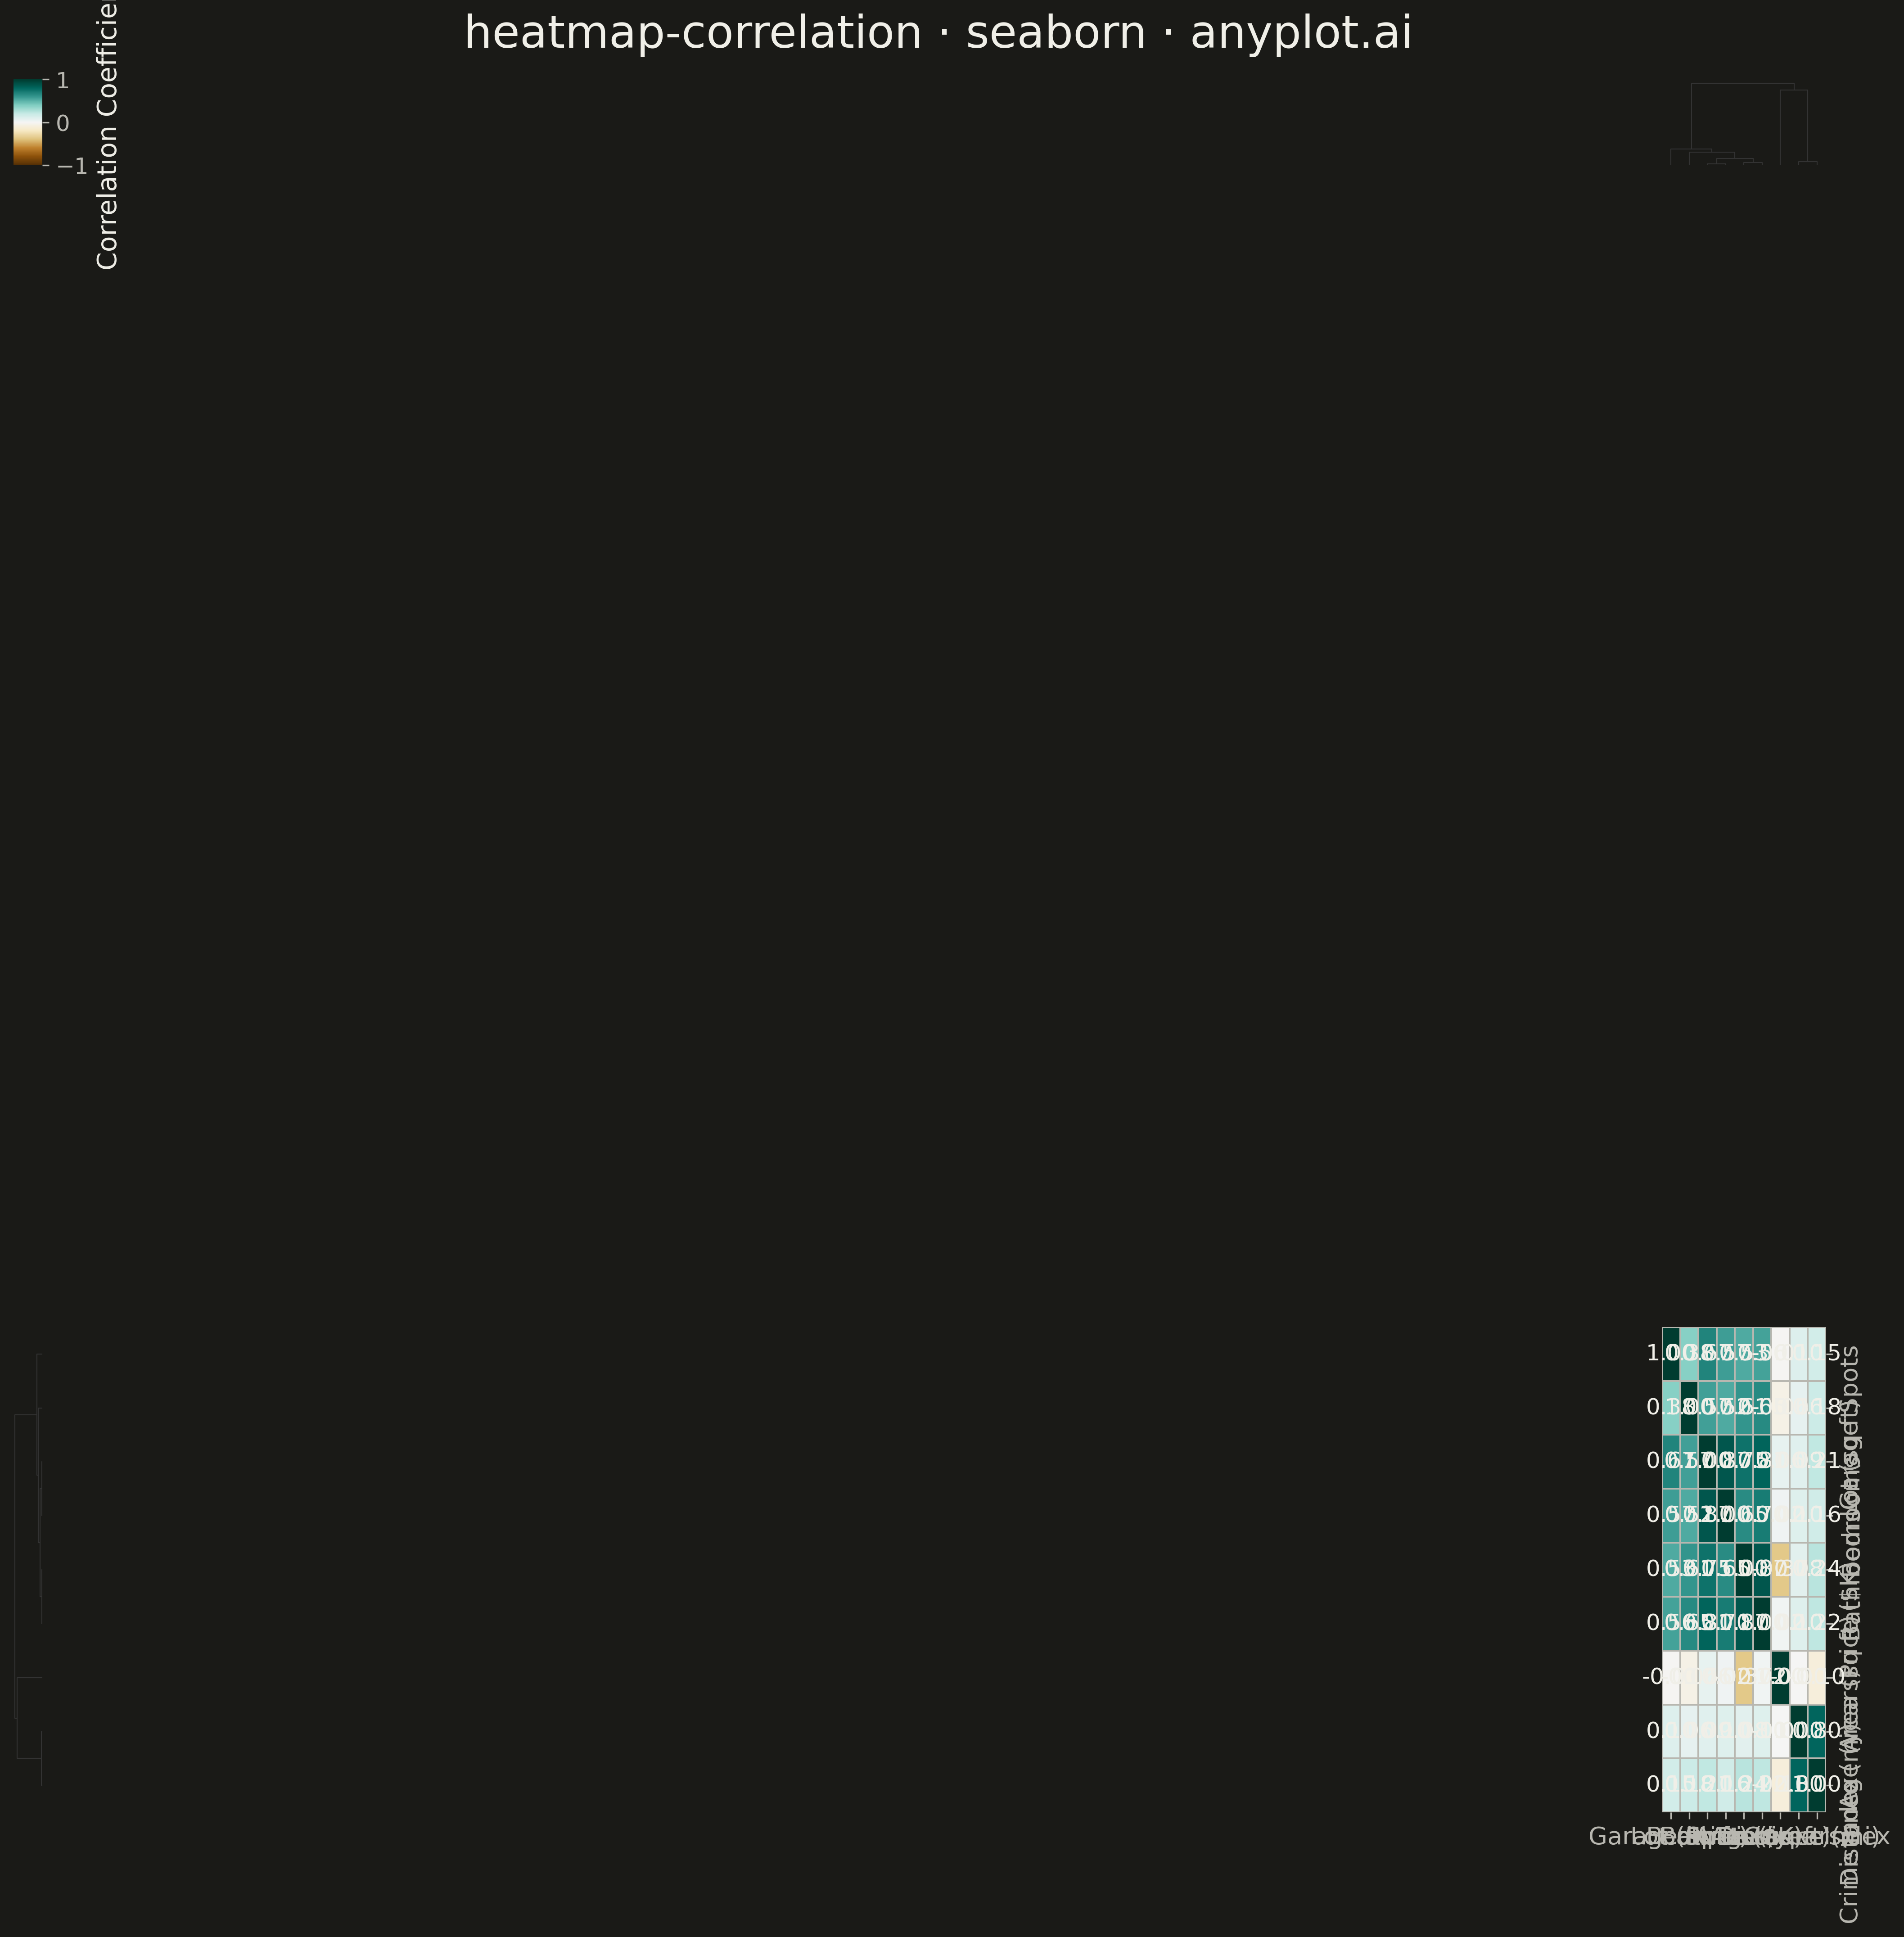
A heatmap specifically designed to display correlation coefficients between variables, using a diverging color scheme centered at zero. The symmetric matrix visualization makes it easy to identify positive correlations, negative correlations, and independent variables at a glance. Essential for exploratory data analysis, feature engineering, and multicollinearity detection in statistical and machine learning workflows.
""" anyplot.ai
heatmap-correlation: Correlation Matrix Heatmap
Library: seaborn 0.13.2 | Python 3.13.13
Quality: 76/100 | Updated: 2026-05-08
"""

import os

import matplotlib.pyplot as plt
import numpy as np
import pandas as pd
import seaborn as sns


# Theme tokens
THEME = os.getenv("ANYPLOT_THEME", "light")
PAGE_BG = "#FAF8F1" if THEME == "light" else "#1A1A17"
INK = "#1A1A17" if THEME == "light" else "#F0EFE8"
INK_SOFT = "#4A4A44" if THEME == "light" else "#B8B7B0"
ELEVATED_BG = "#FFFDF6" if THEME == "light" else "#242420"

# Data - Real estate features for correlation analysis
np.random.seed(42)
n_samples = 200

# Generate realistic correlated real estate data
sqft = np.random.normal(2000, 500, n_samples)
bedrooms = np.round(sqft / 600 + np.random.normal(0, 0.5, n_samples)).clip(1, 6)
bathrooms = np.round(bedrooms * 0.7 + np.random.normal(0, 0.3, n_samples)).clip(1, 4)
age = np.random.exponential(20, n_samples).clip(0, 80)
price = sqft * 150 + bedrooms * 15000 - age * 2000 + np.random.normal(0, 30000, n_samples)
garage = np.round(bedrooms * 0.4 + np.random.normal(0, 0.3, n_samples)).clip(0, 3)
lot_size = sqft * 2 + np.random.normal(0, 1000, n_samples)
distance_downtown = np.random.exponential(10, n_samples).clip(1, 40)
crime_rate = distance_downtown * 0.3 + np.random.normal(5, 2, n_samples)

# Create DataFrame with descriptive column names including units
df = pd.DataFrame(
    {
        "Price ($K)": price / 1000,
        "Area (sq ft)": sqft,
        "Bedrooms": bedrooms,
        "Bathrooms": bathrooms,
        "Age (years)": age,
        "Garage Spots": garage,
        "Lot (sq ft)": lot_size,
        "Distance (mi)": distance_downtown,
        "Crime Index": crime_rate,
    }
)

# Compute correlation matrix
corr_matrix = df.corr()

# Create mask for upper triangle
mask = np.triu(np.ones_like(corr_matrix, dtype=bool), k=1)

# Plot - Square format for symmetric matrix
fig, ax = plt.subplots(figsize=(12, 12), facecolor=PAGE_BG)

# Create heatmap with seaborn
sns.heatmap(
    corr_matrix,
    mask=mask,
    annot=True,
    fmt=".2f",
    cmap="BrBG",
    center=0,
    vmin=-1,
    vmax=1,
    square=True,
    linewidths=0.5,
    linecolor=INK_SOFT,
    cbar_kws={"shrink": 0.8, "label": "Correlation Coefficient"},
    annot_kws={"size": 14, "color": INK},
    ax=ax,
)

# Style
ax.set_facecolor(PAGE_BG)
ax.set_title("heatmap-correlation · seaborn · anyplot.ai", fontsize=24, pad=20, color=INK)
ax.set_xlabel("", fontsize=0)
ax.set_ylabel("", fontsize=0)
ax.tick_params(axis="both", labelsize=14, colors=INK_SOFT)

# Rotate labels for readability
plt.xticks(rotation=45, ha="right")
plt.yticks(rotation=0)

# Style colorbar
cbar = ax.collections[0].colorbar
cbar.ax.tick_params(labelsize=14, colors=INK_SOFT)
cbar.ax.set_ylabel("Correlation Coefficient", fontsize=16, color=INK)
cbar.ax.yaxis.set_label_position("right")
cbar.ax.set_facecolor(PAGE_BG)

plt.tight_layout()
plt.savefig(f"plot-{THEME}.png", dpi=300, bbox_inches="tight", facecolor=PAGE_BG)
Runnable source as JSON, for any HTTP client: https://api.anyplot.ai/specs/heatmap-correlation/seaborn/code. Any spec id and library id listed in llms-full.txt fit the same URL shape; every URL below is complete and callable.
{
  "spec_id": "heatmap-correlation",
  "language": "python",
  "library": "seaborn",
  "page": "https://anyplot.ai/heatmap-correlation/python/seaborn",
  "hub": "https://anyplot.ai/heatmap-correlation",
  "code_json": "https://api.anyplot.ai/specs/heatmap-correlation/seaborn/code",
  "spec_json": "https://api.anyplot.ai/specs/heatmap-correlation",
  "render_light_png": "https://storage.googleapis.com/anyplot-images/plots/heatmap-correlation/python/seaborn/plot-light.png",
  "render_dark_png": "https://storage.googleapis.com/anyplot-images/plots/heatmap-correlation/python/seaborn/plot-dark.png",
  "quality_score": 76.0,
  "license": "MIT",
  "guide": "https://anyplot.ai/llms.txt"
}
Part of Correlation Matrix Heatmap on anyplot.ai.