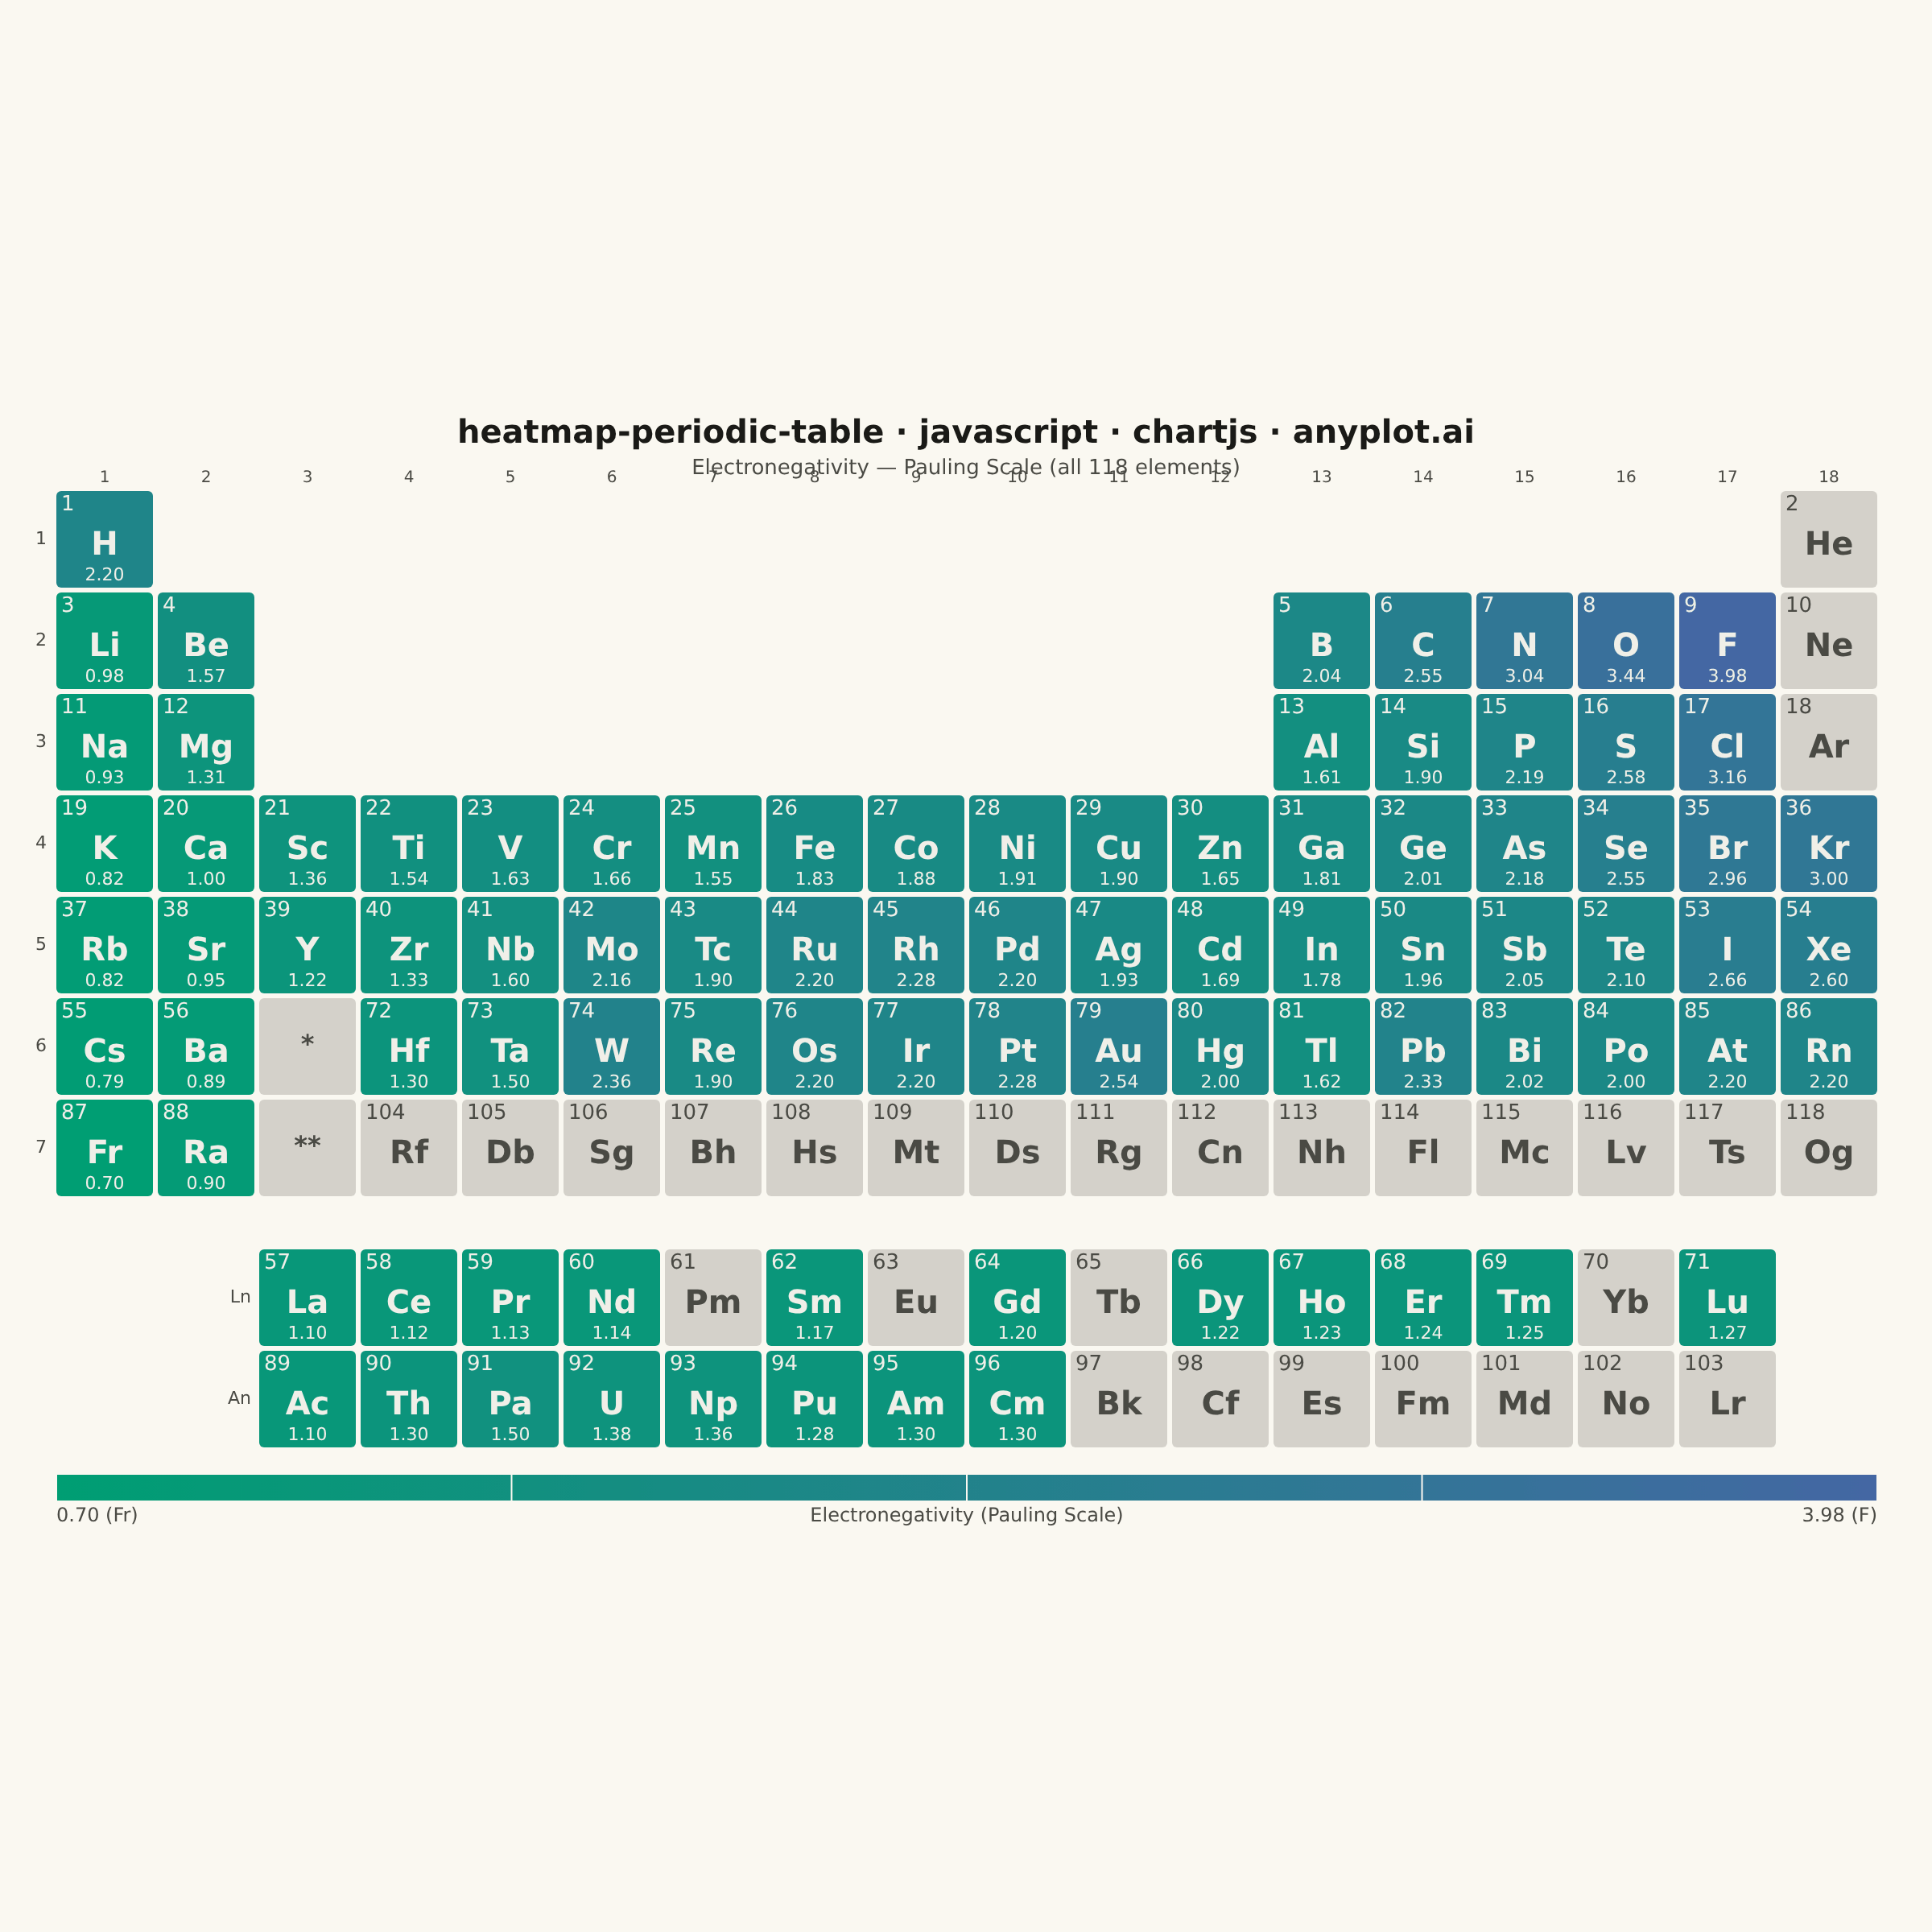
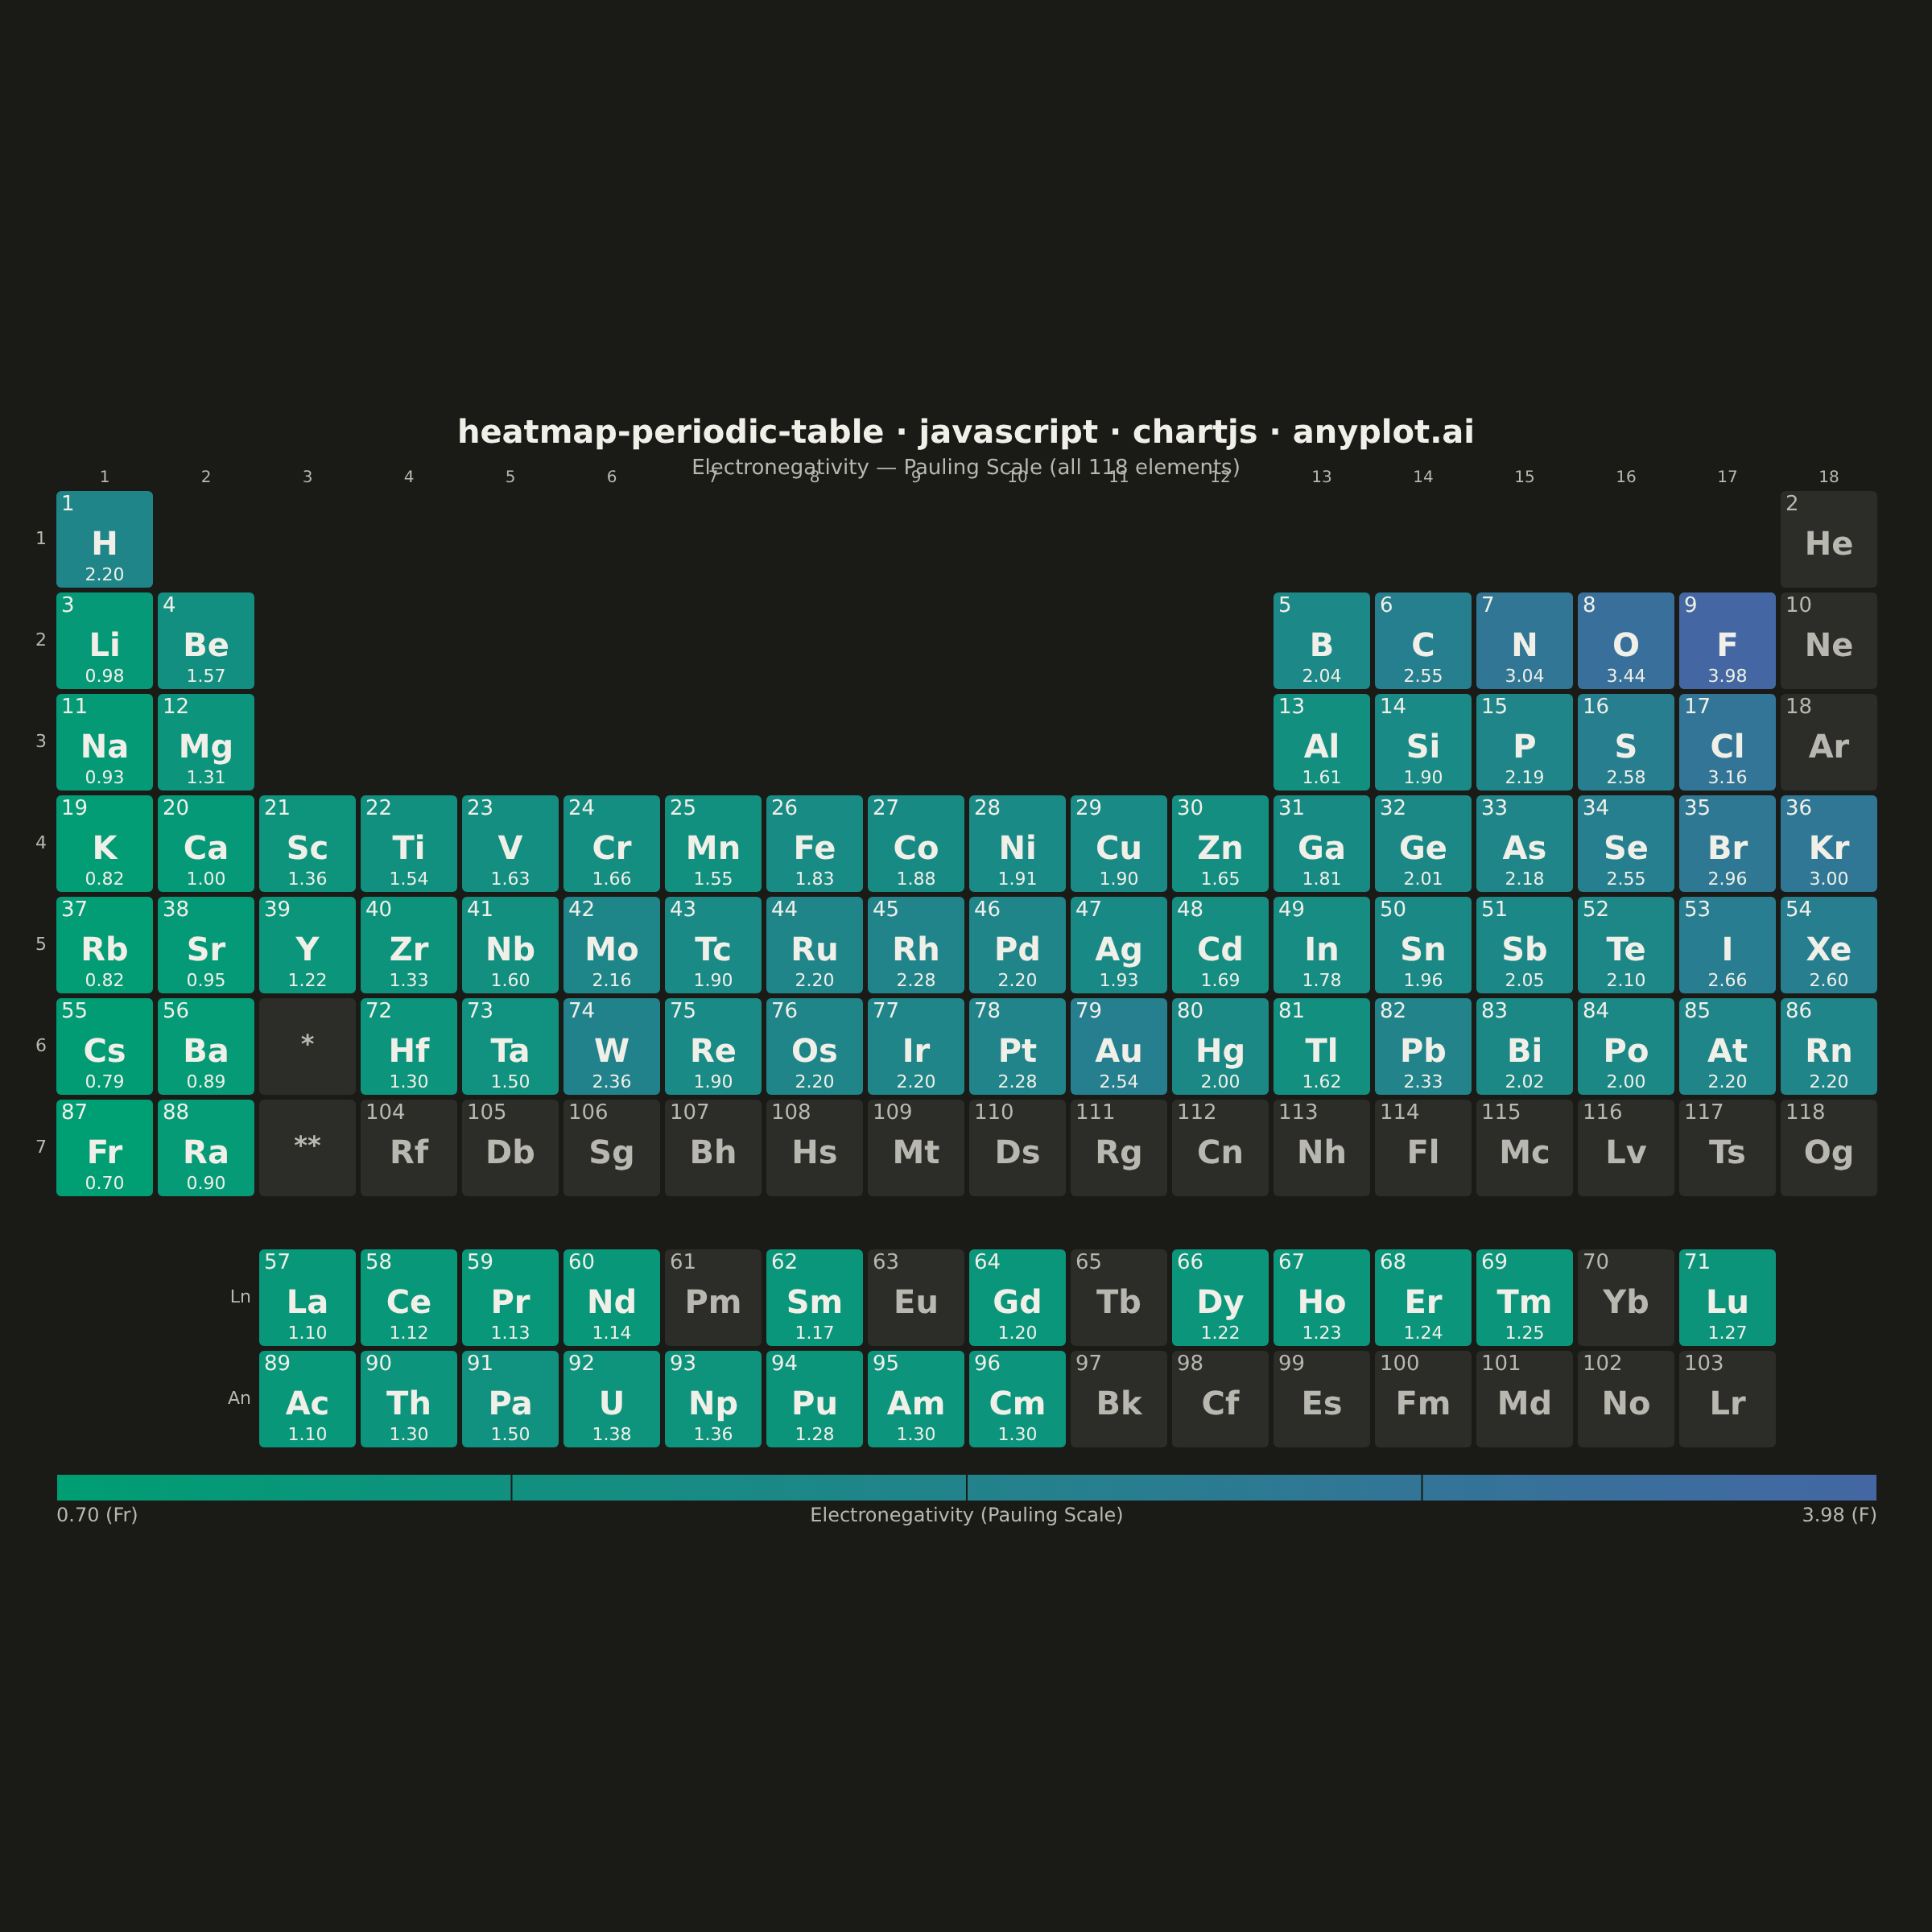
A periodic table of the elements rendered in its canonical layout — 18 groups across by 7 periods down, with the lanthanide and actinide series detached as two separate rows below — where each element tile is colored by a continuous property such as electronegativity, atomic radius, melting point, or first ionization energy. A colorbar maps tile color to property value, and every tile carries the element symbol and atomic number, optionally with the numeric property value. This visualization fuses an immediately recognizable fixed grid with heatmap encoding, turning a familiar reference chart into a tool for spotting periodic trends at a glance.
// anyplot.ai
// heatmap-periodic-table: Periodic Table Property Heatmap
// Library: chartjs 4.4.7 | JavaScript 22.22.3
// Quality: 90/100 | Created: 2026-06-15
//# anyplot-orientation: square
// anyplot.ai
// heatmap-periodic-table: Periodic Table Property Heatmap
// Library: chartjs 4.4.7 | JavaScript 22
// Quality: pending | Created: 2026-06-15

const t = window.ANYPLOT_TOKENS;

// Element data: [symbol, Z, col(1-18), row(1-7 main | 8=lanthanides | 9=actinides), EN|null]
const ELEMENTS = [
  ["H",1,1,1,2.20],["He",2,18,1,null],
  ["Li",3,1,2,0.98],["Be",4,2,2,1.57],["B",5,13,2,2.04],["C",6,14,2,2.55],["N",7,15,2,3.04],["O",8,16,2,3.44],["F",9,17,2,3.98],["Ne",10,18,2,null],
  ["Na",11,1,3,0.93],["Mg",12,2,3,1.31],["Al",13,13,3,1.61],["Si",14,14,3,1.90],["P",15,15,3,2.19],["S",16,16,3,2.58],["Cl",17,17,3,3.16],["Ar",18,18,3,null],
  ["K",19,1,4,0.82],["Ca",20,2,4,1.00],["Sc",21,3,4,1.36],["Ti",22,4,4,1.54],["V",23,5,4,1.63],["Cr",24,6,4,1.66],["Mn",25,7,4,1.55],["Fe",26,8,4,1.83],["Co",27,9,4,1.88],["Ni",28,10,4,1.91],["Cu",29,11,4,1.90],["Zn",30,12,4,1.65],["Ga",31,13,4,1.81],["Ge",32,14,4,2.01],["As",33,15,4,2.18],["Se",34,16,4,2.55],["Br",35,17,4,2.96],["Kr",36,18,4,3.00],
  ["Rb",37,1,5,0.82],["Sr",38,2,5,0.95],["Y",39,3,5,1.22],["Zr",40,4,5,1.33],["Nb",41,5,5,1.60],["Mo",42,6,5,2.16],["Tc",43,7,5,1.90],["Ru",44,8,5,2.20],["Rh",45,9,5,2.28],["Pd",46,10,5,2.20],["Ag",47,11,5,1.93],["Cd",48,12,5,1.69],["In",49,13,5,1.78],["Sn",50,14,5,1.96],["Sb",51,15,5,2.05],["Te",52,16,5,2.10],["I",53,17,5,2.66],["Xe",54,18,5,2.60],
  ["Cs",55,1,6,0.79],["Ba",56,2,6,0.89],["Hf",72,4,6,1.30],["Ta",73,5,6,1.50],["W",74,6,6,2.36],["Re",75,7,6,1.90],["Os",76,8,6,2.20],["Ir",77,9,6,2.20],["Pt",78,10,6,2.28],["Au",79,11,6,2.54],["Hg",80,12,6,2.00],["Tl",81,13,6,1.62],["Pb",82,14,6,2.33],["Bi",83,15,6,2.02],["Po",84,16,6,2.00],["At",85,17,6,2.20],["Rn",86,18,6,2.20],
  ["Fr",87,1,7,0.70],["Ra",88,2,7,0.90],["Rf",104,4,7,null],["Db",105,5,7,null],["Sg",106,6,7,null],["Bh",107,7,7,null],["Hs",108,8,7,null],["Mt",109,9,7,null],["Ds",110,10,7,null],["Rg",111,11,7,null],["Cn",112,12,7,null],["Nh",113,13,7,null],["Fl",114,14,7,null],["Mc",115,15,7,null],["Lv",116,16,7,null],["Ts",117,17,7,null],["Og",118,18,7,null],
  // Lanthanides — f-block row 8, cols 3–17
  ["La",57,3,8,1.10],["Ce",58,4,8,1.12],["Pr",59,5,8,1.13],["Nd",60,6,8,1.14],["Pm",61,7,8,null],["Sm",62,8,8,1.17],["Eu",63,9,8,null],["Gd",64,10,8,1.20],["Tb",65,11,8,null],["Dy",66,12,8,1.22],["Ho",67,13,8,1.23],["Er",68,14,8,1.24],["Tm",69,15,8,1.25],["Yb",70,16,8,null],["Lu",71,17,8,1.27],
  // Actinides — f-block row 9, cols 3–17
  ["Ac",89,3,9,1.10],["Th",90,4,9,1.30],["Pa",91,5,9,1.50],["U",92,6,9,1.38],["Np",93,7,9,1.36],["Pu",94,8,9,1.28],["Am",95,9,9,1.30],["Cm",96,10,9,1.30],["Bk",97,11,9,null],["Cf",98,12,9,null],["Es",99,13,9,null],["Fm",100,14,9,null],["Md",101,15,9,null],["No",102,16,9,null],["Lr",103,17,9,null],
];

// --- Colormap utilities (imprint_seq: #009E73 → #4467A3) ---
function hexToRgb(h) {
  return [parseInt(h.slice(1,3),16), parseInt(h.slice(3,5),16), parseInt(h.slice(5,7),16)];
}

function lerpHex(hex1, hex2, u) {
  const [r1,g1,b1] = hexToRgb(hex1);
  const [r2,g2,b2] = hexToRgb(hex2);
  return `rgb(${Math.round(r1+(r2-r1)*u)},${Math.round(g1+(g2-g1)*u)},${Math.round(b1+(b2-b1)*u)})`;
}

function enToColor(en, minV, maxV) {
  return lerpHex(t.seq[0], t.seq[1], (en - minV) / (maxV - minV));
}

function fgForBg(rgbStr) {
  const m = rgbStr.match(/rgb\((\d+),(\d+),(\d+)\)/);
  const lum = (0.299 * +m[1] + 0.587 * +m[2] + 0.114 * +m[3]) / 255;
  return lum > 0.45 ? '#1A1A17' : '#F0EFE8';
}

// --- Layout (width-constrained; table centered in square canvas) ---
const TILE = 60;
const GAP = 3;
const STEP = TILE + GAP;
const TABLE_W = 18 * TILE + 17 * GAP;  // 1131 px

const enValues = ELEMENTS.map(e => e[4]).filter(v => v !== null);
const MIN_EN = Math.min(...enValues);   // 0.70 (Fr)
const MAX_EN = Math.max(...enValues);   // 3.98 (F)

const NULL_BG = window.ANYPLOT_THEME === 'light' ? '#D4D1CA' : '#2C2C29';

// Vertical centering
const TITLE_H  = 52;
const MAIN_H   = 7 * STEP - GAP;           // 438 px (top-of-row-1 to bottom-of-row-7)
const F_GAP    = Math.round(TILE * 0.5);   // 30 px separator before f-block
const F_H      = 2 * STEP - GAP;           // 123 px (two f-block rows)
const CB_H     = 52;                        // colorbar + label area
const CONTENT_H = TITLE_H + MAIN_H + F_GAP + F_H + CB_H;  // 695 px

const CANVAS_W = window.ANYPLOT_SIZE.width;   // 1200
const CANVAS_H = window.ANYPLOT_SIZE.height;  // 1200

const TOP_PAD  = Math.round((CANVAS_H - CONTENT_H) / 2);   // ~252
const LEFT_PAD = Math.round((CANVAS_W - TABLE_W) / 2);     // ~34

const TITLE_Y    = TOP_PAD + 17;
const SUBTITLE_Y = TOP_PAD + 38;
const ORIGIN_Y   = TOP_PAD + TITLE_H;
const F_Y        = ORIGIN_Y + MAIN_H + GAP + F_GAP;
const CB_Y       = F_Y + F_H + GAP + 14;

// --- Plugin: renders the full periodic table via Canvas 2D ---
const periodicPlugin = {
  id: 'periodicTable',

  beforeDraw(chart) {
    const ctx = chart.ctx;
    ctx.fillStyle = t.pageBg;
    ctx.fillRect(0, 0, chart.width, chart.height);
  },

  afterDraw(chart) {
    const ctx = chart.ctx;
    ctx.save();

    // Title + subtitle
    ctx.textAlign = 'center';
    ctx.textBaseline = 'middle';
    ctx.fillStyle = t.ink;
    ctx.font = 'bold 20px system-ui, sans-serif';
    ctx.fillText('heatmap-periodic-table · javascript · chartjs · anyplot.ai', CANVAS_W / 2, TITLE_Y);
    ctx.font = '13px system-ui, sans-serif';
    ctx.fillStyle = t.inkSoft;
    ctx.fillText('Electronegativity — Pauling Scale (all 118 elements)', CANVAS_W / 2, SUBTITLE_Y);

    // Period labels (left of main table)
    ctx.textAlign = 'right';
    ctx.textBaseline = 'middle';
    ctx.fillStyle = t.inkSoft;
    ctx.font = '11px system-ui, sans-serif';
    for (let p = 1; p <= 7; p++) {
      ctx.fillText(String(p), LEFT_PAD - 6, ORIGIN_Y + (p - 1) * STEP + TILE / 2);
    }

    // Group labels (above main table)
    ctx.textAlign = 'center';
    ctx.textBaseline = 'bottom';
    ctx.font = '10px system-ui, sans-serif';
    for (let g = 1; g <= 18; g++) {
      ctx.fillText(String(g), LEFT_PAD + (g - 1) * STEP + TILE / 2, ORIGIN_Y - 3);
    }

    // Element tiles
    ELEMENTS.forEach(([sym, z, col, row, en]) => {
      const isF = row >= 8;
      const tx = LEFT_PAD + (col - 1) * STEP;
      const ty = isF ? F_Y + (row - 8) * STEP : ORIGIN_Y + (row - 1) * STEP;

      const bgColor = en !== null ? enToColor(en, MIN_EN, MAX_EN) : NULL_BG;
      ctx.fillStyle = bgColor;
      ctx.beginPath();
      ctx.roundRect(tx, ty, TILE, TILE, 3);
      ctx.fill();

      const fg = en !== null ? fgForBg(bgColor) : t.inkSoft;

      // Atomic number (top-left corner)
      ctx.fillStyle = fg;
      ctx.font = `${Math.round(TILE * 0.21)}px system-ui, sans-serif`;
      ctx.textAlign = 'left';
      ctx.textBaseline = 'top';
      ctx.fillText(String(z), tx + 3, ty + 2);

      // Element symbol (center, bold)
      ctx.font = `bold ${Math.round(TILE * 0.33)}px system-ui, sans-serif`;
      ctx.textAlign = 'center';
      ctx.textBaseline = 'middle';
      ctx.fillText(sym, tx + TILE / 2, ty + TILE * 0.57);

      // EN value (bottom, small)
      if (en !== null) {
        ctx.font = `${Math.round(TILE * 0.19)}px system-ui, sans-serif`;
        ctx.textBaseline = 'bottom';
        ctx.fillText(en.toFixed(2), tx + TILE / 2, ty + TILE - 2);
      }
    });

    // Placeholder tiles at group 3 for periods 6 and 7 (La/Ac pulled to f-block)
    [[6, '*'], [7, '**']].forEach(([period, lbl]) => {
      const tx = LEFT_PAD + 2 * STEP;
      const ty = ORIGIN_Y + (period - 1) * STEP;
      ctx.fillStyle = NULL_BG;
      ctx.beginPath();
      ctx.roundRect(tx, ty, TILE, TILE, 3);
      ctx.fill();
      ctx.fillStyle = t.inkSoft;
      ctx.font = `bold ${Math.round(TILE * 0.26)}px system-ui, sans-serif`;
      ctx.textAlign = 'center';
      ctx.textBaseline = 'middle';
      ctx.fillText(lbl, tx + TILE / 2, ty + TILE / 2);
    });

    // f-block row labels
    ctx.fillStyle = t.inkSoft;
    ctx.font = '11px system-ui, sans-serif';
    ctx.textAlign = 'right';
    ctx.textBaseline = 'middle';
    ctx.fillText('Ln', LEFT_PAD + 2 * STEP - 5, F_Y + TILE / 2);
    ctx.fillText('An', LEFT_PAD + 2 * STEP - 5, F_Y + STEP + TILE / 2);

    // Colorbar — gradient from seq[0] (#009E73) to seq[1] (#4467A3)
    const cbX = LEFT_PAD;
    const cbW = TABLE_W;
    const grad = ctx.createLinearGradient(cbX, 0, cbX + cbW, 0);
    grad.addColorStop(0, t.seq[0]);
    grad.addColorStop(1, t.seq[1]);
    ctx.fillStyle = grad;
    ctx.fillRect(cbX, CB_Y, cbW, 16);

    // Colorbar tick lines
    const ticks = [0, 0.25, 0.5, 0.75, 1.0];
    ctx.strokeStyle = t.pageBg;
    ctx.lineWidth = 1;
    ticks.forEach(u => {
      const tx2 = cbX + u * cbW;
      ctx.beginPath();
      ctx.moveTo(tx2, CB_Y);
      ctx.lineTo(tx2, CB_Y + 16);
      ctx.stroke();
    });

    // Colorbar labels
    ctx.fillStyle = t.inkSoft;
    ctx.font = '12px system-ui, sans-serif';
    ctx.textBaseline = 'top';

    ctx.textAlign = 'left';
    ctx.fillText(`${MIN_EN.toFixed(2)} (Fr)`, cbX, CB_Y + 20);

    ctx.textAlign = 'center';
    ctx.fillText('Electronegativity (Pauling Scale)', cbX + cbW / 2, CB_Y + 20);

    ctx.textAlign = 'right';
    ctx.fillText(`${MAX_EN.toFixed(2)} (F)`, cbX + cbW, CB_Y + 20);

    ctx.restore();
  },
};

// --- Mount ---
const canvas = document.createElement('canvas');
document.getElementById('container').appendChild(canvas);

// --- Chart (periodic table rendered entirely via plugin; Chart.js provides the canvas) ---
new Chart(canvas, {
  type: 'scatter',
  data: { datasets: [] },
  options: {
    responsive: true,
    maintainAspectRatio: false,
    animation: false,
    layout: { padding: 0 },
    plugins: {
      legend: { display: false },
      tooltip: { enabled: false },
    },
    scales: {
      x: { display: false },
      y: { display: false },
    },
  },
  plugins: [periodicPlugin],
});
Runnable source as JSON, for any HTTP client: https://api.anyplot.ai/specs/heatmap-periodic-table/chartjs/code. Any spec id and library id listed in llms-full.txt fit the same URL shape; every URL below is complete and callable.
{
  "spec_id": "heatmap-periodic-table",
  "language": "javascript",
  "library": "chartjs",
  "page": "https://anyplot.ai/heatmap-periodic-table/javascript/chartjs",
  "hub": "https://anyplot.ai/heatmap-periodic-table",
  "code_json": "https://api.anyplot.ai/specs/heatmap-periodic-table/chartjs/code",
  "spec_json": "https://api.anyplot.ai/specs/heatmap-periodic-table",
  "render_light_png": "https://storage.googleapis.com/anyplot-images/plots/heatmap-periodic-table/javascript/chartjs/plot-light.png",
  "render_dark_png": "https://storage.googleapis.com/anyplot-images/plots/heatmap-periodic-table/javascript/chartjs/plot-dark.png",
  "interactive_light_html": "https://storage.googleapis.com/anyplot-images/plots/heatmap-periodic-table/javascript/chartjs/plot-light.html",
  "interactive_dark_html": "https://storage.googleapis.com/anyplot-images/plots/heatmap-periodic-table/javascript/chartjs/plot-dark.html",
  "quality_score": 90.0,
  "license": "MIT",
  "guide": "https://anyplot.ai/llms.txt"
}
Part of Periodic Table Property Heatmap on anyplot.ai.