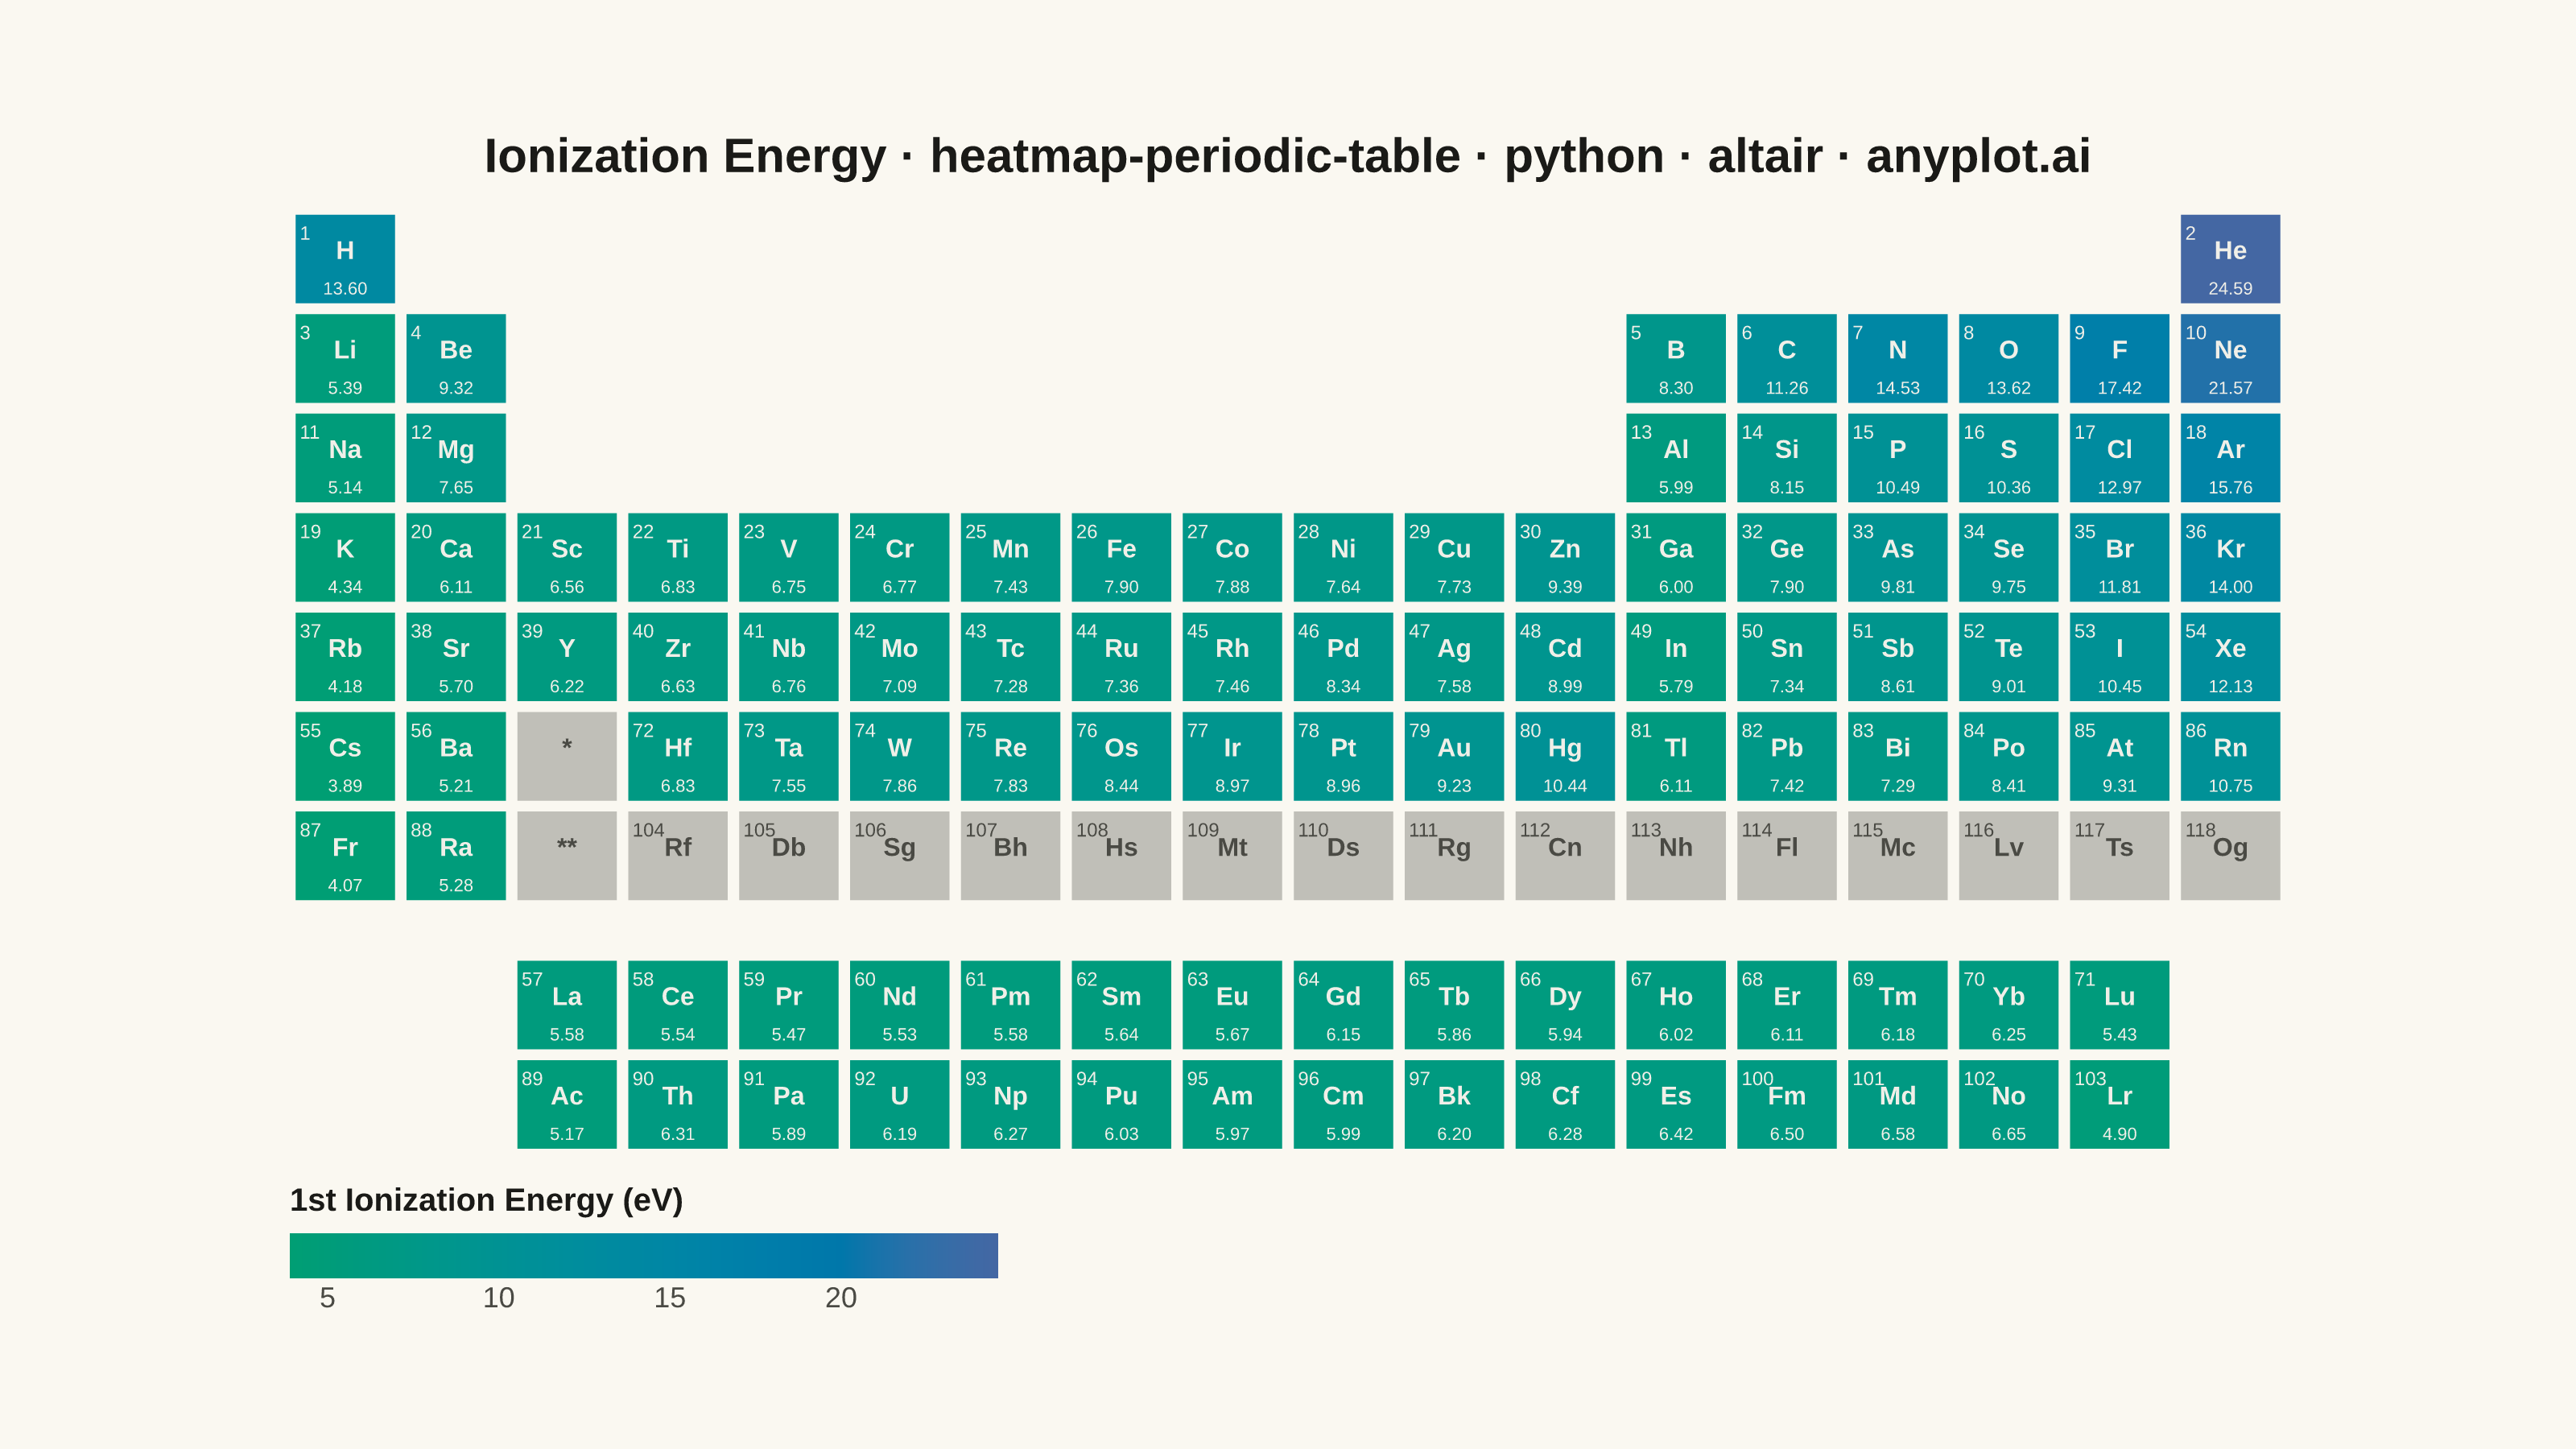
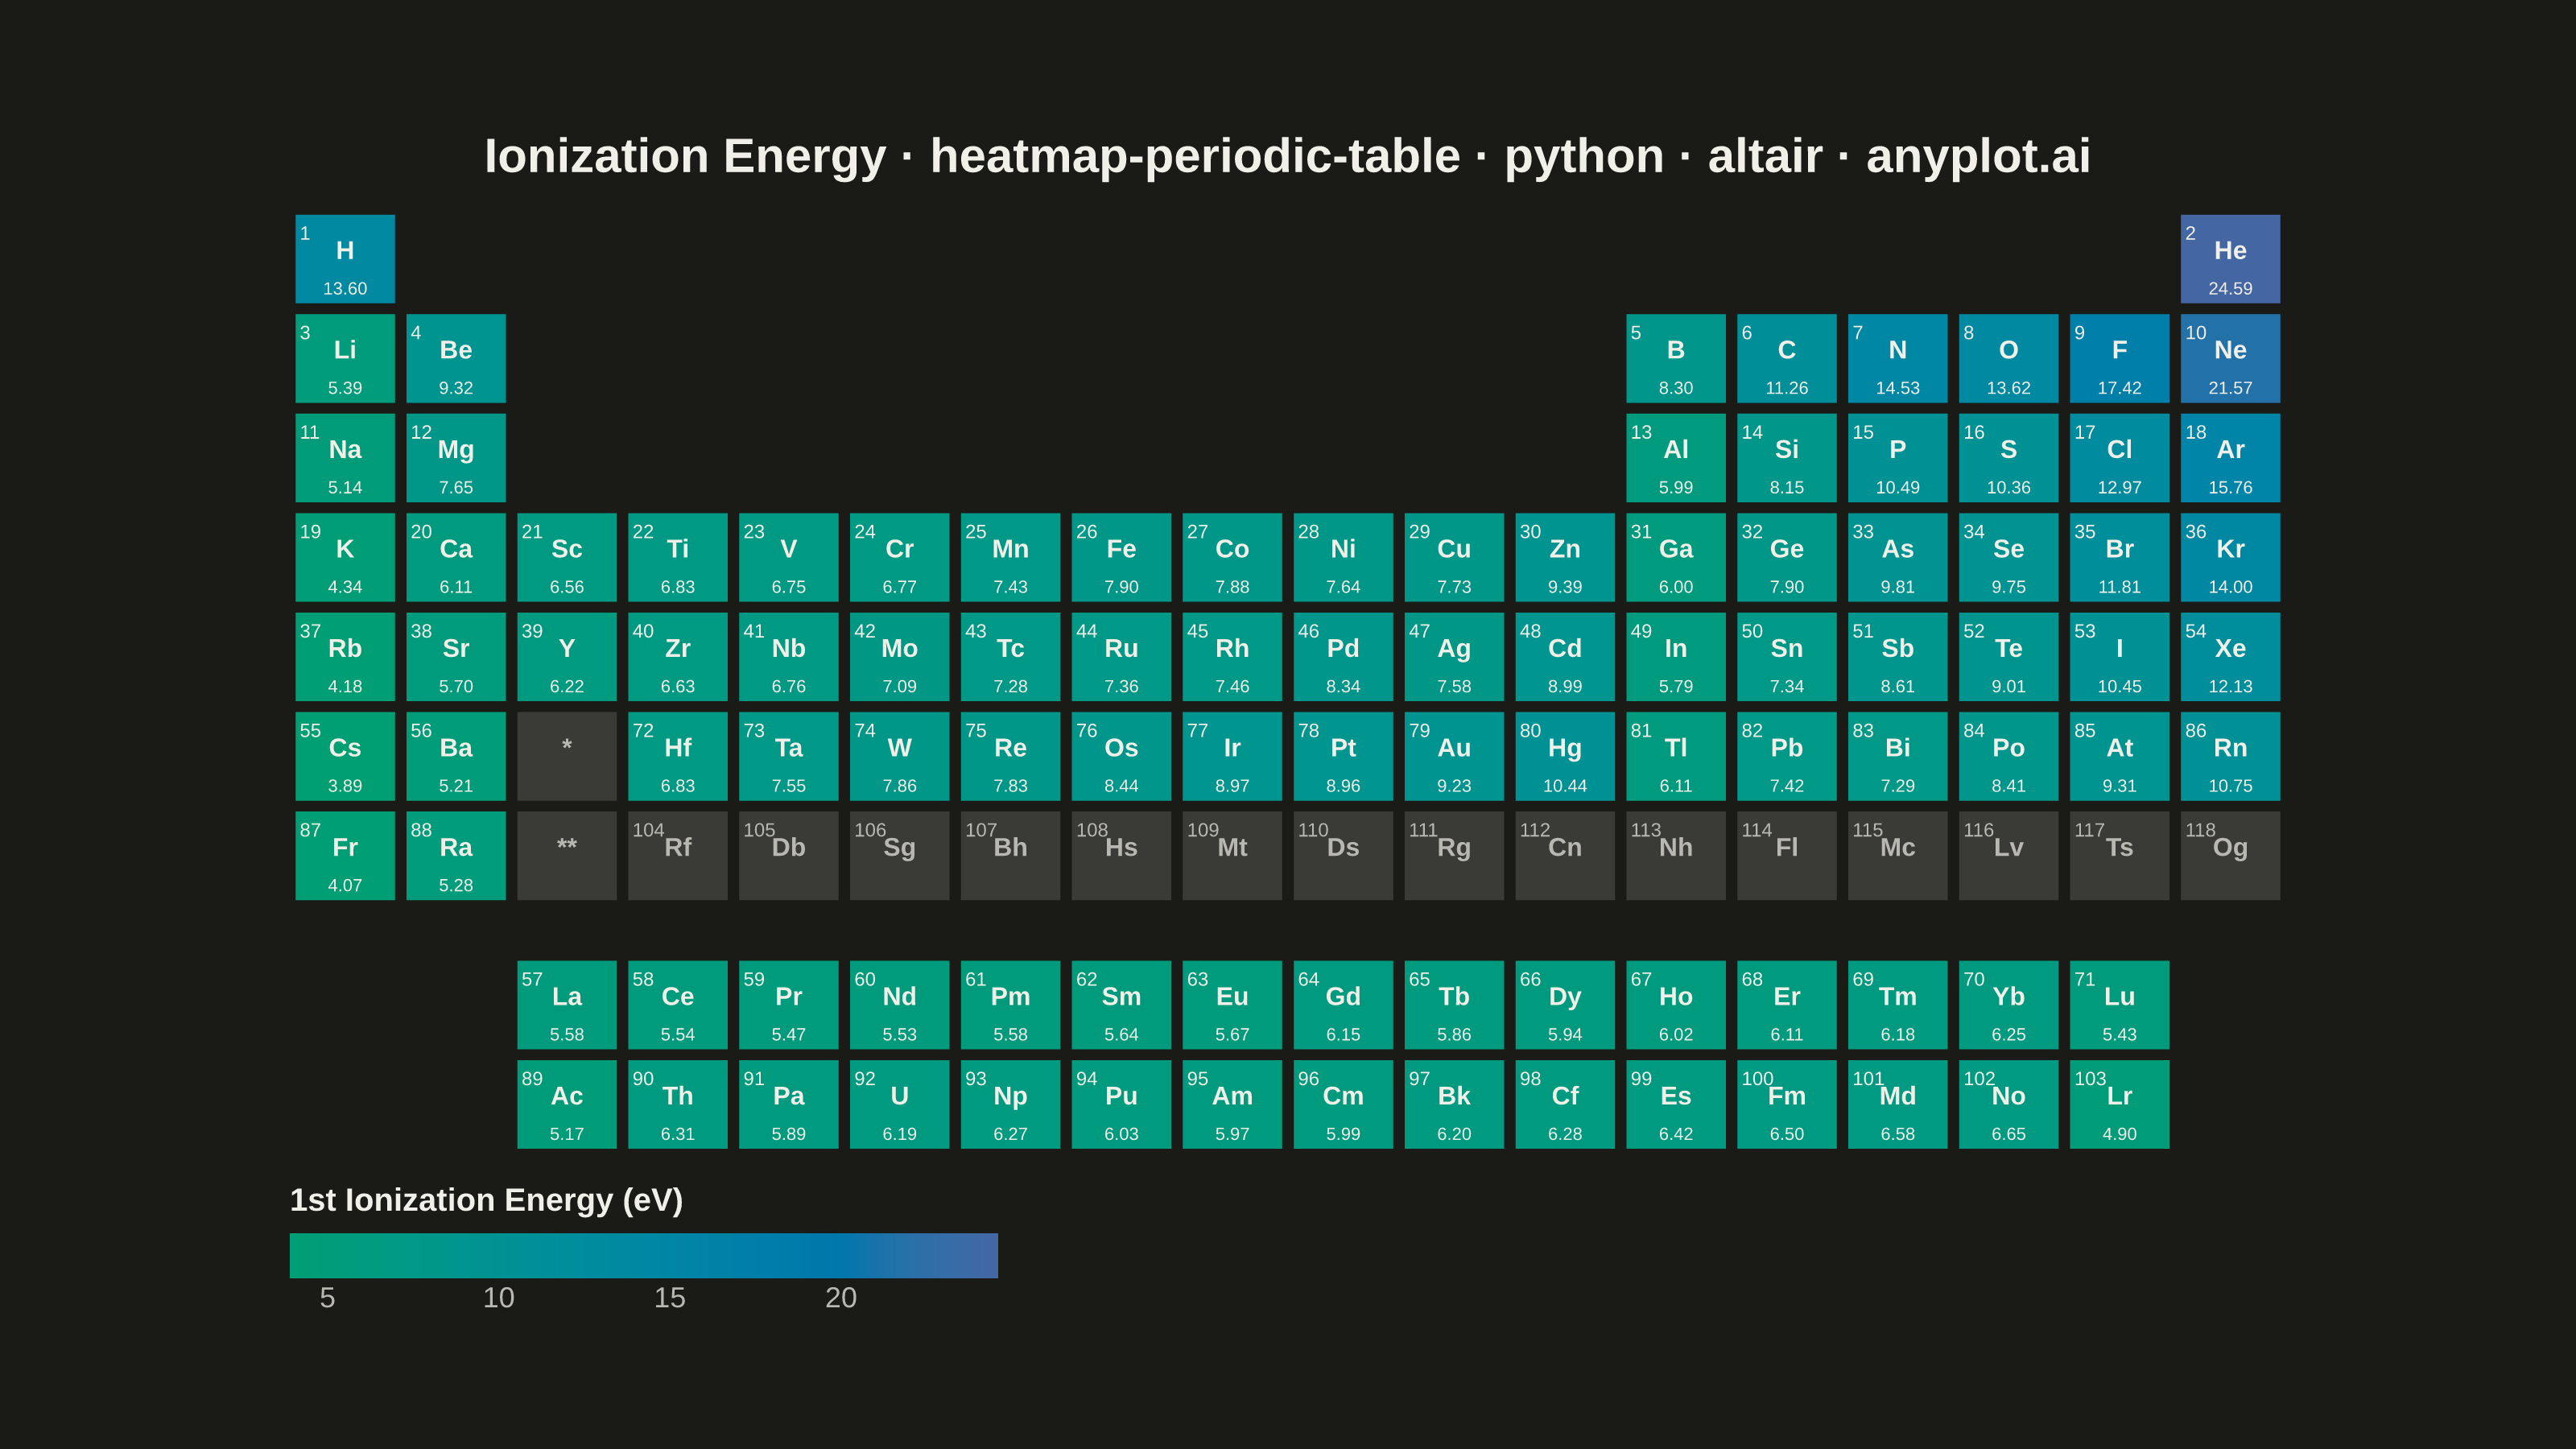
A periodic table of the elements rendered in its canonical layout — 18 groups across by 7 periods down, with the lanthanide and actinide series detached as two separate rows below — where each element tile is colored by a continuous property such as electronegativity, atomic radius, melting point, or first ionization energy. A colorbar maps tile color to property value, and every tile carries the element symbol and atomic number, optionally with the numeric property value. This visualization fuses an immediately recognizable fixed grid with heatmap encoding, turning a familiar reference chart into a tool for spotting periodic trends at a glance.
""" anyplot.ai
heatmap-periodic-table: Periodic Table Property Heatmap
Library: altair 6.2.1 | Python 3.13.13
Quality: 89/100 | Created: 2026-06-15
"""

import os
import sys


# Remove script directory from sys.path to avoid importing local altair.py
_script_dir = os.path.dirname(os.path.abspath(__file__))
if _script_dir in sys.path:
    sys.path.remove(_script_dir)
sys.path[:] = [p for p in sys.path if os.path.abspath(p or ".") != _script_dir]

import altair as alt
import numpy as np
import pandas as pd
from PIL import Image


# Theme tokens — Imprint palette, theme-adaptive chrome
THEME = os.getenv("ANYPLOT_THEME", "light")
PAGE_BG = "#FAF8F1" if THEME == "light" else "#1A1A17"
ELEVATED_BG = "#FFFDF6" if THEME == "light" else "#242420"
INK = "#1A1A17" if THEME == "light" else "#F0EFE8"
INK_SOFT = "#4A4A44" if THEME == "light" else "#B8B7B0"
# Null tile: greyed element with no measured value
TILE_NULL = "#C0BFB8" if THEME == "light" else "#3A3A37"
# Text on colored tiles: near-white readable against both Imprint green and blue
TEXT_ON_TILE = "#F0EFE8"

# Imprint sequential colormap for continuous data (single-polarity IE values)
CMAP_LOW = "#009E73"  # Imprint position 1 — low ionization energy
CMAP_HIGH = "#4467A3"  # Imprint position 3 — high ionization energy

# --- Element data: (symbol, atomic_number, group, display_period, ie_ev) ---
# display_period 1-7 = main table; 8.5 = lanthanide row; 9.5 = actinide row
# None for ie_ev = element has no well-measured first IE (superheavy elements)
elements_data = [
    # Period 1
    ("H", 1, 1, 1, 13.598),
    ("He", 2, 18, 1, 24.587),
    # Period 2
    ("Li", 3, 1, 2, 5.392),
    ("Be", 4, 2, 2, 9.322),
    ("B", 5, 13, 2, 8.298),
    ("C", 6, 14, 2, 11.260),
    ("N", 7, 15, 2, 14.534),
    ("O", 8, 16, 2, 13.618),
    ("F", 9, 17, 2, 17.422),
    ("Ne", 10, 18, 2, 21.565),
    # Period 3
    ("Na", 11, 1, 3, 5.139),
    ("Mg", 12, 2, 3, 7.646),
    ("Al", 13, 13, 3, 5.986),
    ("Si", 14, 14, 3, 8.151),
    ("P", 15, 15, 3, 10.486),
    ("S", 16, 16, 3, 10.360),
    ("Cl", 17, 17, 3, 12.968),
    ("Ar", 18, 18, 3, 15.760),
    # Period 4
    ("K", 19, 1, 4, 4.341),
    ("Ca", 20, 2, 4, 6.113),
    ("Sc", 21, 3, 4, 6.561),
    ("Ti", 22, 4, 4, 6.828),
    ("V", 23, 5, 4, 6.746),
    ("Cr", 24, 6, 4, 6.767),
    ("Mn", 25, 7, 4, 7.434),
    ("Fe", 26, 8, 4, 7.902),
    ("Co", 27, 9, 4, 7.881),
    ("Ni", 28, 10, 4, 7.640),
    ("Cu", 29, 11, 4, 7.726),
    ("Zn", 30, 12, 4, 9.394),
    ("Ga", 31, 13, 4, 5.999),
    ("Ge", 32, 14, 4, 7.899),
    ("As", 33, 15, 4, 9.815),
    ("Se", 34, 16, 4, 9.752),
    ("Br", 35, 17, 4, 11.814),
    ("Kr", 36, 18, 4, 14.000),
    # Period 5
    ("Rb", 37, 1, 5, 4.177),
    ("Sr", 38, 2, 5, 5.695),
    ("Y", 39, 3, 5, 6.217),
    ("Zr", 40, 4, 5, 6.634),
    ("Nb", 41, 5, 5, 6.759),
    ("Mo", 42, 6, 5, 7.092),
    ("Tc", 43, 7, 5, 7.280),
    ("Ru", 44, 8, 5, 7.361),
    ("Rh", 45, 9, 5, 7.459),
    ("Pd", 46, 10, 5, 8.337),
    ("Ag", 47, 11, 5, 7.576),
    ("Cd", 48, 12, 5, 8.994),
    ("In", 49, 13, 5, 5.786),
    ("Sn", 50, 14, 5, 7.344),
    ("Sb", 51, 15, 5, 8.608),
    ("Te", 52, 16, 5, 9.010),
    ("I", 53, 17, 5, 10.451),
    ("Xe", 54, 18, 5, 12.130),
    # Period 6 main block (La-Lu pulled into f-block row)
    ("Cs", 55, 1, 6, 3.894),
    ("Ba", 56, 2, 6, 5.212),
    # group 3 → placeholder (*) added separately
    ("Hf", 72, 4, 6, 6.825),
    ("Ta", 73, 5, 6, 7.549),
    ("W", 74, 6, 6, 7.864),
    ("Re", 75, 7, 6, 7.833),
    ("Os", 76, 8, 6, 8.438),
    ("Ir", 77, 9, 6, 8.967),
    ("Pt", 78, 10, 6, 8.959),
    ("Au", 79, 11, 6, 9.226),
    ("Hg", 80, 12, 6, 10.438),
    ("Tl", 81, 13, 6, 6.108),
    ("Pb", 82, 14, 6, 7.417),
    ("Bi", 83, 15, 6, 7.286),
    ("Po", 84, 16, 6, 8.414),
    ("At", 85, 17, 6, 9.310),
    ("Rn", 86, 18, 6, 10.748),
    # Period 7 main block (Ac-Lr pulled into f-block row)
    ("Fr", 87, 1, 7, 4.073),
    ("Ra", 88, 2, 7, 5.279),
    # group 3 → placeholder (**) added separately
    ("Rf", 104, 4, 7, None),
    ("Db", 105, 5, 7, None),
    ("Sg", 106, 6, 7, None),
    ("Bh", 107, 7, 7, None),
    ("Hs", 108, 8, 7, None),
    ("Mt", 109, 9, 7, None),
    ("Ds", 110, 10, 7, None),
    ("Rg", 111, 11, 7, None),
    ("Cn", 112, 12, 7, None),
    ("Nh", 113, 13, 7, None),
    ("Fl", 114, 14, 7, None),
    ("Mc", 115, 15, 7, None),
    ("Lv", 116, 16, 7, None),
    ("Ts", 117, 17, 7, None),
    ("Og", 118, 18, 7, None),
    # Lanthanides — f-block row 1 (display_period=8.5, groups 3-17)
    ("La", 57, 3, 8.5, 5.577),
    ("Ce", 58, 4, 8.5, 5.539),
    ("Pr", 59, 5, 8.5, 5.473),
    ("Nd", 60, 6, 8.5, 5.525),
    ("Pm", 61, 7, 8.5, 5.582),
    ("Sm", 62, 8, 8.5, 5.644),
    ("Eu", 63, 9, 8.5, 5.670),
    ("Gd", 64, 10, 8.5, 6.150),
    ("Tb", 65, 11, 8.5, 5.864),
    ("Dy", 66, 12, 8.5, 5.939),
    ("Ho", 67, 13, 8.5, 6.022),
    ("Er", 68, 14, 8.5, 6.108),
    ("Tm", 69, 15, 8.5, 6.184),
    ("Yb", 70, 16, 8.5, 6.254),
    ("Lu", 71, 17, 8.5, 5.426),
    # Actinides — f-block row 2 (display_period=9.5, groups 3-17)
    ("Ac", 89, 3, 9.5, 5.170),
    ("Th", 90, 4, 9.5, 6.308),
    ("Pa", 91, 5, 9.5, 5.890),
    ("U", 92, 6, 9.5, 6.194),
    ("Np", 93, 7, 9.5, 6.266),
    ("Pu", 94, 8, 9.5, 6.026),
    ("Am", 95, 9, 9.5, 5.974),
    ("Cm", 96, 10, 9.5, 5.991),
    ("Bk", 97, 11, 9.5, 6.198),
    ("Cf", 98, 12, 9.5, 6.282),
    ("Es", 99, 13, 9.5, 6.420),
    ("Fm", 100, 14, 9.5, 6.500),
    ("Md", 101, 15, 9.5, 6.580),
    ("No", 102, 16, 9.5, 6.650),
    ("Lr", 103, 17, 9.5, 4.900),
    # Placeholder tiles for La-Lu / Ac-Lr gaps in the main table
    ("*", None, 3, 6, None),
    ("**", None, 3, 7, None),
]

# Build DataFrame
df = pd.DataFrame(elements_data, columns=["symbol", "atomic_number", "group", "display_period", "value"])

# Tile boundary columns (0.47 half-width leaves a small gap between tiles)
HALF = 0.47
df["x1"] = df["group"] - HALF
df["x2"] = df["group"] + HALF
df["y1"] = df["display_period"] - HALF
df["y2"] = df["display_period"] + HALF
df["x_center"] = df["group"].astype(float)
df["y_center"] = df["display_period"].astype(float)
# Atomic number left-aligned within tile
df["x_atomnum"] = df["group"] - HALF + 0.06

# Display labels
df["atomic_label"] = df["atomic_number"].apply(lambda v: str(int(v)) if pd.notna(v) else "")
df["value_label"] = df["value"].apply(lambda v: f"{v:.2f}" if pd.notna(v) else "")

# Text color: white-ish on colored tiles, soft ink on null/placeholder tiles
df["text_color"] = np.where(df["value"].notna(), TEXT_ON_TILE, INK_SOFT)

# Tooltip labels
df["tooltip_symbol"] = df["symbol"]
df["tooltip_ie"] = df["value"].apply(lambda v: f"{v:.3f} eV" if pd.notna(v) else "—")

df_null = df[df["value"].isna()].copy()
df_valid = df[df["value"].notna()].copy()

# Title with length-scaled font
title_str = "Ionization Energy · heatmap-periodic-table · python · altair · anyplot.ai"
n = len(title_str)
title_fontsize = round(16 * 67 / n) if n > 67 else 16  # = 14

# Shared axis scales — y reversed so period 1 is at the top
x_scale = alt.Scale(domain=[0.5, 18.5])
y_scale = alt.Scale(domain=[10.05, 0.5])  # reversed: large period → bottom

# Null / placeholder tiles (grey)
null_rects = (
    alt.Chart(df_null)
    .mark_rect(stroke=PAGE_BG, strokeWidth=1.5)
    .encode(
        x=alt.X("x1:Q", scale=x_scale, axis=None),
        x2="x2:Q",
        y=alt.Y("y1:Q", scale=y_scale, axis=None),
        y2="y2:Q",
        color=alt.value(TILE_NULL),
        tooltip=[alt.Tooltip("symbol:N", title="Symbol"), alt.Tooltip("tooltip_ie:N", title="IE")],
    )
)

# Valid tiles colored by first ionization energy (Imprint sequential)
valid_rects = (
    alt.Chart(df_valid)
    .mark_rect(stroke=PAGE_BG, strokeWidth=1.5)
    .encode(
        x=alt.X("x1:Q", scale=x_scale, axis=None),
        x2="x2:Q",
        y=alt.Y("y1:Q", scale=y_scale, axis=None),
        y2="y2:Q",
        color=alt.Color(
            "value:Q",
            scale=alt.Scale(range=[CMAP_LOW, CMAP_HIGH], nice=False),
            legend=alt.Legend(
                title="1st Ionization Energy (eV)",
                orient="bottom",
                direction="horizontal",
                gradientLength=220,
                gradientThickness=14,
                titleFontSize=10,
                labelFontSize=9,
                titleColor=INK,
                labelColor=INK_SOFT,
                offset=8,
            ),
        ),
        tooltip=[
            alt.Tooltip("symbol:N", title="Symbol"),
            alt.Tooltip("atomic_number:Q", title="Atomic #", format="d"),
            alt.Tooltip("tooltip_ie:N", title="IE"),
        ],
    )
)

# Atomic number — small text, top-left of each tile
atomic_text = (
    alt.Chart(df)
    .mark_text(align="left", baseline="top", fontSize=6, dy=-11)
    .encode(
        x=alt.X("x_atomnum:Q", scale=x_scale, axis=None),
        y=alt.Y("y_center:Q", scale=y_scale, axis=None),
        text="atomic_label:N",
        color=alt.Color("text_color:N", scale=None, legend=None),
    )
)

# Element symbol — bold, centered in tile
symbol_text = (
    alt.Chart(df)
    .mark_text(align="center", baseline="middle", fontSize=8, fontWeight="bold", dy=-2)
    .encode(
        x=alt.X("x_center:Q", scale=x_scale, axis=None),
        y=alt.Y("y_center:Q", scale=y_scale, axis=None),
        text="symbol:N",
        color=alt.Color("text_color:N", scale=None, legend=None),
    )
)

# IE value — small text at bottom of colored tiles
value_text = (
    alt.Chart(df_valid)
    .mark_text(align="center", baseline="bottom", fontSize=5.5, dy=12)
    .encode(
        x=alt.X("x_center:Q", scale=x_scale, axis=None),
        y=alt.Y("y_center:Q", scale=y_scale, axis=None),
        text="value_label:N",
        color=alt.value(TEXT_ON_TILE),
    )
)

# Compose all layers
chart = (
    alt.layer(null_rects, valid_rects, atomic_text, symbol_text, value_text)
    .properties(
        width=620,
        height=295,
        background=PAGE_BG,
        padding={"left": 0, "right": 0, "top": 0, "bottom": 0},
        title=alt.Title(title_str, fontSize=title_fontsize, color=INK, offset=8),
    )
    .configure_view(continuousWidth=620, continuousHeight=295, fill=PAGE_BG, stroke="transparent")
    .configure_legend(fillColor="transparent", strokeColor="transparent")
)

# Save PNG and HTML
chart.save(f"plot-{THEME}.png", scale_factor=4.0)
chart.save(f"plot-{THEME}.html")

# Pad PNG to exact 3200×1800 target (vl-convert may land slightly short)
TW, TH = 3200, 1800
_img = Image.open(f"plot-{THEME}.png").convert("RGB")
_w, _h = _img.size
if _w > TW or _h > TH:
    raise SystemExit(
        f"altair vl-convert produced {_w}×{_h}, exceeds target {TW}×{TH}. "
        f"Shrink chart .properties(width=, height=) values and re-render."
    )
if _w < TW or _h < TH:
    _canvas = Image.new("RGB", (TW, TH), PAGE_BG)
    _canvas.paste(_img, ((TW - _w) // 2, (TH - _h) // 2))
    _canvas.save(f"plot-{THEME}.png")
Runnable source as JSON, for any HTTP client: https://api.anyplot.ai/specs/heatmap-periodic-table/altair/code. Any spec id and library id listed in llms-full.txt fit the same URL shape; every URL below is complete and callable.
{
  "spec_id": "heatmap-periodic-table",
  "language": "python",
  "library": "altair",
  "page": "https://anyplot.ai/heatmap-periodic-table/python/altair",
  "hub": "https://anyplot.ai/heatmap-periodic-table",
  "code_json": "https://api.anyplot.ai/specs/heatmap-periodic-table/altair/code",
  "spec_json": "https://api.anyplot.ai/specs/heatmap-periodic-table",
  "render_light_png": "https://storage.googleapis.com/anyplot-images/plots/heatmap-periodic-table/python/altair/plot-light.png",
  "render_dark_png": "https://storage.googleapis.com/anyplot-images/plots/heatmap-periodic-table/python/altair/plot-dark.png",
  "interactive_light_html": "https://storage.googleapis.com/anyplot-images/plots/heatmap-periodic-table/python/altair/plot-light.html",
  "interactive_dark_html": "https://storage.googleapis.com/anyplot-images/plots/heatmap-periodic-table/python/altair/plot-dark.html",
  "quality_score": 89.0,
  "license": "MIT",
  "guide": "https://anyplot.ai/llms.txt"
}
Part of Periodic Table Property Heatmap on anyplot.ai.