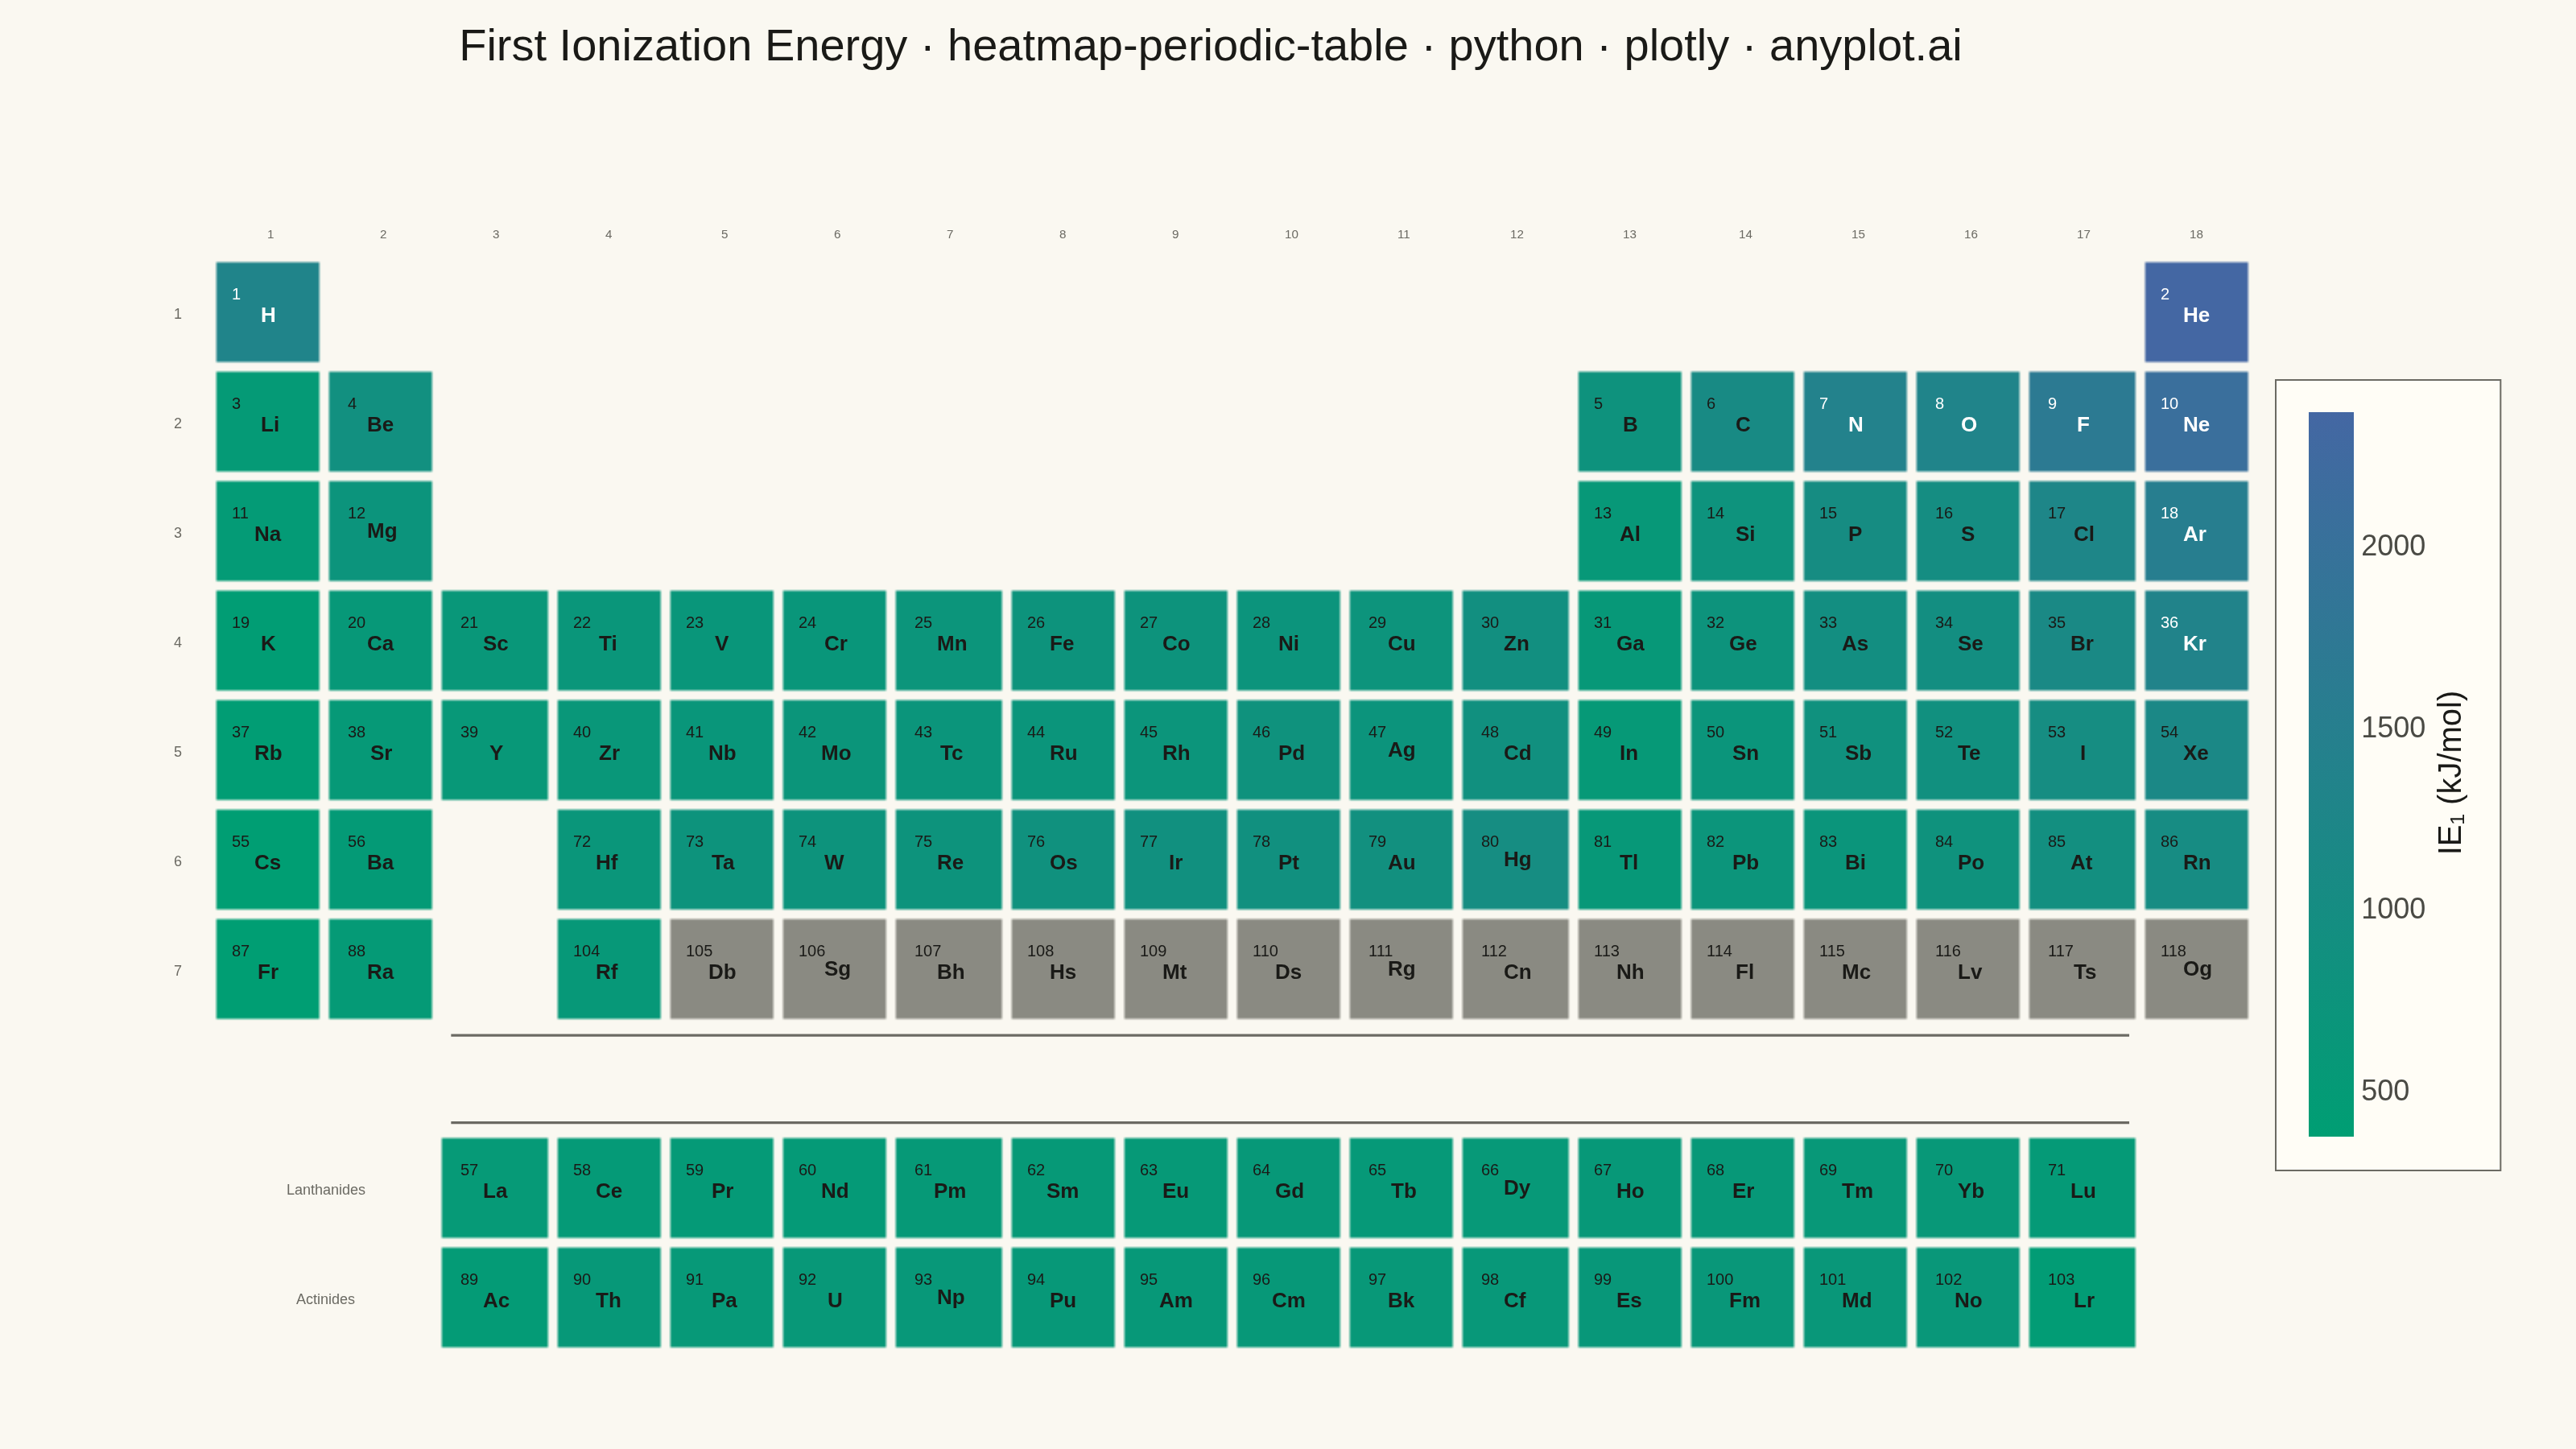
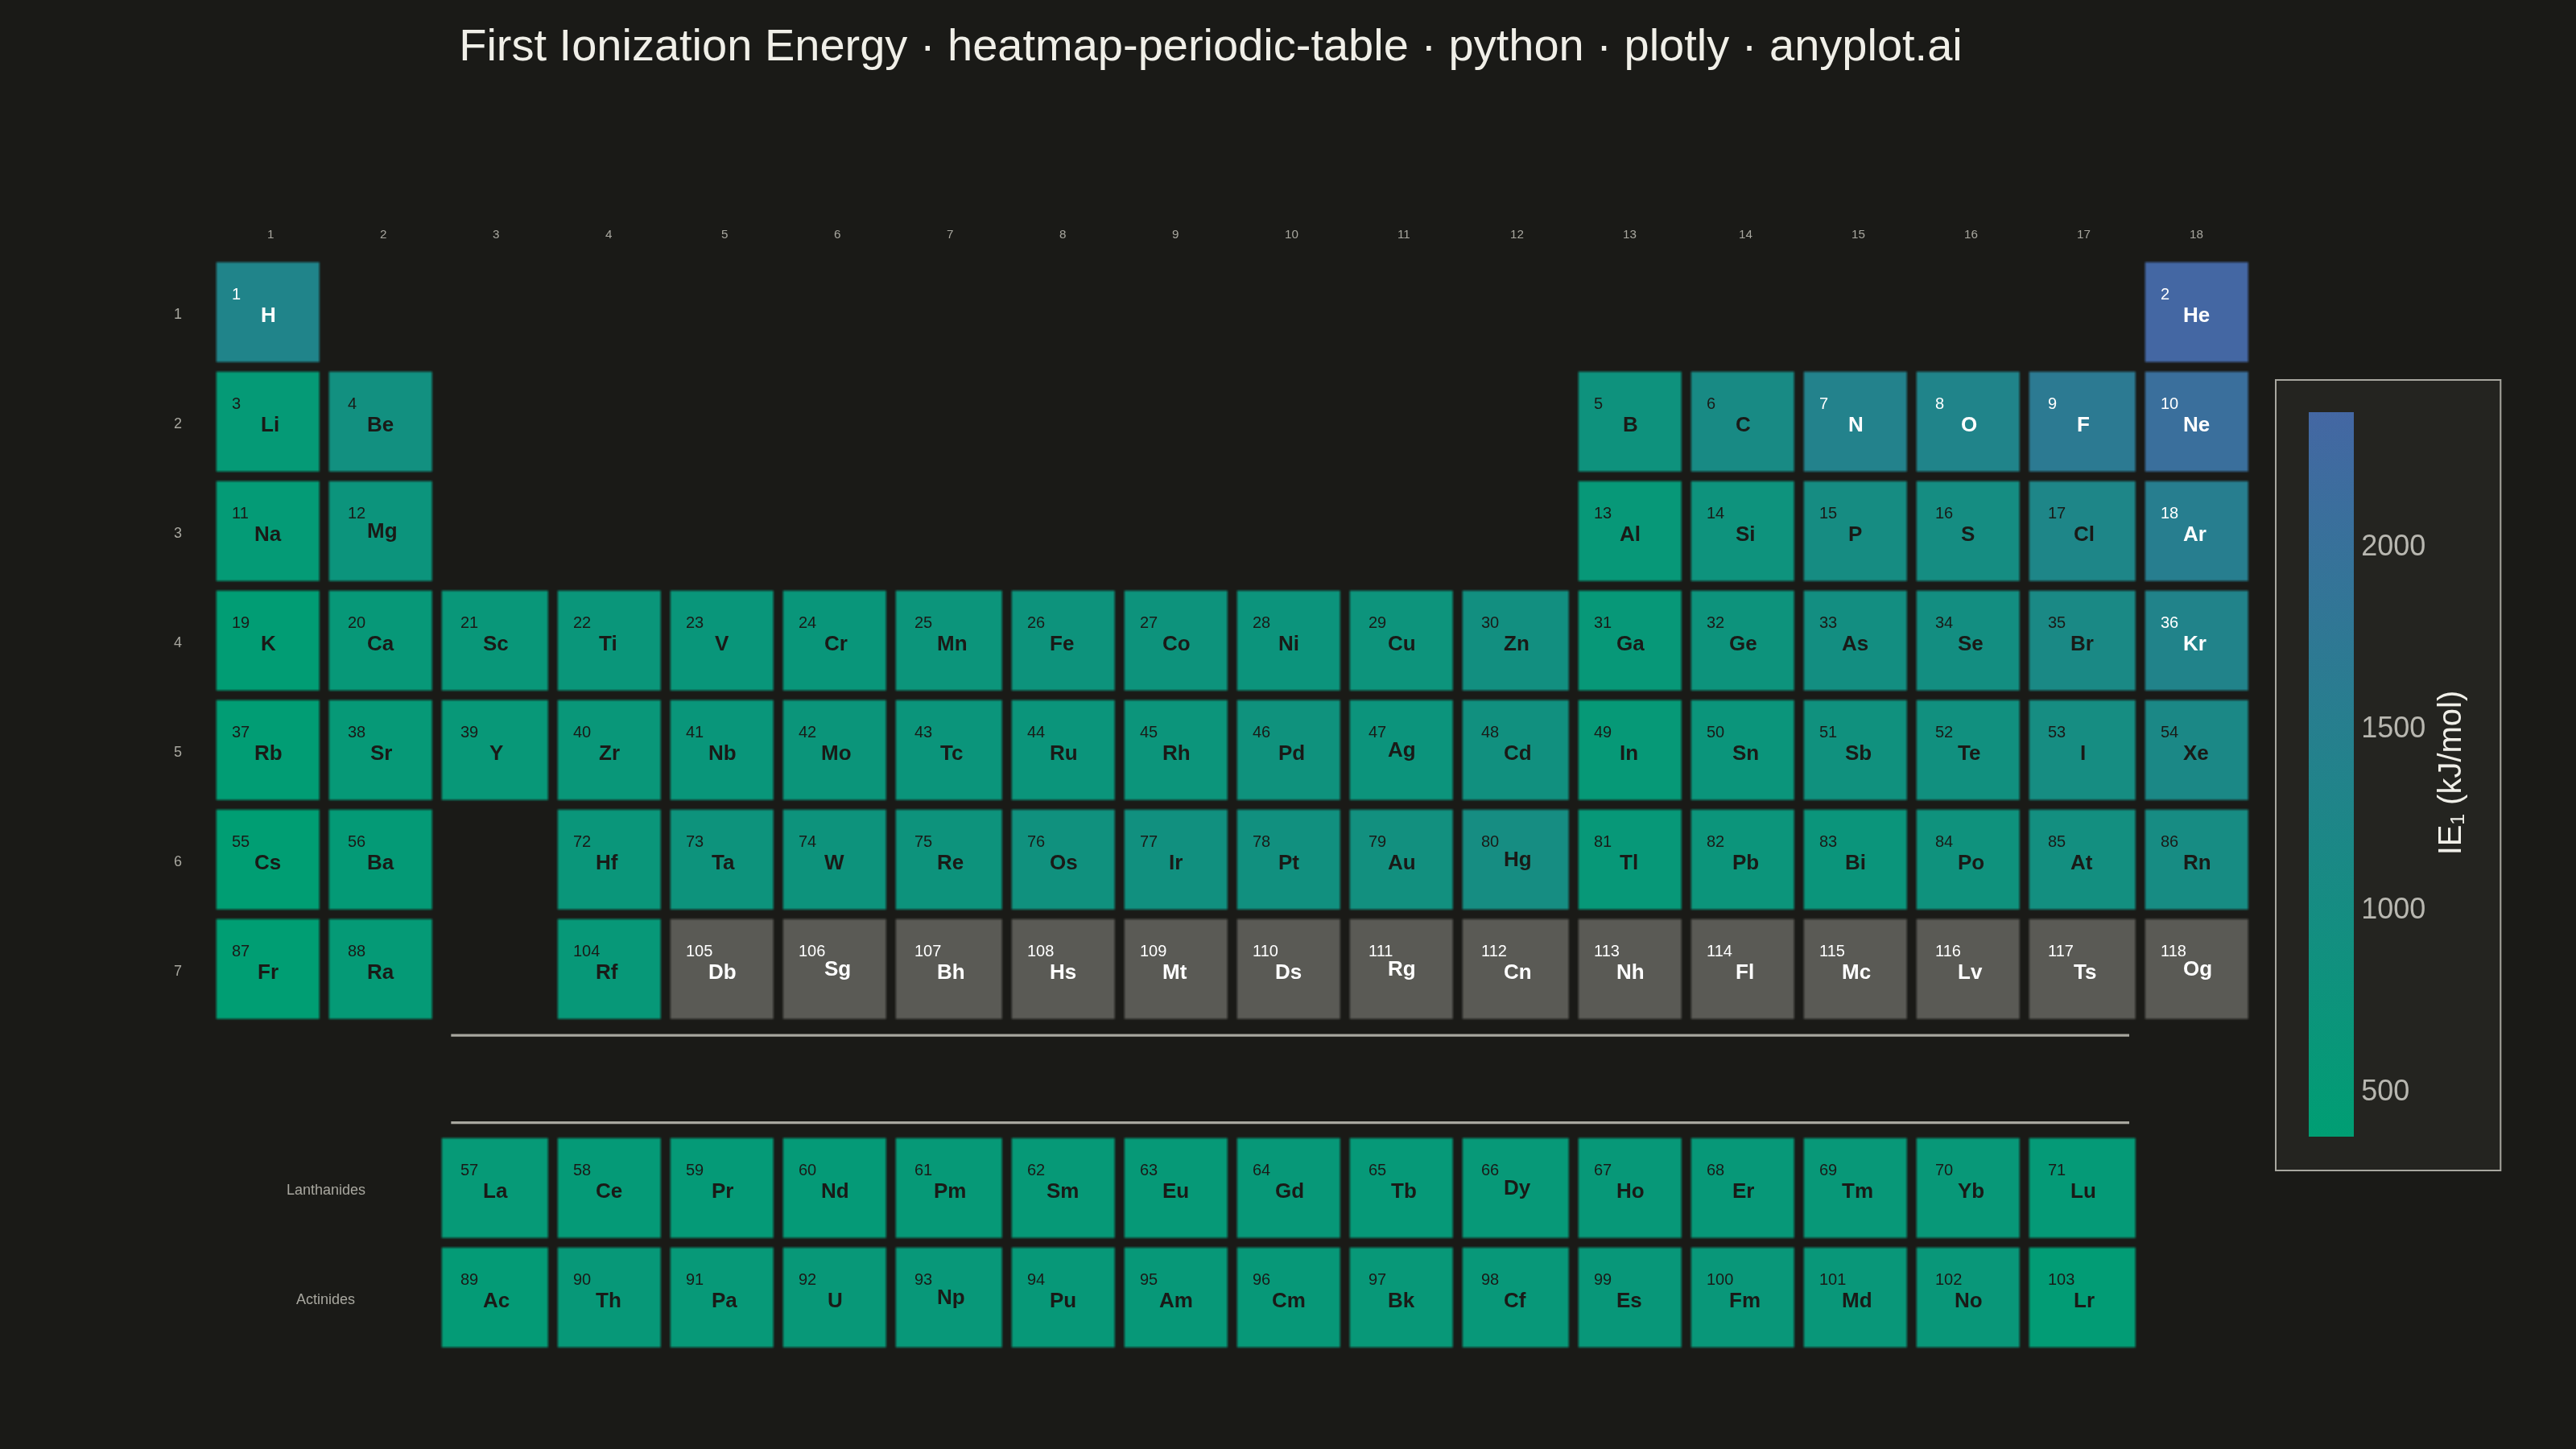
A periodic table of the elements rendered in its canonical layout — 18 groups across by 7 periods down, with the lanthanide and actinide series detached as two separate rows below — where each element tile is colored by a continuous property such as electronegativity, atomic radius, melting point, or first ionization energy. A colorbar maps tile color to property value, and every tile carries the element symbol and atomic number, optionally with the numeric property value. This visualization fuses an immediately recognizable fixed grid with heatmap encoding, turning a familiar reference chart into a tool for spotting periodic trends at a glance.
""" anyplot.ai
heatmap-periodic-table: Periodic Table Property Heatmap
Library: plotly 6.8.0 | Python 3.13.13
Quality: 85/100 | Created: 2026-06-15
"""

import os
import sys


# Remove the script's own directory from sys.path to prevent self-import of
# 'plotly' (this file is named plotly.py, which shadows the installed package).
_script_dir = os.path.dirname(os.path.abspath(__file__))
sys.path = [p for p in sys.path if p not in ("", _script_dir)]

import numpy as np
import plotly.graph_objects as go


# Theme tokens
THEME = os.getenv("ANYPLOT_THEME", "light")
PAGE_BG = "#FAF8F1" if THEME == "light" else "#1A1A17"
ELEVATED_BG = "#FFFDF6" if THEME == "light" else "#242420"
INK = "#1A1A17" if THEME == "light" else "#F0EFE8"
INK_SOFT = "#4A4A44" if THEME == "light" else "#B8B7B0"
INK_MUTED = "#6B6A63" if THEME == "light" else "#A8A79F"

# Imprint sequential colormap (single-polarity, green→blue) — for IE1
imprint_seq = [[0.0, "#009E73"], [1.0, "#4467A3"]]
GREY_TILE = "#8A8A82" if THEME == "light" else "#5A5A55"
# Grey tile luminance: light #8A8A82 ≈ 0.272 (use dark text), dark #5A5A55 ≈ 0.117 (use white)
GREY_TEXT = "#1A1A17" if THEME == "light" else "#FFFFFF"

# Element data: (Z, symbol, x_grid 0-17, y_grid 0-9, ie1_kJ_mol or None)
# y=0-6: periods 1-7; y=7: visual gap row; y=8: lanthanides; y=9: actinides
ELEMENTS = [
    # Period 1
    (1, "H", 0, 0, 1312.0),
    (2, "He", 17, 0, 2372.3),
    # Period 2
    (3, "Li", 0, 1, 520.2),
    (4, "Be", 1, 1, 899.5),
    (5, "B", 12, 1, 800.6),
    (6, "C", 13, 1, 1086.5),
    (7, "N", 14, 1, 1402.3),
    (8, "O", 15, 1, 1313.9),
    (9, "F", 16, 1, 1681.0),
    (10, "Ne", 17, 1, 2080.7),
    # Period 3
    (11, "Na", 0, 2, 495.8),
    (12, "Mg", 1, 2, 737.7),
    (13, "Al", 12, 2, 577.5),
    (14, "Si", 13, 2, 786.5),
    (15, "P", 14, 2, 1011.8),
    (16, "S", 15, 2, 999.6),
    (17, "Cl", 16, 2, 1251.2),
    (18, "Ar", 17, 2, 1520.6),
    # Period 4
    (19, "K", 0, 3, 418.8),
    (20, "Ca", 1, 3, 589.8),
    (21, "Sc", 2, 3, 633.1),
    (22, "Ti", 3, 3, 658.8),
    (23, "V", 4, 3, 650.9),
    (24, "Cr", 5, 3, 652.9),
    (25, "Mn", 6, 3, 717.3),
    (26, "Fe", 7, 3, 762.5),
    (27, "Co", 8, 3, 760.4),
    (28, "Ni", 9, 3, 737.1),
    (29, "Cu", 10, 3, 745.5),
    (30, "Zn", 11, 3, 906.4),
    (31, "Ga", 12, 3, 578.8),
    (32, "Ge", 13, 3, 762.0),
    (33, "As", 14, 3, 947.0),
    (34, "Se", 15, 3, 941.0),
    (35, "Br", 16, 3, 1139.9),
    (36, "Kr", 17, 3, 1350.8),
    # Period 5
    (37, "Rb", 0, 4, 403.0),
    (38, "Sr", 1, 4, 549.5),
    (39, "Y", 2, 4, 600.0),
    (40, "Zr", 3, 4, 640.1),
    (41, "Nb", 4, 4, 652.1),
    (42, "Mo", 5, 4, 684.3),
    (43, "Tc", 6, 4, 702.0),
    (44, "Ru", 7, 4, 710.2),
    (45, "Rh", 8, 4, 719.7),
    (46, "Pd", 9, 4, 804.4),
    (47, "Ag", 10, 4, 731.0),
    (48, "Cd", 11, 4, 867.8),
    (49, "In", 12, 4, 558.3),
    (50, "Sn", 13, 4, 708.6),
    (51, "Sb", 14, 4, 834.0),
    (52, "Te", 15, 4, 869.3),
    (53, "I", 16, 4, 1008.4),
    (54, "Xe", 17, 4, 1170.4),
    # Period 6 — f-block gap at x=2; La-Lu in lanthanide row (y=8)
    (55, "Cs", 0, 5, 375.7),
    (56, "Ba", 1, 5, 502.9),
    (72, "Hf", 3, 5, 658.5),
    (73, "Ta", 4, 5, 761.0),
    (74, "W", 5, 5, 770.0),
    (75, "Re", 6, 5, 760.0),
    (76, "Os", 7, 5, 840.0),
    (77, "Ir", 8, 5, 880.0),
    (78, "Pt", 9, 5, 870.0),
    (79, "Au", 10, 5, 890.1),
    (80, "Hg", 11, 5, 1007.1),
    (81, "Tl", 12, 5, 589.4),
    (82, "Pb", 13, 5, 715.6),
    (83, "Bi", 14, 5, 703.0),
    (84, "Po", 15, 5, 812.1),
    (85, "At", 16, 5, 920.0),
    (86, "Rn", 17, 5, 1037.0),
    # Period 7 — f-block gap at x=2; Ac-Lr in actinide row (y=9)
    (87, "Fr", 0, 6, 380.0),
    (88, "Ra", 1, 6, 509.3),
    (104, "Rf", 3, 6, 580.0),
    (105, "Db", 4, 6, None),
    (106, "Sg", 5, 6, None),
    (107, "Bh", 6, 6, None),
    (108, "Hs", 7, 6, None),
    (109, "Mt", 8, 6, None),
    (110, "Ds", 9, 6, None),
    (111, "Rg", 10, 6, None),
    (112, "Cn", 11, 6, None),
    (113, "Nh", 12, 6, None),
    (114, "Fl", 13, 6, None),
    (115, "Mc", 14, 6, None),
    (116, "Lv", 15, 6, None),
    (117, "Ts", 16, 6, None),
    (118, "Og", 17, 6, None),
    # Lanthanides (y=8, x=2 to x=16)
    (57, "La", 2, 8, 538.1),
    (58, "Ce", 3, 8, 534.4),
    (59, "Pr", 4, 8, 527.0),
    (60, "Nd", 5, 8, 533.1),
    (61, "Pm", 6, 8, 540.0),
    (62, "Sm", 7, 8, 544.5),
    (63, "Eu", 8, 8, 547.1),
    (64, "Gd", 9, 8, 593.4),
    (65, "Tb", 10, 8, 565.8),
    (66, "Dy", 11, 8, 573.0),
    (67, "Ho", 12, 8, 581.0),
    (68, "Er", 13, 8, 589.3),
    (69, "Tm", 14, 8, 596.7),
    (70, "Yb", 15, 8, 603.4),
    (71, "Lu", 16, 8, 523.5),
    # Actinides (y=9, x=2 to x=16)
    (89, "Ac", 2, 9, 499.0),
    (90, "Th", 3, 9, 587.0),
    (91, "Pa", 4, 9, 568.0),
    (92, "U", 5, 9, 597.6),
    (93, "Np", 6, 9, 604.5),
    (94, "Pu", 7, 9, 584.7),
    (95, "Am", 8, 9, 578.0),
    (96, "Cm", 9, 9, 581.0),
    (97, "Bk", 10, 9, 601.0),
    (98, "Cf", 11, 9, 608.0),
    (99, "Es", 12, 9, 619.0),
    (100, "Fm", 13, 9, 627.0),
    (101, "Md", 14, 9, 635.0),
    (102, "No", 15, 9, 641.6),
    (103, "Lr", 16, 9, 443.0),
]

# Build 2D value grids (10 rows × 18 cols)
NROWS, NCOLS = 10, 18
z_colored = np.full((NROWS, NCOLS), np.nan)
z_grey = np.full((NROWS, NCOLS), np.nan)

ie1_all = []
for _Z, _sym, xg, yg, ie1 in ELEMENTS:
    if ie1 is not None:
        z_colored[yg, xg] = ie1
        ie1_all.append(ie1)
    else:
        z_grey[yg, xg] = 1.0

ie1_min = min(ie1_all)
ie1_max = max(ie1_all)


def _srgb_lin(c):
    """sRGB channel value (0–255) to linear light."""
    n = c / 255.0
    return n / 12.92 if n <= 0.04045 else ((n + 0.055) / 1.055) ** 2.4


def _tile_text(ie1_val):
    """Return dark or white text color based on imprint_seq tile background luminance."""
    t = (ie1_val - ie1_min) / (ie1_max - ie1_min)
    r, g, b = t * 68, 158 + t * (103 - 158), 115 + t * (163 - 115)
    lum = 0.2126 * _srgb_lin(r) + 0.7152 * _srgb_lin(g) + 0.0722 * _srgb_lin(b)
    # Crossover at lum≈0.19: dark text (#1A1A17) on lighter green tiles,
    # white text (#FFFFFF) on darker blue tiles — theme-independent (data colors are fixed)
    return "#1A1A17" if lum > 0.19 else "#FFFFFF"


# Title with font-size scaled for length
title = "First Ionization Energy · heatmap-periodic-table · python · plotly · anyplot.ai"
n_chars = len(title)
ratio = 67 / n_chars if n_chars > 67 else 1.0
title_fs = max(11, round(16 * ratio))

# Figure
fig = go.Figure()

# Layer 1: grey tiles for elements with no IE1 data
fig.add_trace(
    go.Heatmap(
        z=z_grey,
        colorscale=[[0.0, GREY_TILE], [1.0, GREY_TILE]],
        showscale=False,
        zmin=0,
        zmax=1,
        xgap=3,
        ygap=3,
        hoverinfo="skip",
    )
)

# Layer 2: Imprint-colored tiles for elements with known IE1
fig.add_trace(
    go.Heatmap(
        z=z_colored,
        colorscale=imprint_seq,
        zmin=ie1_min,
        zmax=ie1_max,
        xgap=3,
        ygap=3,
        colorbar={
            "title": {"text": "IE₁ (kJ/mol)", "font": {"size": 10, "color": INK}, "side": "right"},
            "tickfont": {"size": 9, "color": INK_SOFT},
            "tickcolor": INK_SOFT,
            "thickness": 14,
            "len": 0.68,
            "y": 0.5,
            "x": 1.01,
            "bgcolor": ELEVATED_BG,
            "bordercolor": INK_MUTED,
            "borderwidth": 0.5,
        },
        hoverinfo="skip",
    )
)

# Build annotations: period/group orientation labels + element tiles
annotations = []

# Period numbers (1–7) on the left edge — orient readers within the table
for period in range(7):
    annotations.append(
        {
            "x": -0.80,
            "y": period,
            "text": str(period + 1),
            "font": {"size": 4.5, "color": INK_MUTED, "family": "Arial"},
            "showarrow": False,
            "xref": "x",
            "yref": "y",
            "xanchor": "center",
            "yanchor": "middle",
        }
    )

# Group numbers (1–18) along the top edge
for grp in range(18):
    annotations.append(
        {
            "x": grp,
            "y": -0.72,
            "text": str(grp + 1),
            "font": {"size": 3.8, "color": INK_MUTED, "family": "Arial"},
            "showarrow": False,
            "xref": "x",
            "yref": "y",
            "xanchor": "center",
            "yanchor": "middle",
        }
    )

# Element tiles: symbol (centered, bold) + atomic number (top-left corner)
for Z, sym, xg, yg, ie1 in ELEMENTS:
    txt_col = _tile_text(ie1) if ie1 is not None else GREY_TEXT

    # Symbol — centered in tile, bold
    annotations.append(
        {
            "x": xg,
            "y": yg,
            "text": f"<b>{sym}</b>",
            "font": {"size": 6.5, "color": txt_col, "family": "Arial"},
            "showarrow": False,
            "xref": "x",
            "yref": "y",
            "xanchor": "center",
            "yanchor": "middle",
        }
    )

    # Atomic number — top-left corner of tile (raised to 5.0 px for mobile legibility)
    annotations.append(
        {
            "x": xg - 0.38,
            "y": yg - 0.33,
            "text": str(Z),
            "font": {"size": 5.0, "color": txt_col, "family": "Arial"},
            "showarrow": False,
            "xref": "x",
            "yref": "y",
            "xanchor": "left",
            "yanchor": "top",
        }
    )

# Series labels in empty left cells of the f-block rows
annotations.extend(
    [
        {
            "x": 0.5,
            "y": 8,
            "text": "Lanthanides",
            "font": {"size": 4.5, "color": INK_MUTED, "family": "Arial"},
            "showarrow": False,
            "xref": "x",
            "yref": "y",
            "xanchor": "center",
            "yanchor": "middle",
        },
        {
            "x": 0.5,
            "y": 9,
            "text": "Actinides",
            "font": {"size": 4.5, "color": INK_MUTED, "family": "Arial"},
            "showarrow": False,
            "xref": "x",
            "yref": "y",
            "xanchor": "center",
            "yanchor": "middle",
        },
    ]
)

fig.update_layout(
    title={
        "text": title,
        "font": {"size": title_fs, "color": INK},
        "x": 0.47,
        "xanchor": "center",
        "y": 0.98,
        "yanchor": "top",
    },
    paper_bgcolor=PAGE_BG,
    plot_bgcolor=PAGE_BG,
    autosize=False,
    width=800,
    height=450,
    margin={"l": 45, "r": 100, "t": 60, "b": 30},
    xaxis={"showticklabels": False, "showgrid": False, "zeroline": False, "showline": False, "range": [-1.1, 17.5]},
    yaxis={
        "showticklabels": False,
        "showgrid": False,
        "zeroline": False,
        "showline": False,
        "range": [9.5, -1.1],  # extended top for group number row; reversed: period 1 at top
    },
    annotations=annotations,
)

# Thin separator lines framing the f-block gap — makes the separation intentional
for y_sep in [6.6, 7.4]:
    fig.add_shape(
        type="line", x0=1.6, x1=16.4, y0=y_sep, y1=y_sep, line={"color": INK_MUTED, "width": 0.8}, xref="x", yref="y"
    )

# Save
fig.write_image(f"plot-{THEME}.png", width=800, height=450, scale=4)
fig.write_html(f"plot-{THEME}.html", include_plotlyjs="cdn")
Runnable source as JSON, for any HTTP client: https://api.anyplot.ai/specs/heatmap-periodic-table/plotly/code. Any spec id and library id listed in llms-full.txt fit the same URL shape; every URL below is complete and callable.
{
  "spec_id": "heatmap-periodic-table",
  "language": "python",
  "library": "plotly",
  "page": "https://anyplot.ai/heatmap-periodic-table/python/plotly",
  "hub": "https://anyplot.ai/heatmap-periodic-table",
  "code_json": "https://api.anyplot.ai/specs/heatmap-periodic-table/plotly/code",
  "spec_json": "https://api.anyplot.ai/specs/heatmap-periodic-table",
  "render_light_png": "https://storage.googleapis.com/anyplot-images/plots/heatmap-periodic-table/python/plotly/plot-light.png",
  "render_dark_png": "https://storage.googleapis.com/anyplot-images/plots/heatmap-periodic-table/python/plotly/plot-dark.png",
  "interactive_light_html": "https://storage.googleapis.com/anyplot-images/plots/heatmap-periodic-table/python/plotly/plot-light.html",
  "interactive_dark_html": "https://storage.googleapis.com/anyplot-images/plots/heatmap-periodic-table/python/plotly/plot-dark.html",
  "quality_score": 85.0,
  "license": "MIT",
  "guide": "https://anyplot.ai/llms.txt"
}
Part of Periodic Table Property Heatmap on anyplot.ai.