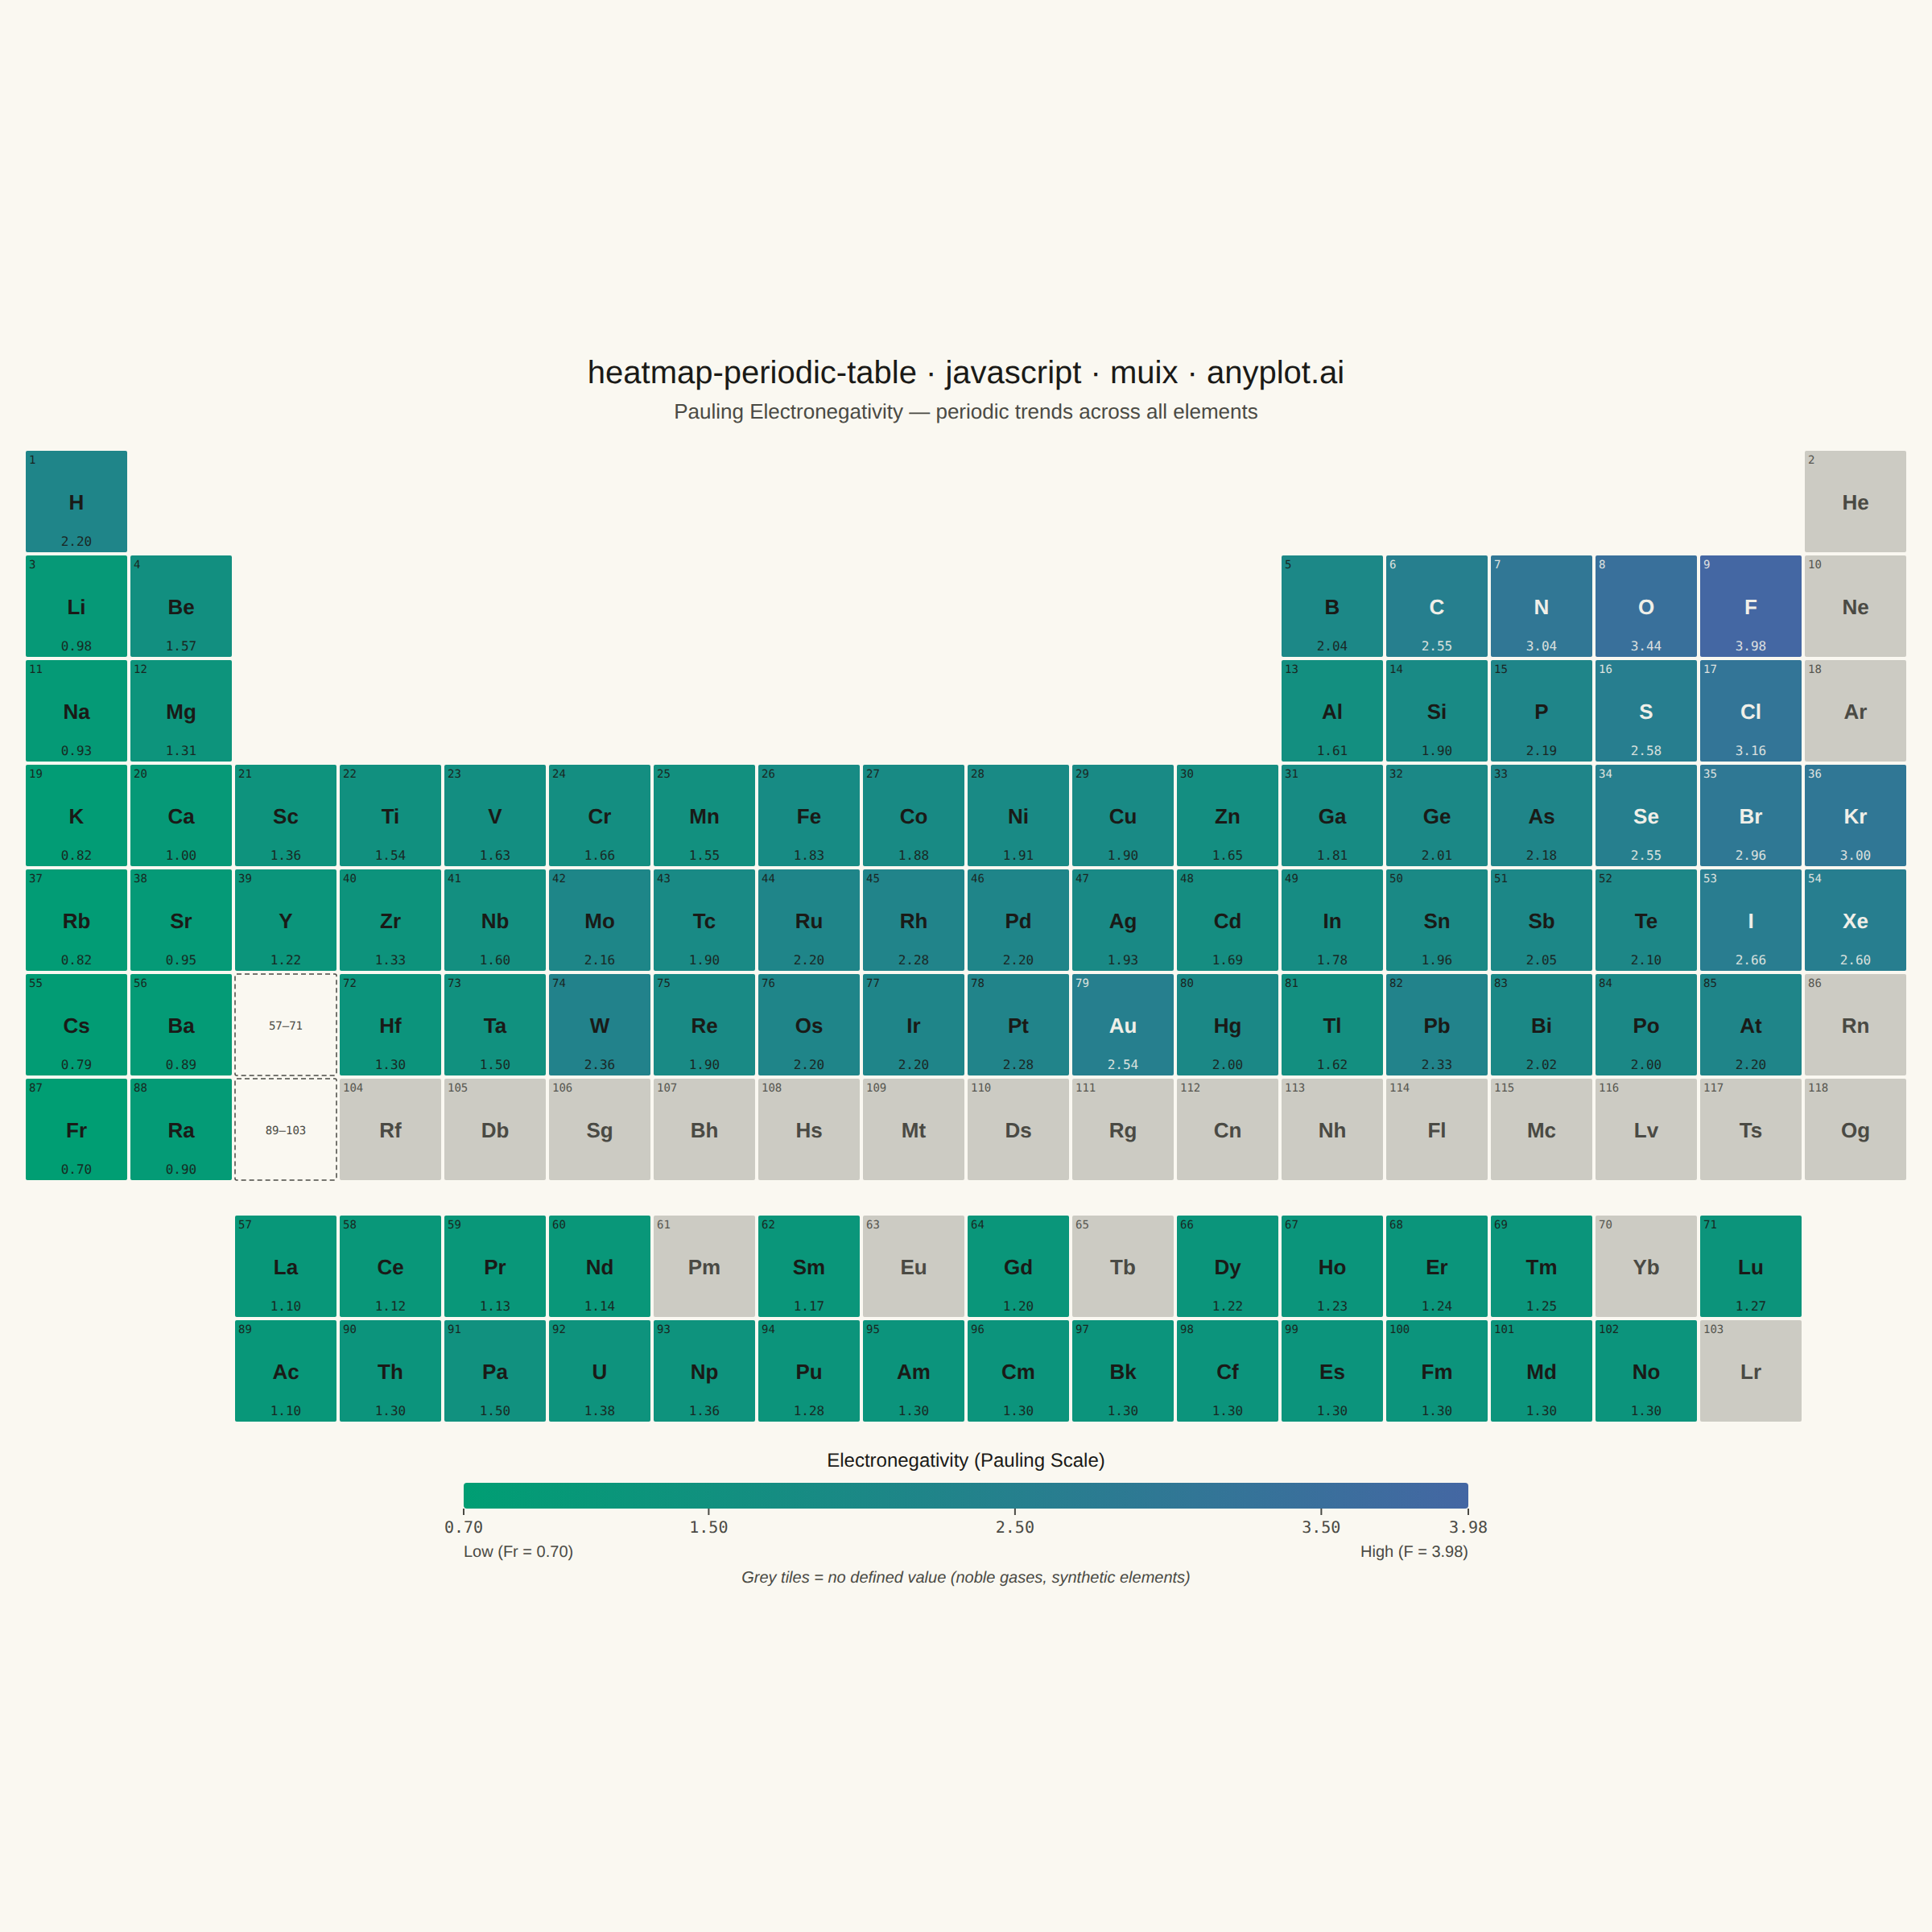
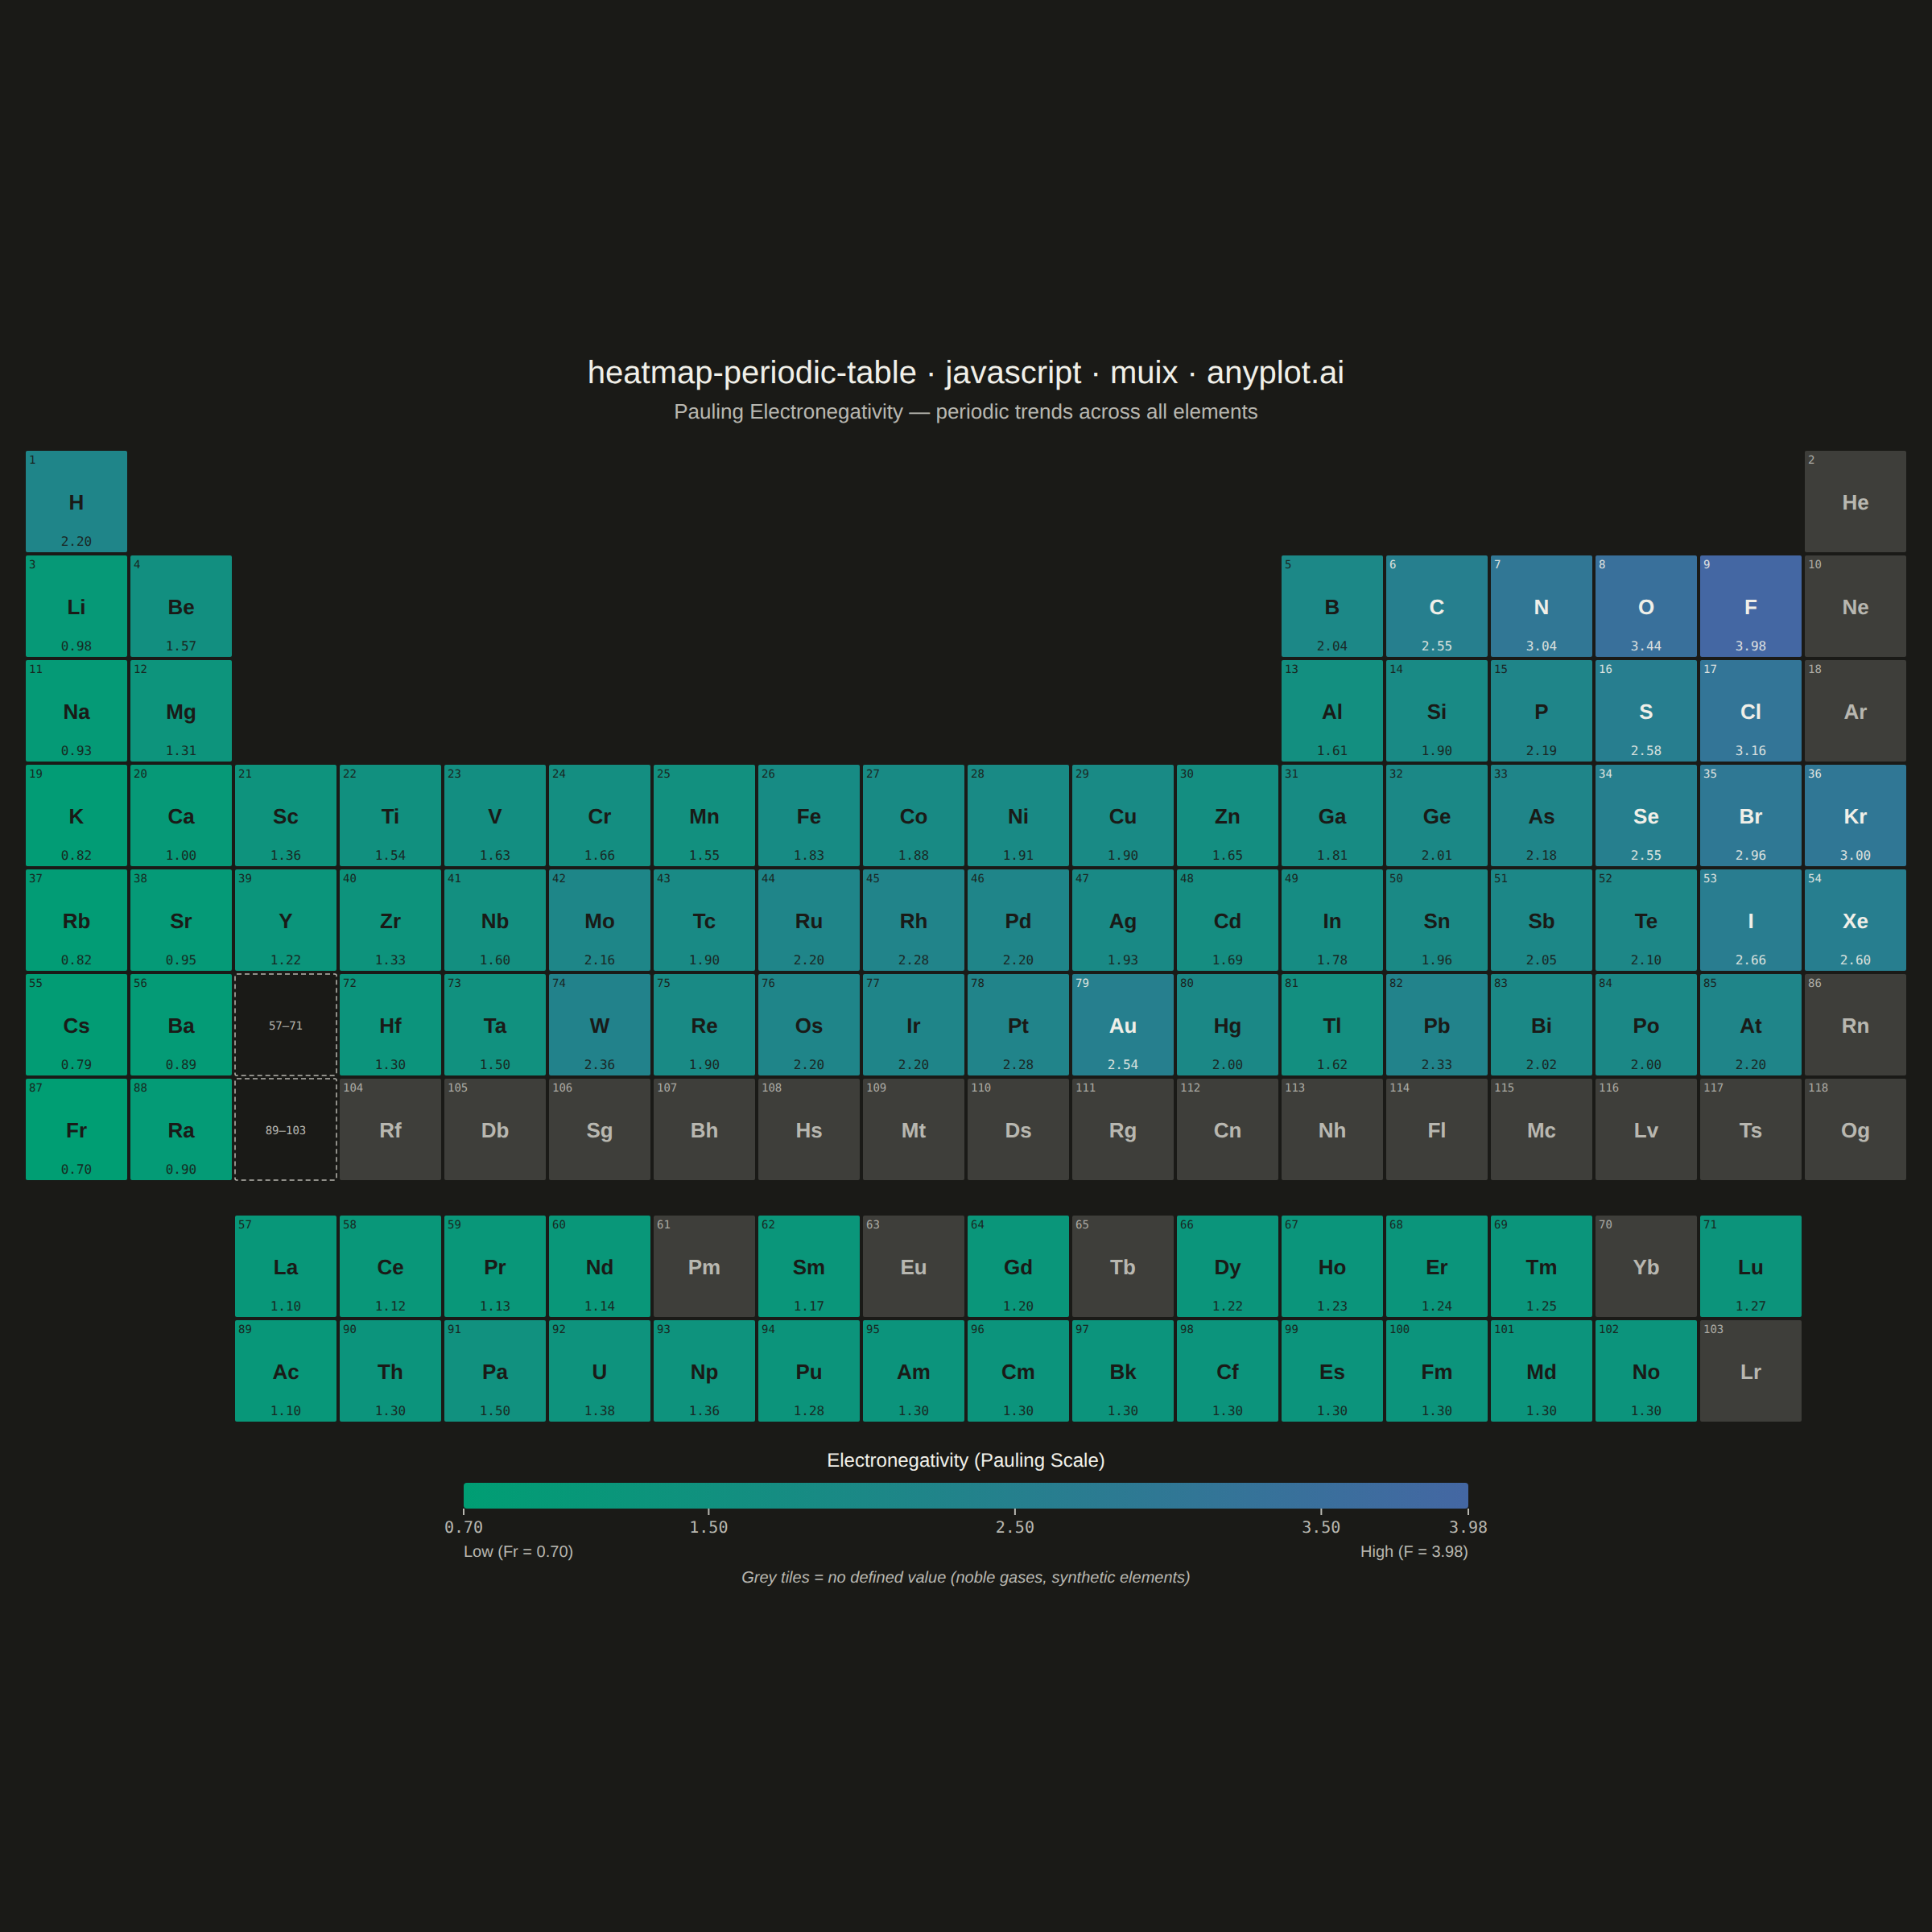
A periodic table of the elements rendered in its canonical layout — 18 groups across by 7 periods down, with the lanthanide and actinide series detached as two separate rows below — where each element tile is colored by a continuous property such as electronegativity, atomic radius, melting point, or first ionization energy. A colorbar maps tile color to property value, and every tile carries the element symbol and atomic number, optionally with the numeric property value. This visualization fuses an immediately recognizable fixed grid with heatmap encoding, turning a familiar reference chart into a tool for spotting periodic trends at a glance.
// anyplot.ai
// heatmap-periodic-table: Periodic Table Property Heatmap
// Library: muix 7.29.1 | JavaScript 22.22.3
// Quality: 88/100 | Created: 2026-06-15
//# anyplot-orientation: square
// anyplot.ai
// heatmap-periodic-table: Periodic Table Property Heatmap
// Library: MUI X Charts | React | Node 22
// License: @mui/x-charts — MIT (community). Pro/Premium are out of scope.
// Quality: pending | Created: 2026-06-15

import { ChartContainer } from "@mui/x-charts";
import Box from "@mui/material/Box";

const t = window.ANYPLOT_TOKENS;

// Element data: [Z, symbol, row (1-7 main, 8=lanthanides, 9=actinides), col (1-18), en|null]
// Pauling electronegativity scale; null = no well-defined value
const ELEMENTS = [
  [1,"H",1,1,2.20],[2,"He",1,18,null],
  [3,"Li",2,1,0.98],[4,"Be",2,2,1.57],[5,"B",2,13,2.04],[6,"C",2,14,2.55],
  [7,"N",2,15,3.04],[8,"O",2,16,3.44],[9,"F",2,17,3.98],[10,"Ne",2,18,null],
  [11,"Na",3,1,0.93],[12,"Mg",3,2,1.31],[13,"Al",3,13,1.61],[14,"Si",3,14,1.90],
  [15,"P",3,15,2.19],[16,"S",3,16,2.58],[17,"Cl",3,17,3.16],[18,"Ar",3,18,null],
  [19,"K",4,1,0.82],[20,"Ca",4,2,1.00],[21,"Sc",4,3,1.36],[22,"Ti",4,4,1.54],
  [23,"V",4,5,1.63],[24,"Cr",4,6,1.66],[25,"Mn",4,7,1.55],[26,"Fe",4,8,1.83],
  [27,"Co",4,9,1.88],[28,"Ni",4,10,1.91],[29,"Cu",4,11,1.90],[30,"Zn",4,12,1.65],
  [31,"Ga",4,13,1.81],[32,"Ge",4,14,2.01],[33,"As",4,15,2.18],[34,"Se",4,16,2.55],
  [35,"Br",4,17,2.96],[36,"Kr",4,18,3.00],
  [37,"Rb",5,1,0.82],[38,"Sr",5,2,0.95],[39,"Y",5,3,1.22],[40,"Zr",5,4,1.33],
  [41,"Nb",5,5,1.60],[42,"Mo",5,6,2.16],[43,"Tc",5,7,1.90],[44,"Ru",5,8,2.20],
  [45,"Rh",5,9,2.28],[46,"Pd",5,10,2.20],[47,"Ag",5,11,1.93],[48,"Cd",5,12,1.69],
  [49,"In",5,13,1.78],[50,"Sn",5,14,1.96],[51,"Sb",5,15,2.05],[52,"Te",5,16,2.10],
  [53,"I",5,17,2.66],[54,"Xe",5,18,2.60],
  [55,"Cs",6,1,0.79],[56,"Ba",6,2,0.89],
  [72,"Hf",6,4,1.30],[73,"Ta",6,5,1.50],[74,"W",6,6,2.36],[75,"Re",6,7,1.90],
  [76,"Os",6,8,2.20],[77,"Ir",6,9,2.20],[78,"Pt",6,10,2.28],[79,"Au",6,11,2.54],
  [80,"Hg",6,12,2.00],[81,"Tl",6,13,1.62],[82,"Pb",6,14,2.33],[83,"Bi",6,15,2.02],
  [84,"Po",6,16,2.00],[85,"At",6,17,2.20],[86,"Rn",6,18,null],
  [87,"Fr",7,1,0.70],[88,"Ra",7,2,0.90],
  [104,"Rf",7,4,null],[105,"Db",7,5,null],[106,"Sg",7,6,null],[107,"Bh",7,7,null],
  [108,"Hs",7,8,null],[109,"Mt",7,9,null],[110,"Ds",7,10,null],[111,"Rg",7,11,null],
  [112,"Cn",7,12,null],[113,"Nh",7,13,null],[114,"Fl",7,14,null],[115,"Mc",7,15,null],
  [116,"Lv",7,16,null],[117,"Ts",7,17,null],[118,"Og",7,18,null],
  // Lanthanides (f-block row 1, cols 3-17)
  [57,"La",8,3,1.10],[58,"Ce",8,4,1.12],[59,"Pr",8,5,1.13],[60,"Nd",8,6,1.14],
  [61,"Pm",8,7,null],[62,"Sm",8,8,1.17],[63,"Eu",8,9,null],[64,"Gd",8,10,1.20],
  [65,"Tb",8,11,null],[66,"Dy",8,12,1.22],[67,"Ho",8,13,1.23],[68,"Er",8,14,1.24],
  [69,"Tm",8,15,1.25],[70,"Yb",8,16,null],[71,"Lu",8,17,1.27],
  // Actinides (f-block row 2, cols 3-17)
  [89,"Ac",9,3,1.10],[90,"Th",9,4,1.30],[91,"Pa",9,5,1.50],[92,"U",9,6,1.38],
  [93,"Np",9,7,1.36],[94,"Pu",9,8,1.28],[95,"Am",9,9,1.30],[96,"Cm",9,10,1.30],
  [97,"Bk",9,11,1.30],[98,"Cf",9,12,1.30],[99,"Es",9,13,1.30],[100,"Fm",9,14,1.30],
  [101,"Md",9,15,1.30],[102,"No",9,16,1.30],[103,"Lr",9,17,null],
];

const EN_MIN = 0.70;
const EN_MAX = 3.98;

// Imprint sequential colormap: #009E73 → #4467A3
const C0 = [0, 158, 115];
const C1 = [68, 103, 163];

function tileColor(en) {
  if (en === null) return null;
  const norm = (en - EN_MIN) / (EN_MAX - EN_MIN);
  const r = Math.round(C0[0] + norm * (C1[0] - C0[0]));
  const g = Math.round(C0[1] + norm * (C1[1] - C0[1]));
  const b = Math.round(C0[2] + norm * (C1[2] - C0[2]));
  return `rgb(${r},${g},${b})`;
}

// WCAG-based luminance to pick readable text on colored tile
function tileTextColor(en) {
  if (en === null) return t.inkSoft;
  const norm = (en - EN_MIN) / (EN_MAX - EN_MIN);
  const r = C0[0] + norm * (C1[0] - C0[0]);
  const g = C0[1] + norm * (C1[1] - C0[1]);
  const b = C0[2] + norm * (C1[2] - C0[2]);
  const lin = [r / 255, g / 255, b / 255].map(
    (v) => (v <= 0.03928 ? v / 12.92 : Math.pow((v + 0.055) / 1.055, 2.4))
  );
  const lum = 0.2126 * lin[0] + 0.7152 * lin[1] + 0.0722 * lin[2];
  return lum > 0.18 ? "#1A1A17" : "#F0EFE8";
}

export default function Chart() {
  const W = window.ANYPLOT_SIZE.width;
  const H = window.ANYPLOT_SIZE.height;
  const THEME = window.ANYPLOT_THEME;

  const NULL_FILL = THEME === "light" ? "#CCCBC3" : "#3E3E3A";

  const GAP = 2;
  const LEFT = 16;
  const TILE = Math.floor((W - LEFT * 2 - 17 * GAP) / 18);
  const F_GAP = 20;
  const CB_H = 16;

  // Vertical centering: compute yOffset so blank space is balanced top/bottom.
  // Content block spans from title-top (~TITLE_Y_BASE - TITLE_FONT) to colorbar note.
  const TITLE_FONT = 20;
  const TITLE_Y_BASE = 46;
  const SUBTITLE_Y_BASE = 68;
  const INITIAL_TABLE_TOP = 88; // subtitle baseline + 20px gap

  // Distance from TABLE_TOP to bottom of last f-block row:
  // tileY(9)+TILE = TABLE_TOP + 8*(TILE+GAP) + F_GAP + TILE
  const tableBottomOff = 8 * (TILE + GAP) + TILE + F_GAP;
  // Colorbar note (last element) is at TABLE_TOP + tableBottomOff + 38 + CB_H + 46
  const contentBottomOff = tableBottomOff + 38 + CB_H + 46;

  const contentTop = TITLE_Y_BASE - TITLE_FONT; // approx 26px
  const contentBottomNoShift = INITIAL_TABLE_TOP + contentBottomOff;
  const contentHeight = contentBottomNoShift - contentTop;
  const yOffset = Math.max(0, Math.round((H - contentHeight) / 2 - contentTop));

  const TABLE_TOP = INITIAL_TABLE_TOP + yOffset;
  const titleY = TITLE_Y_BASE + yOffset;
  const subtitleY = SUBTITLE_Y_BASE + yOffset;

  function tileX(col) {
    return LEFT + (col - 1) * (TILE + GAP);
  }
  function tileY(row) {
    if (row <= 7) return TABLE_TOP + (row - 1) * (TILE + GAP);
    const fTop = TABLE_TOP + 7 * (TILE + GAP) + F_GAP;
    return fTop + (row - 8) * (TILE + GAP);
  }

  const tableBottom = tileY(9) + TILE;
  const cbTop = tableBottom + 38;
  const cbWidth = Math.round(W * 0.52);
  const cbLeft = Math.round((W - cbWidth) / 2);

  const cbTicks = [
    { val: 0.70, label: "0.70" },
    { val: 1.50, label: "1.50" },
    { val: 2.50, label: "2.50" },
    { val: 3.50, label: "3.50" },
    { val: 3.98, label: "3.98" },
  ];

  // ChartContainer is the MUI X Charts composition root; its SVG surface
  // hosts the periodic table tiles drawn as direct SVG children.
  return (
    <Box sx={{ width: W, height: H, bgcolor: t.pageBg }}>
      <ChartContainer width={W} height={H} series={[]} skipAnimation>
        <defs>
          {/* Imprint sequential gradient for colorbar */}
          <linearGradient id="pt-imprint-seq" x1="0" x2="1" y1="0" y2="0">
            <stop offset="0%" stopColor="#009E73" />
            <stop offset="100%" stopColor="#4467A3" />
          </linearGradient>
        </defs>

        {/* Title */}
        <text
          x={W / 2}
          y={titleY}
          textAnchor="middle"
          fontSize={20}
          fontWeight="500"
          fill={t.ink}
          fontFamily="Inter, Roboto, sans-serif"
        >
          heatmap-periodic-table · javascript · muix · anyplot.ai
        </text>
        <text
          x={W / 2}
          y={subtitleY}
          textAnchor="middle"
          fontSize={13}
          fill={t.inkSoft}
          fontFamily="Inter, Roboto, sans-serif"
        >
          Pauling Electronegativity — periodic trends across all elements
        </text>

        {/* Placeholder tiles at period 6 & 7, group 3 (f-block location markers) */}
        {[{ pr: 6, lbl: "57–71" }, { pr: 7, lbl: "89–103" }].map(({ pr, lbl }) => {
          const x = tileX(3);
          const y = tileY(pr);
          return (
            <g key={`ph${pr}`}>
              <rect
                x={x} y={y} width={TILE} height={TILE}
                fill="none"
                stroke={t.inkSoft}
                strokeWidth={0.75}
                strokeDasharray="3,2"
                rx={1}
              />
              <text
                x={x + TILE / 2}
                y={y + TILE / 2 + 3}
                textAnchor="middle"
                fontSize={7}
                fill={t.inkSoft}
                fontFamily="monospace"
              >
                {lbl}
              </text>
            </g>
          );
        })}

        {/* Element tiles */}
        {ELEMENTS.map(([Z, sym, row, col, en]) => {
          const x = tileX(col);
          const y = tileY(row);
          const fill = tileColor(en) ?? NULL_FILL;
          const txt = tileTextColor(en);
          return (
            <g key={Z}>
              <rect x={x} y={y} width={TILE} height={TILE} fill={fill} rx={1} />
              {/* Atomic number — top-left corner */}
              <text
                x={x + 2} y={y + 8}
                fontSize={7}
                fill={txt}
                fontFamily="monospace"
                opacity={0.9}
              >
                {Z}
              </text>
              {/* Element symbol — centered */}
              <text
                x={x + TILE / 2}
                y={y + TILE / 2 + 5}
                textAnchor="middle"
                fontSize={13}
                fontWeight="700"
                fill={txt}
                fontFamily="Inter, Roboto, sans-serif"
              >
                {sym}
              </text>
              {/* Electronegativity value — bottom */}
              {en !== null && (
                <text
                  x={x + TILE / 2}
                  y={y + TILE - 4}
                  textAnchor="middle"
                  fontSize={8}
                  fill={txt}
                  fontFamily="monospace"
                  opacity={0.88}
                >
                  {en.toFixed(2)}
                </text>
              )}
            </g>
          );
        })}

        {/* Colorbar label */}
        <text
          x={W / 2}
          y={cbTop - 10}
          textAnchor="middle"
          fontSize={12}
          fill={t.ink}
          fontFamily="Inter, Roboto, sans-serif"
        >
          Electronegativity (Pauling Scale)
        </text>

        {/* Colorbar gradient rect */}
        <rect
          x={cbLeft}
          y={cbTop}
          width={cbWidth}
          height={CB_H}
          fill="url(#pt-imprint-seq)"
          rx={2}
        />

        {/* Colorbar ticks and labels */}
        {cbTicks.map(({ val, label }) => {
          const nx = cbLeft + ((val - EN_MIN) / (EN_MAX - EN_MIN)) * cbWidth;
          return (
            <g key={val}>
              <line
                x1={nx} y1={cbTop + CB_H}
                x2={nx} y2={cbTop + CB_H + 4}
                stroke={t.inkSoft}
                strokeWidth={1}
              />
              <text
                x={nx}
                y={cbTop + CB_H + 15}
                textAnchor="middle"
                fontSize={10}
                fill={t.inkSoft}
                fontFamily="monospace"
              >
                {label}
              </text>
            </g>
          );
        })}

        {/* Low / High labels */}
        <text
          x={cbLeft}
          y={cbTop + CB_H + 30}
          textAnchor="start"
          fontSize={10}
          fill={t.inkSoft}
          fontFamily="Inter, Roboto, sans-serif"
        >
          Low (Fr = 0.70)
        </text>
        <text
          x={cbLeft + cbWidth}
          y={cbTop + CB_H + 30}
          textAnchor="end"
          fontSize={10}
          fill={t.inkSoft}
          fontFamily="Inter, Roboto, sans-serif"
        >
          High (F = 3.98)
        </text>
        <text
          x={cbLeft + cbWidth / 2}
          y={cbTop + CB_H + 46}
          textAnchor="middle"
          fontSize={10}
          fill={t.inkSoft}
          fontFamily="Inter, Roboto, sans-serif"
          fontStyle="italic"
        >
          Grey tiles = no defined value (noble gases, synthetic elements)
        </text>
      </ChartContainer>
    </Box>
  );
}
Runnable source as JSON, for any HTTP client: https://api.anyplot.ai/specs/heatmap-periodic-table/muix/code. Any spec id and library id listed in llms-full.txt fit the same URL shape; every URL below is complete and callable.
{
  "spec_id": "heatmap-periodic-table",
  "language": "javascript",
  "library": "muix",
  "page": "https://anyplot.ai/heatmap-periodic-table/javascript/muix",
  "hub": "https://anyplot.ai/heatmap-periodic-table",
  "code_json": "https://api.anyplot.ai/specs/heatmap-periodic-table/muix/code",
  "spec_json": "https://api.anyplot.ai/specs/heatmap-periodic-table",
  "render_light_png": "https://storage.googleapis.com/anyplot-images/plots/heatmap-periodic-table/javascript/muix/plot-light.png",
  "render_dark_png": "https://storage.googleapis.com/anyplot-images/plots/heatmap-periodic-table/javascript/muix/plot-dark.png",
  "interactive_light_html": "https://storage.googleapis.com/anyplot-images/plots/heatmap-periodic-table/javascript/muix/plot-light.html",
  "interactive_dark_html": "https://storage.googleapis.com/anyplot-images/plots/heatmap-periodic-table/javascript/muix/plot-dark.html",
  "quality_score": 88.0,
  "license": "MIT",
  "guide": "https://anyplot.ai/llms.txt"
}
Part of Periodic Table Property Heatmap on anyplot.ai.