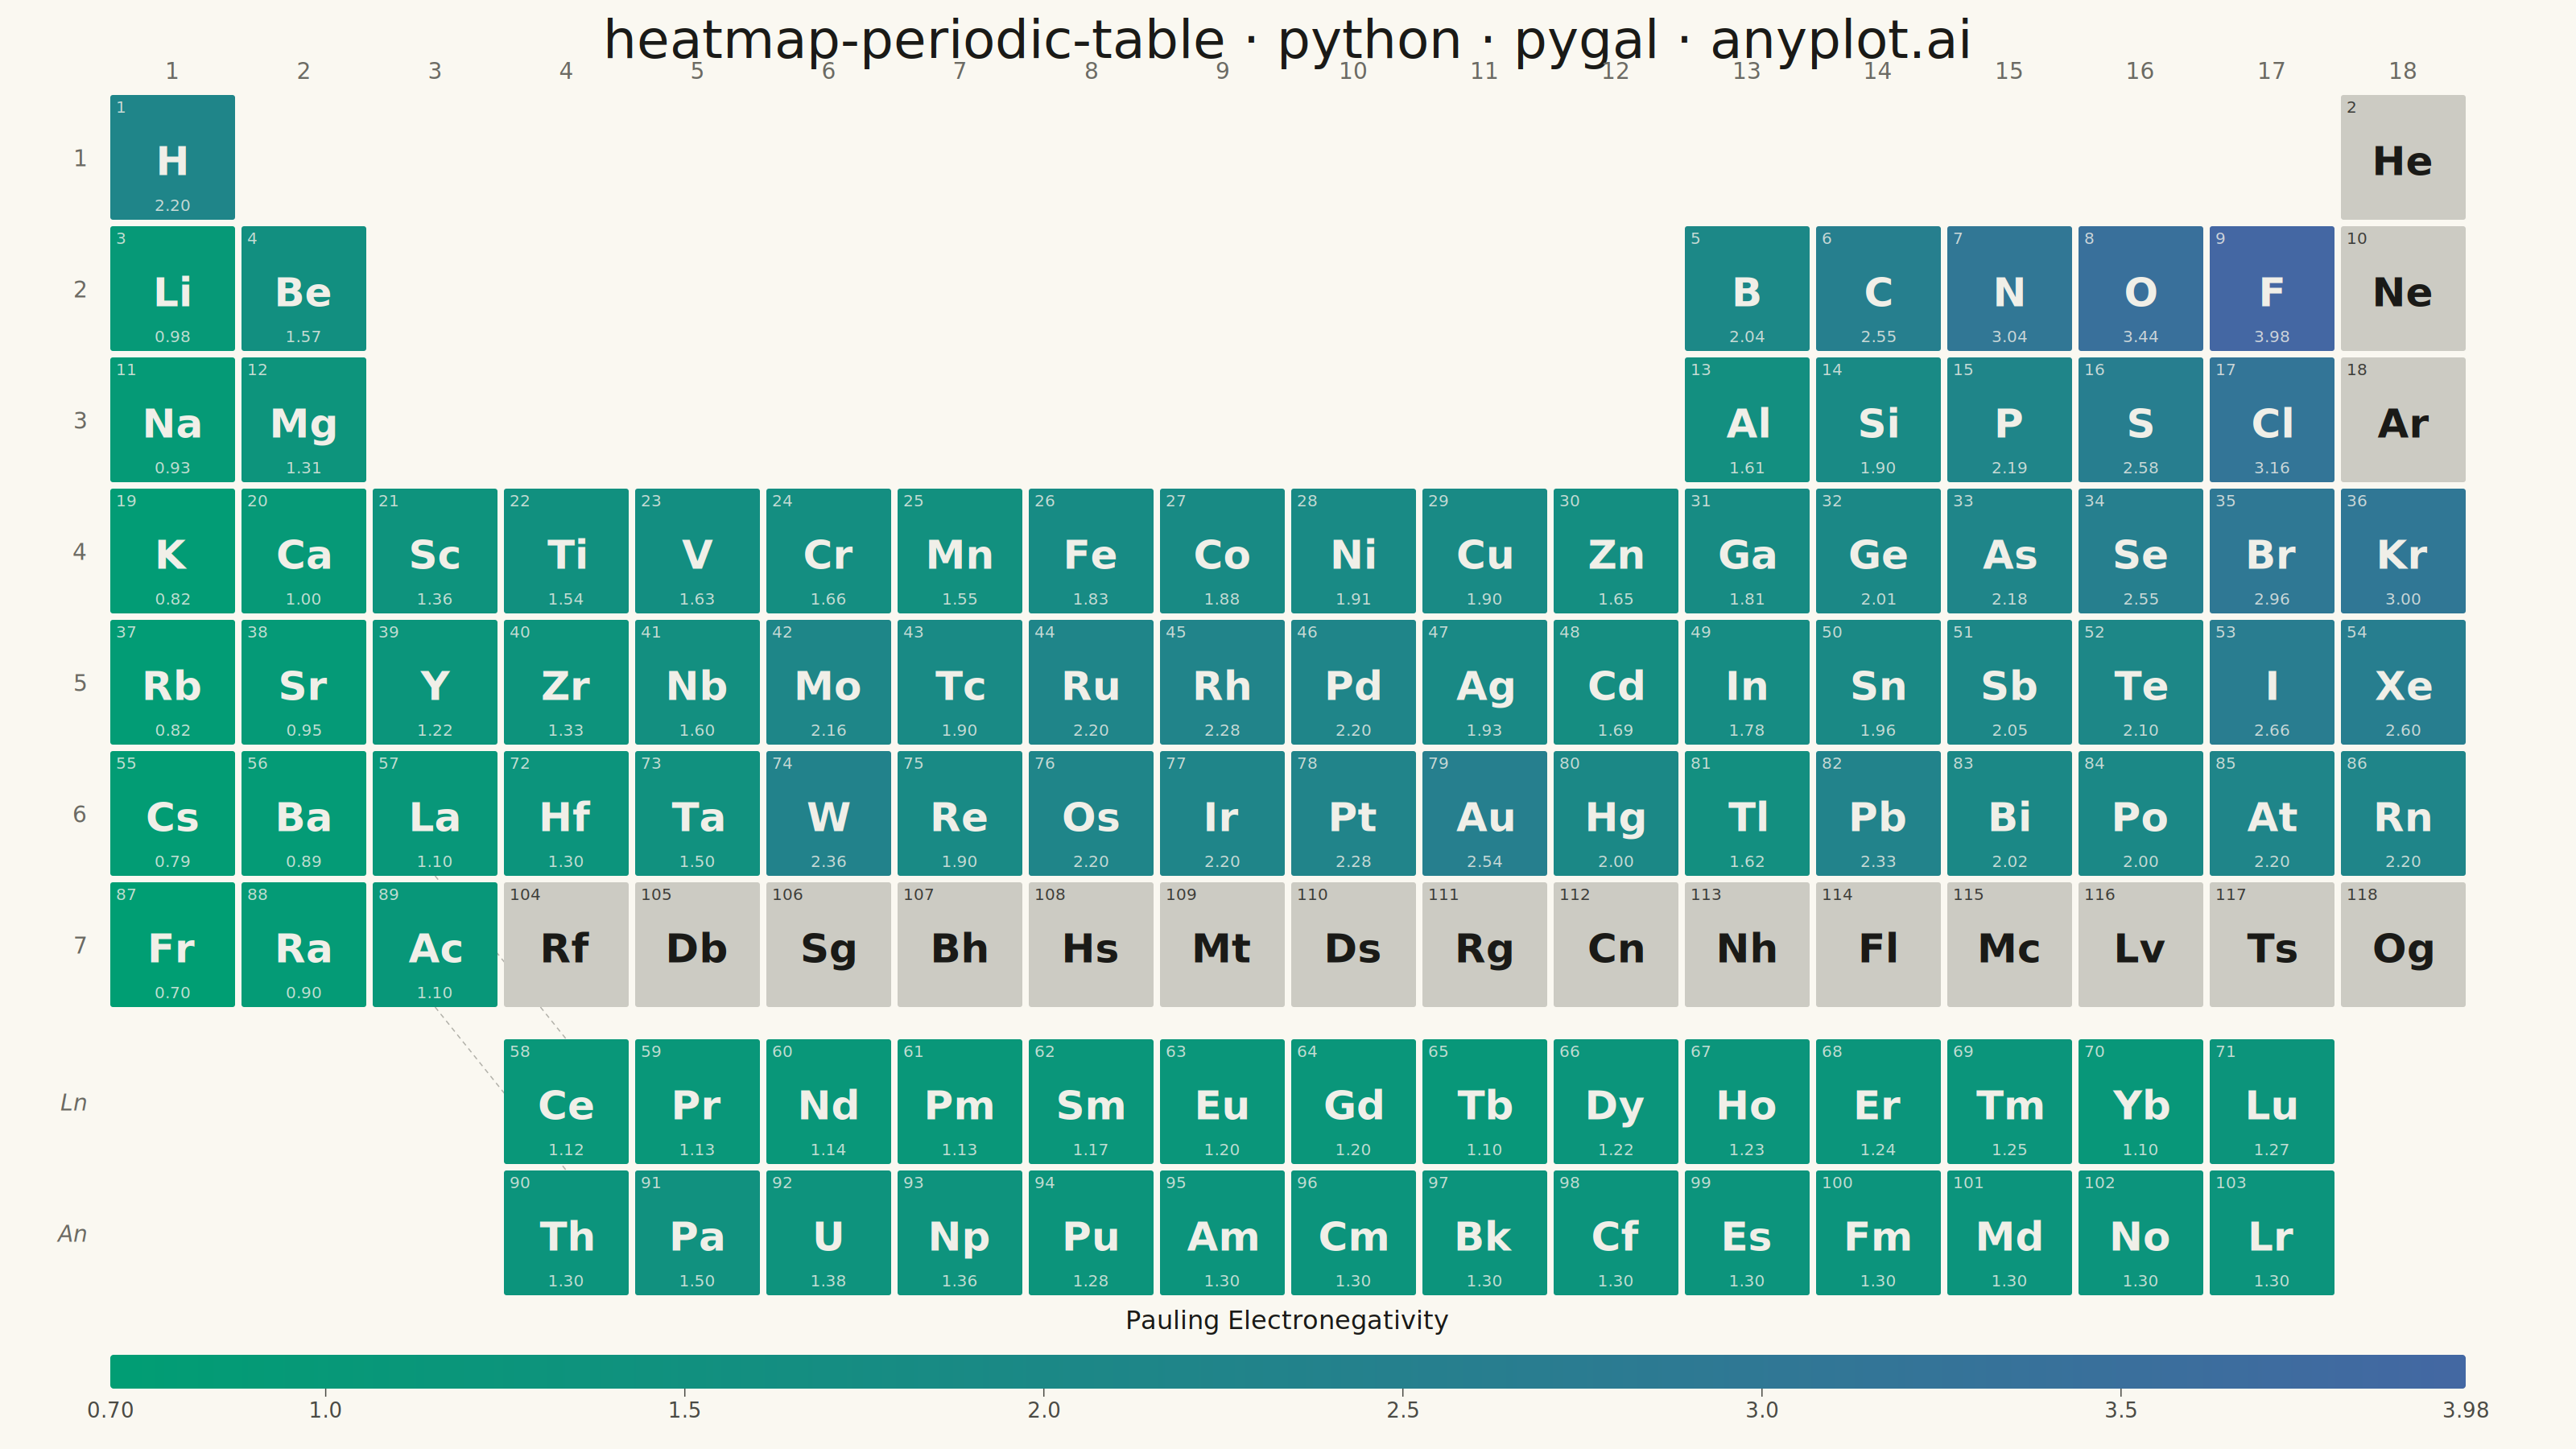
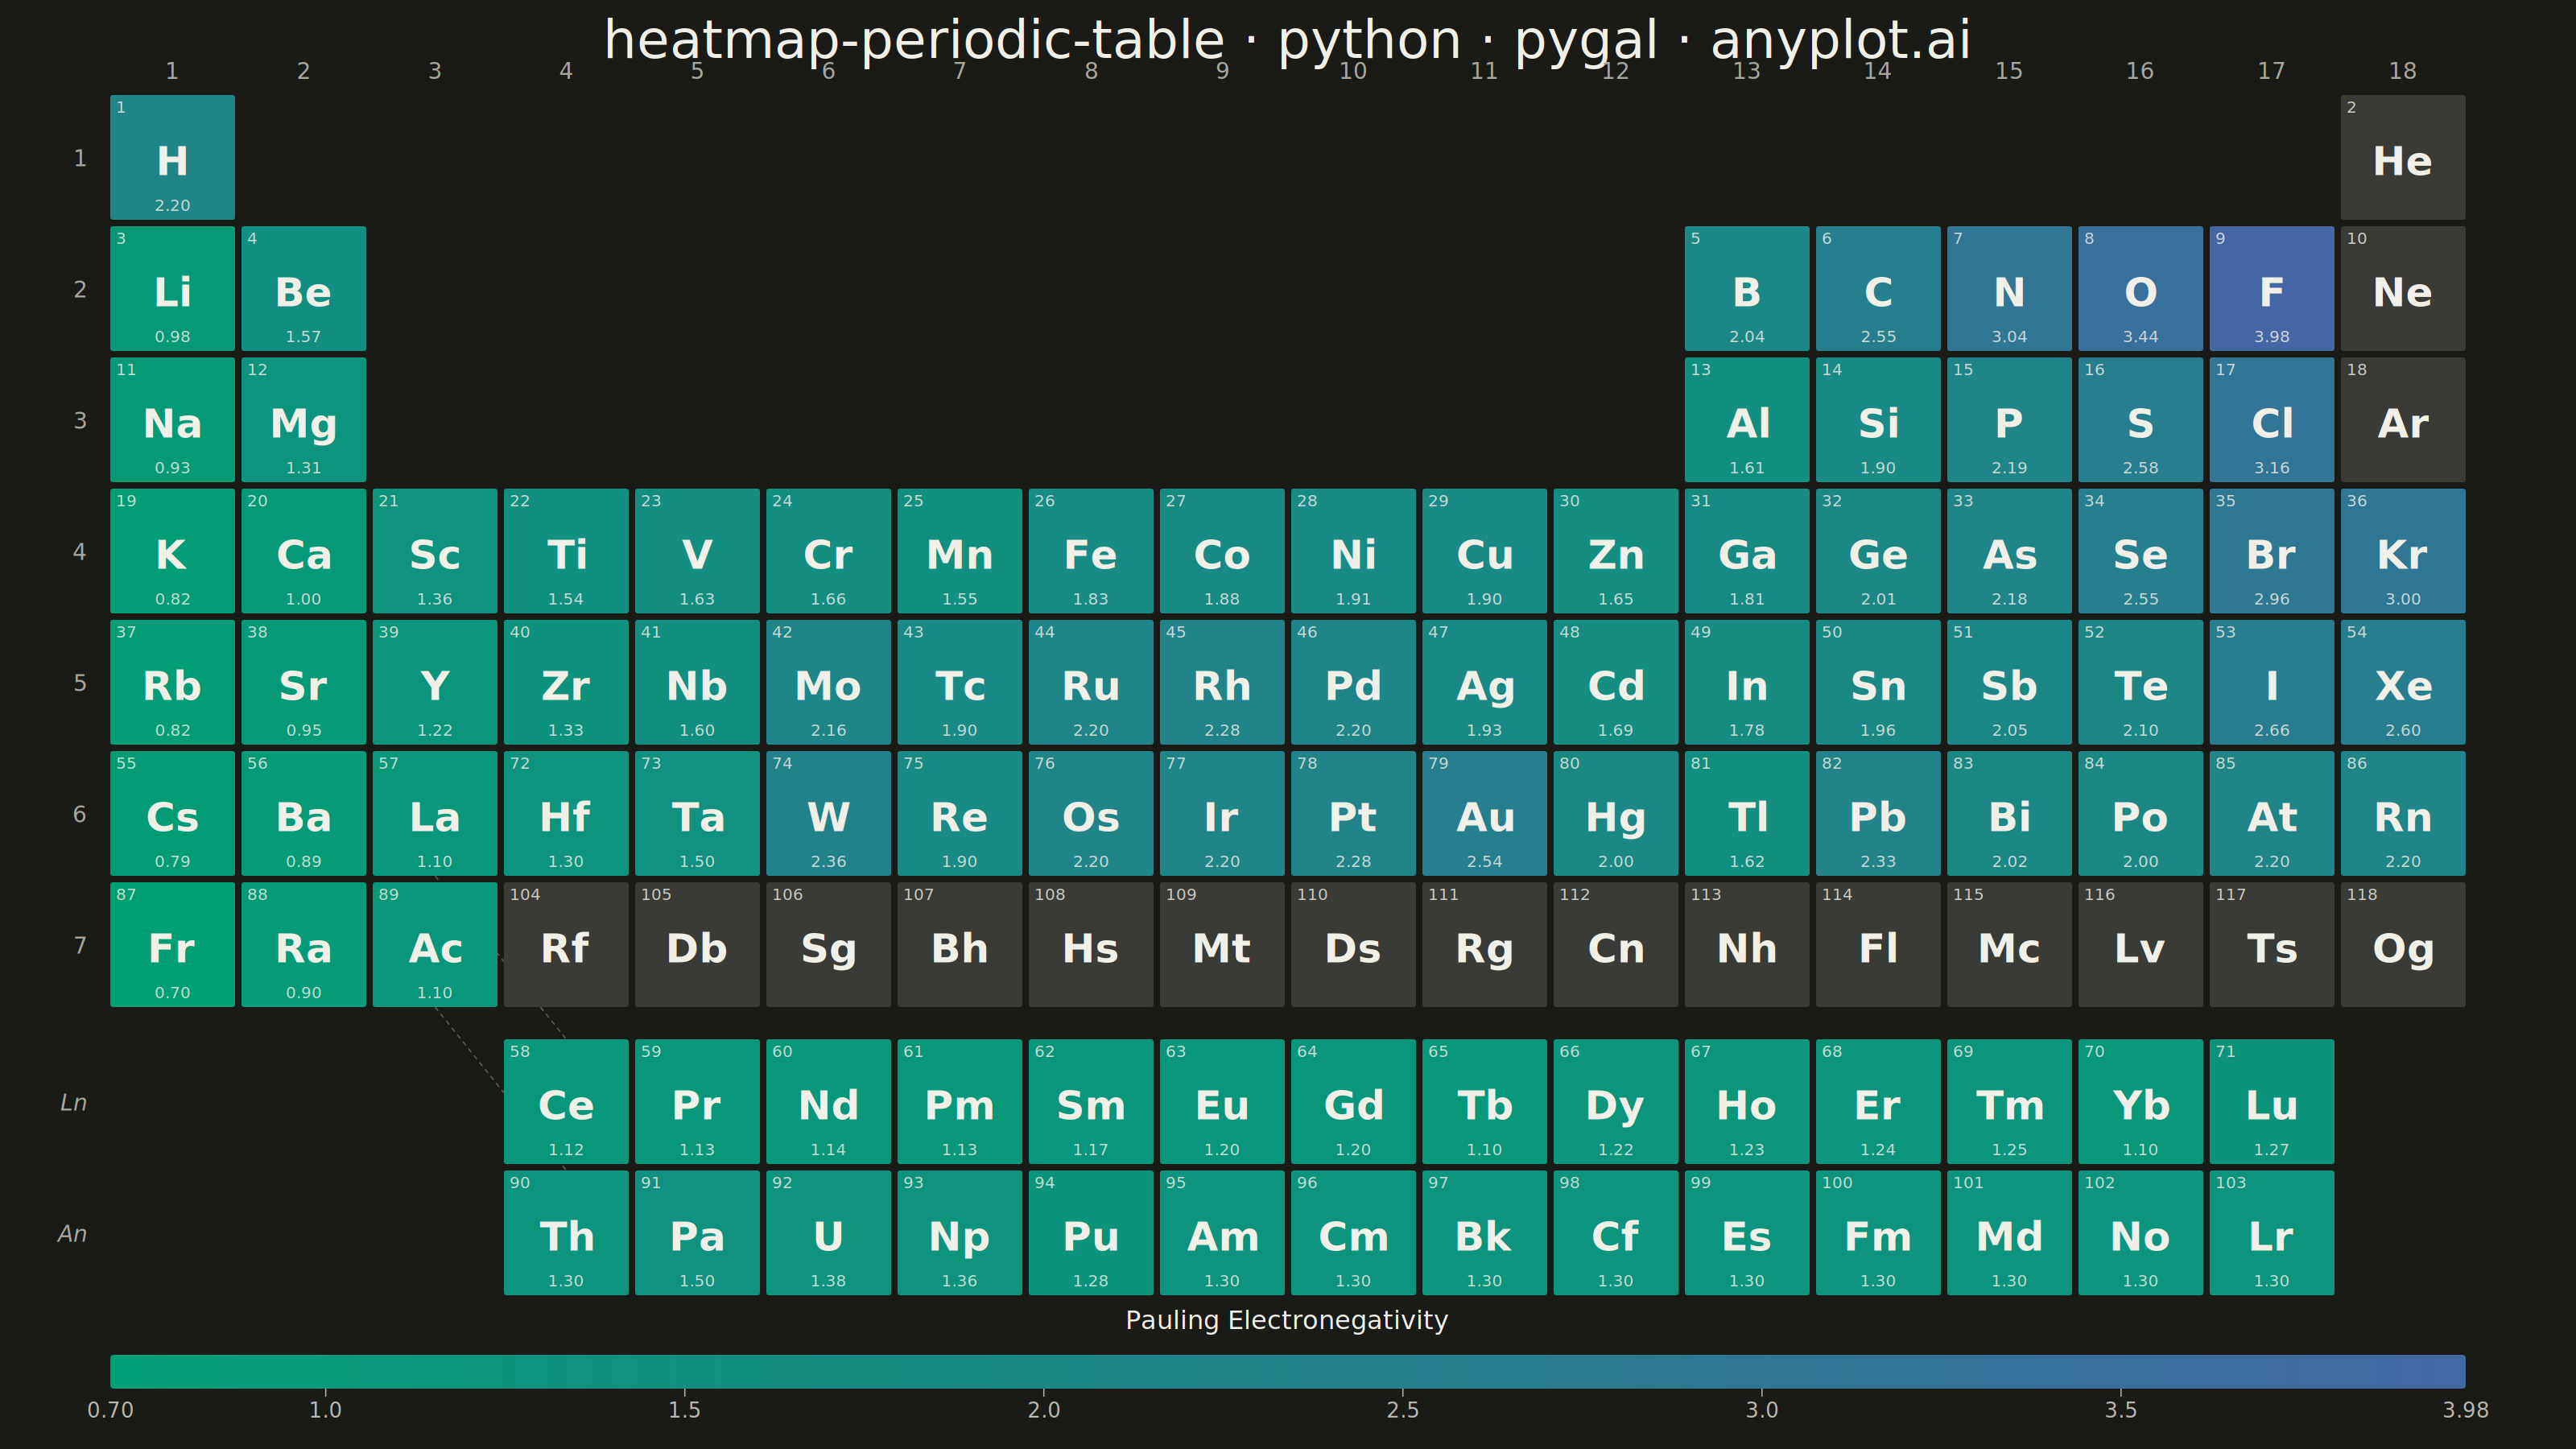
A periodic table of the elements rendered in its canonical layout — 18 groups across by 7 periods down, with the lanthanide and actinide series detached as two separate rows below — where each element tile is colored by a continuous property such as electronegativity, atomic radius, melting point, or first ionization energy. A colorbar maps tile color to property value, and every tile carries the element symbol and atomic number, optionally with the numeric property value. This visualization fuses an immediately recognizable fixed grid with heatmap encoding, turning a familiar reference chart into a tool for spotting periodic trends at a glance.
""" anyplot.ai
heatmap-periodic-table: Periodic Table Property Heatmap
Library: pygal 3.1.0 | Python 3.13.13
Quality: 87/100 | Created: 2026-06-15
"""

import os
import sys


sys.path.pop(0)  # prevent this file shadowing the installed pygal package

import pygal
from pygal.style import Style


THEME = os.getenv("ANYPLOT_THEME", "light")
PAGE_BG = "#FAF8F1" if THEME == "light" else "#1A1A17"
INK = "#1A1A17" if THEME == "light" else "#F0EFE8"
INK_SOFT = "#4A4A44" if THEME == "light" else "#B8B7B0"
INK_MUTED = "#6B6A63" if THEME == "light" else "#A8A79F"
GREY_TILE = "#CCCBC3" if THEME == "light" else "#3A3A36"

FONT = "DejaVu Sans, Helvetica, Arial, sans-serif"

# Imprint sequential colormap: brand green → blue (single-polarity continuous data)
SEQ_START = "#009E73"
SEQ_END = "#4467A3"

# Element data: (symbol, atomic_number, grid_col[1-18], grid_row[1-9], en_or_None)
# grid_row 1-7 = periods 1-7 in the main 18-column table
# grid_row 8   = lanthanide f-block row (Ce-Lu at cols 4-17)
# grid_row 9   = actinide  f-block row (Th-Lr at cols 4-17)
# La sits at (col=3, row=6) and Ac at (col=3, row=7) in the main table;
# Ce-Lu and Th-Lr are detached below following the standard IUPAC layout.
ELEMENTS = [
    # Period 1
    ("H", 1, 1, 1, 2.20),
    ("He", 2, 18, 1, None),
    # Period 2
    ("Li", 3, 1, 2, 0.98),
    ("Be", 4, 2, 2, 1.57),
    ("B", 5, 13, 2, 2.04),
    ("C", 6, 14, 2, 2.55),
    ("N", 7, 15, 2, 3.04),
    ("O", 8, 16, 2, 3.44),
    ("F", 9, 17, 2, 3.98),
    ("Ne", 10, 18, 2, None),
    # Period 3
    ("Na", 11, 1, 3, 0.93),
    ("Mg", 12, 2, 3, 1.31),
    ("Al", 13, 13, 3, 1.61),
    ("Si", 14, 14, 3, 1.90),
    ("P", 15, 15, 3, 2.19),
    ("S", 16, 16, 3, 2.58),
    ("Cl", 17, 17, 3, 3.16),
    ("Ar", 18, 18, 3, None),
    # Period 4
    ("K", 19, 1, 4, 0.82),
    ("Ca", 20, 2, 4, 1.00),
    ("Sc", 21, 3, 4, 1.36),
    ("Ti", 22, 4, 4, 1.54),
    ("V", 23, 5, 4, 1.63),
    ("Cr", 24, 6, 4, 1.66),
    ("Mn", 25, 7, 4, 1.55),
    ("Fe", 26, 8, 4, 1.83),
    ("Co", 27, 9, 4, 1.88),
    ("Ni", 28, 10, 4, 1.91),
    ("Cu", 29, 11, 4, 1.90),
    ("Zn", 30, 12, 4, 1.65),
    ("Ga", 31, 13, 4, 1.81),
    ("Ge", 32, 14, 4, 2.01),
    ("As", 33, 15, 4, 2.18),
    ("Se", 34, 16, 4, 2.55),
    ("Br", 35, 17, 4, 2.96),
    ("Kr", 36, 18, 4, 3.00),
    # Period 5
    ("Rb", 37, 1, 5, 0.82),
    ("Sr", 38, 2, 5, 0.95),
    ("Y", 39, 3, 5, 1.22),
    ("Zr", 40, 4, 5, 1.33),
    ("Nb", 41, 5, 5, 1.60),
    ("Mo", 42, 6, 5, 2.16),
    ("Tc", 43, 7, 5, 1.90),
    ("Ru", 44, 8, 5, 2.20),
    ("Rh", 45, 9, 5, 2.28),
    ("Pd", 46, 10, 5, 2.20),
    ("Ag", 47, 11, 5, 1.93),
    ("Cd", 48, 12, 5, 1.69),
    ("In", 49, 13, 5, 1.78),
    ("Sn", 50, 14, 5, 1.96),
    ("Sb", 51, 15, 5, 2.05),
    ("Te", 52, 16, 5, 2.10),
    ("I", 53, 17, 5, 2.66),
    ("Xe", 54, 18, 5, 2.60),
    # Period 6 — La holds col 3; Hf-Rn are d/p block
    ("Cs", 55, 1, 6, 0.79),
    ("Ba", 56, 2, 6, 0.89),
    ("La", 57, 3, 6, 1.10),
    ("Hf", 72, 4, 6, 1.30),
    ("Ta", 73, 5, 6, 1.50),
    ("W", 74, 6, 6, 2.36),
    ("Re", 75, 7, 6, 1.90),
    ("Os", 76, 8, 6, 2.20),
    ("Ir", 77, 9, 6, 2.20),
    ("Pt", 78, 10, 6, 2.28),
    ("Au", 79, 11, 6, 2.54),
    ("Hg", 80, 12, 6, 2.00),
    ("Tl", 81, 13, 6, 1.62),
    ("Pb", 82, 14, 6, 2.33),
    ("Bi", 83, 15, 6, 2.02),
    ("Po", 84, 16, 6, 2.00),
    ("At", 85, 17, 6, 2.20),
    ("Rn", 86, 18, 6, 2.20),
    # Period 7 — Ac holds col 3; Rf-Og are transactinides (no EN)
    ("Fr", 87, 1, 7, 0.70),
    ("Ra", 88, 2, 7, 0.90),
    ("Ac", 89, 3, 7, 1.10),
    ("Rf", 104, 4, 7, None),
    ("Db", 105, 5, 7, None),
    ("Sg", 106, 6, 7, None),
    ("Bh", 107, 7, 7, None),
    ("Hs", 108, 8, 7, None),
    ("Mt", 109, 9, 7, None),
    ("Ds", 110, 10, 7, None),
    ("Rg", 111, 11, 7, None),
    ("Cn", 112, 12, 7, None),
    ("Nh", 113, 13, 7, None),
    ("Fl", 114, 14, 7, None),
    ("Mc", 115, 15, 7, None),
    ("Lv", 116, 16, 7, None),
    ("Ts", 117, 17, 7, None),
    ("Og", 118, 18, 7, None),
    # Lanthanide f-block row (row 8, cols 4-17 = Ce through Lu)
    ("Ce", 58, 4, 8, 1.12),
    ("Pr", 59, 5, 8, 1.13),
    ("Nd", 60, 6, 8, 1.14),
    ("Pm", 61, 7, 8, 1.13),
    ("Sm", 62, 8, 8, 1.17),
    ("Eu", 63, 9, 8, 1.20),
    ("Gd", 64, 10, 8, 1.20),
    ("Tb", 65, 11, 8, 1.10),
    ("Dy", 66, 12, 8, 1.22),
    ("Ho", 67, 13, 8, 1.23),
    ("Er", 68, 14, 8, 1.24),
    ("Tm", 69, 15, 8, 1.25),
    ("Yb", 70, 16, 8, 1.10),
    ("Lu", 71, 17, 8, 1.27),
    # Actinide f-block row (row 9, cols 4-17 = Th through Lr)
    ("Th", 90, 4, 9, 1.30),
    ("Pa", 91, 5, 9, 1.50),
    ("U", 92, 6, 9, 1.38),
    ("Np", 93, 7, 9, 1.36),
    ("Pu", 94, 8, 9, 1.28),
    ("Am", 95, 9, 9, 1.30),
    ("Cm", 96, 10, 9, 1.30),
    ("Bk", 97, 11, 9, 1.30),
    ("Cf", 98, 12, 9, 1.30),
    ("Es", 99, 13, 9, 1.30),
    ("Fm", 100, 14, 9, 1.30),
    ("Md", 101, 15, 9, 1.30),
    ("No", 102, 16, 9, 1.30),
    ("Lr", 103, 17, 9, 1.30),
]

en_values = [e[4] for e in ELEMENTS if e[4] is not None]
EN_MIN = min(en_values)  # 0.70  (Fr)
EN_MAX = max(en_values)  # 3.98  (F)


def lerp_hex(c0, c1, t):
    r0, g0, b0 = int(c0[1:3], 16), int(c0[3:5], 16), int(c0[5:7], 16)
    r1, g1, b1 = int(c1[1:3], 16), int(c1[3:5], 16), int(c1[5:7], 16)
    r = int(round(r0 + (r1 - r0) * t))
    g = int(round(g0 + (g1 - g0) * t))
    b = int(round(b0 + (b1 - b0) * t))
    return f"#{r:02X}{g:02X}{b:02X}"


def tile_color(en):
    if en is None:
        return GREY_TILE
    t = (en - EN_MIN) / (EN_MAX - EN_MIN)
    return lerp_hex(SEQ_START, SEQ_END, t)


def relative_luminance(hex_c):
    vals = [int(hex_c[i : i + 2], 16) / 255 for i in (1, 3, 5)]
    lin = [v / 12.92 if v <= 0.04045 else ((v + 0.055) / 1.055) ** 2.4 for v in vals]
    return 0.2126 * lin[0] + 0.7152 * lin[1] + 0.0722 * lin[2]


def ink_for_tile(hex_c):
    return "#F0EFE8" if relative_luminance(hex_c) < 0.35 else "#1A1A17"


# Canvas and layout — landscape 3200×1800 (periodic table is inherently wider than tall)
CANVAS_W = 3200
CANVAS_H = 1800
TILE = 155  # tile side length (px)
GAP = 8  # gap between tiles (px)
STRIDE = TILE + GAP  # 163
GRID_W = 17 * STRIDE + TILE  # 2926 px
LEFT = (CANVAS_W - GRID_W) // 2  # 137 px left edge of column 1
TOP = 118  # y of the top edge of period-1 tiles
FBLOCK_EXTRA = 40  # extra gap between period-7 row and the f-block rows

TITLE_TEXT = "heatmap-periodic-table · python · pygal · anyplot.ai"

# Pygal Style — carries all theme tokens into the rendering engine
custom_style = Style(
    background=PAGE_BG,
    plot_background=PAGE_BG,
    foreground=INK,
    foreground_strong=INK,
    foreground_subtle=INK_MUTED,
    colors=("#009E73", "#C475FD", "#4467A3", "#BD8233", "#AE3030", "#2ABCCD", "#954477", "#99B314"),
    title_font_size=66,
    label_font_size=44,
    major_label_font_size=44,
    legend_font_size=44,
    value_font_size=36,
    stroke_width=2.5,
)


def tile_xy(col, row):
    """Return (x, y) top-left corner for a tile at (col, row), 1-indexed."""
    x = LEFT + (col - 1) * STRIDE
    if row <= 7:
        y = TOP + (row - 1) * STRIDE
    else:
        row7_bottom = TOP + 6 * STRIDE + TILE
        y = row7_bottom + FBLOCK_EXTRA + (row - 8) * STRIDE
    return x, y


class PeriodicHeatmap(pygal.Bar):
    """Custom pygal chart type for periodic table heatmaps.

    Subclasses pygal.Bar to leverage its SVG rendering engine, Style
    theming, and render_to_png() infrastructure. The _plot() override
    draws the canonical IUPAC 18×7 grid with f-block rows using
    pygal's svg.node() API instead of the default bar chart.
    """

    def _plot(self):
        """Draw the periodic table using pygal's SVG node API."""
        root = self.svg.root

        # Full-canvas background — covers any pygal chrome drawn by _decorate()
        self.svg.node(root, "rect", x=0, y=0, width=CANVAS_W, height=CANVAS_H, fill=PAGE_BG)

        # Title
        n = self.svg.node(
            root,
            "text",
            attrib={
                "x": str(CANVAS_W // 2),
                "y": "72",
                "text-anchor": "middle",
                "fill": INK,
                "style": f"font-size:66px;font-weight:500;font-family:{FONT}",
            },
        )
        n.text = TITLE_TEXT

        # Group numbers 1–18 above the tiles
        for g in range(1, 19):
            gx = LEFT + (g - 1) * STRIDE + TILE / 2
            n = self.svg.node(
                root,
                "text",
                attrib={
                    "x": f"{gx:.1f}",
                    "y": f"{TOP - 20:.1f}",
                    "text-anchor": "middle",
                    "fill": INK_MUTED,
                    "style": f"font-size:28px;font-family:{FONT}",
                },
            )
            n.text = str(g)

        # Period numbers 1–7 to the left of the main grid
        for p in range(1, 8):
            px = LEFT - 30
            py = TOP + (p - 1) * STRIDE + TILE / 2 + 11
            n = self.svg.node(
                root,
                "text",
                attrib={
                    "x": f"{px:.1f}",
                    "y": f"{py:.1f}",
                    "text-anchor": "end",
                    "fill": INK_MUTED,
                    "style": f"font-size:28px;font-family:{FONT}",
                },
            )
            n.text = str(p)

        # f-block row labels ("Ln" and "An") to the left of the f-block rows
        for fb_row, label in [(8, "Ln"), (9, "An")]:
            _, fy = tile_xy(4, fb_row)
            n = self.svg.node(
                root,
                "text",
                attrib={
                    "x": f"{LEFT - 30:.1f}",
                    "y": f"{fy + TILE / 2 + 11:.1f}",
                    "text-anchor": "end",
                    "fill": INK_MUTED,
                    "style": f"font-size:28px;font-style:italic;font-family:{FONT}",
                },
            )
            n.text = label

        # Thin dashed connector lines from period 6/7 group-3 tile to f-block rows
        for main_row, fb_row in [(6, 8), (7, 9)]:
            mx, my = tile_xy(3, main_row)
            _, fy = tile_xy(4, fb_row)
            self.svg.node(
                root,
                "line",
                attrib={
                    "x1": f"{mx + TILE / 2:.1f}",
                    "y1": f"{my + TILE:.1f}",
                    "x2": f"{LEFT + 3 * STRIDE + TILE / 2:.1f}",
                    "y2": f"{fy:.1f}",
                    "stroke": INK_MUTED,
                    "stroke-width": "1.5",
                    "stroke-dasharray": "6,5",
                    "stroke-opacity": "0.50",
                },
            )

        # Element tiles
        for sym, an, col, row, en in ELEMENTS:
            x, y = tile_xy(col, row)
            fill = tile_color(en)
            ink = ink_for_tile(fill)

            self.svg.node(root, "rect", x=x, y=y, width=TILE, height=TILE, fill=fill, rx=3, ry=3)

            # Atomic number — top-left corner, small
            n = self.svg.node(
                root, "text", x=x + 7, y=y + 22, fill=ink, style=f"font-size:20px;opacity:0.80;font-family:{FONT}"
            )
            n.text = str(an)

            # Element symbol — centred, prominent
            n = self.svg.node(
                root,
                "text",
                attrib={
                    "x": f"{x + TILE / 2:.1f}",
                    "y": f"{y + TILE / 2 + 22:.1f}",
                    "text-anchor": "middle",
                    "fill": ink,
                    "style": f"font-size:50px;font-weight:700;font-family:{FONT}",
                },
            )
            n.text = sym

            # EN value — bottom-centre, small (only when known)
            if en is not None:
                n = self.svg.node(
                    root,
                    "text",
                    attrib={
                        "x": f"{x + TILE / 2:.1f}",
                        "y": f"{y + TILE - 11:.1f}",
                        "text-anchor": "middle",
                        "fill": ink,
                        "style": f"font-size:20px;opacity:0.80;font-family:{FONT}",
                    },
                )
                n.text = f"{en:.2f}"

        # Colorbar — placed below the f-block rows
        _, row9_y = tile_xy(4, 9)
        cb_label_y = row9_y + TILE + 42
        cb_x = LEFT
        cb_w = GRID_W
        cb_h = 42
        cb_y = cb_label_y + 32

        # Gradient definition
        defs = self.svg.node(root, "defs")
        grad = self.svg.node(
            defs, "linearGradient", attrib={"id": "cbGrad", "x1": "0", "y1": "0", "x2": "1", "y2": "0"}
        )
        self.svg.node(grad, "stop", attrib={"offset": "0%", "stop-color": SEQ_START})
        self.svg.node(grad, "stop", attrib={"offset": "100%", "stop-color": SEQ_END})

        # Colorbar label
        n = self.svg.node(
            root,
            "text",
            attrib={
                "x": f"{cb_x + cb_w / 2:.1f}",
                "y": f"{cb_label_y:.1f}",
                "text-anchor": "middle",
                "fill": INK,
                "style": f"font-size:32px;font-family:{FONT}",
            },
        )
        n.text = "Pauling Electronegativity"

        # Colorbar gradient rectangle
        self.svg.node(
            root,
            "rect",
            attrib={
                "x": str(cb_x),
                "y": str(cb_y),
                "width": str(cb_w),
                "height": str(cb_h),
                "fill": "url(#cbGrad)",
                "rx": "4",
            },
        )

        # Colorbar tick marks and labels
        for val in [0.5, 1.0, 1.5, 2.0, 2.5, 3.0, 3.5]:
            if EN_MIN <= val <= EN_MAX:
                t = (val - EN_MIN) / (EN_MAX - EN_MIN)
                tx = cb_x + t * cb_w
                self.svg.node(
                    root,
                    "line",
                    attrib={
                        "x1": f"{tx:.1f}",
                        "y1": f"{cb_y + cb_h:.1f}",
                        "x2": f"{tx:.1f}",
                        "y2": f"{cb_y + cb_h + 10:.1f}",
                        "stroke": INK_SOFT,
                        "stroke-width": "1.5",
                    },
                )
                n = self.svg.node(
                    root,
                    "text",
                    attrib={
                        "x": f"{tx:.1f}",
                        "y": f"{cb_y + cb_h + 36:.1f}",
                        "text-anchor": "middle",
                        "fill": INK_SOFT,
                        "style": f"font-size:26px;font-family:{FONT}",
                    },
                )
                n.text = f"{val:.1f}"

        # Colorbar end labels (min / max values)
        for x_pos, val in [(cb_x, EN_MIN), (cb_x + cb_w, EN_MAX)]:
            n = self.svg.node(
                root,
                "text",
                attrib={
                    "x": f"{x_pos:.1f}",
                    "y": f"{cb_y + cb_h + 36:.1f}",
                    "text-anchor": "middle",
                    "fill": INK_SOFT,
                    "style": f"font-size:26px;font-family:{FONT}",
                },
            )
            n.text = f"{val:.2f}"


# Instantiate using pygal's Bar as base — provides SVG engine, Style theming,
# render_to_png(), and render() without needing manual cairosvg calls
chart = PeriodicHeatmap(
    width=CANVAS_W,
    height=CANVAS_H,
    title=None,
    show_legend=False,
    show_x_labels=False,
    show_y_labels=False,
    show_x_guides=False,
    show_y_guides=False,
    style=custom_style,
    margin=0,
)

# Add a minimal data point so pygal's _draw() calls _plot() (requires non-empty series)
chart.add("EN", [1.0])

# Render PNG using pygal's built-in render_to_png() (uses cairosvg internally)
chart.render_to_png(f"plot-{THEME}.png")

# Render interactive HTML — pygal's render() returns SVG with embedded JS tooltips
with open(f"plot-{THEME}.html", "wb") as fh:
    fh.write(chart.render())
Runnable source as JSON, for any HTTP client: https://api.anyplot.ai/specs/heatmap-periodic-table/pygal/code. Any spec id and library id listed in llms-full.txt fit the same URL shape; every URL below is complete and callable.
{
  "spec_id": "heatmap-periodic-table",
  "language": "python",
  "library": "pygal",
  "page": "https://anyplot.ai/heatmap-periodic-table/python/pygal",
  "hub": "https://anyplot.ai/heatmap-periodic-table",
  "code_json": "https://api.anyplot.ai/specs/heatmap-periodic-table/pygal/code",
  "spec_json": "https://api.anyplot.ai/specs/heatmap-periodic-table",
  "render_light_png": "https://storage.googleapis.com/anyplot-images/plots/heatmap-periodic-table/python/pygal/plot-light.png",
  "render_dark_png": "https://storage.googleapis.com/anyplot-images/plots/heatmap-periodic-table/python/pygal/plot-dark.png",
  "interactive_light_html": "https://storage.googleapis.com/anyplot-images/plots/heatmap-periodic-table/python/pygal/plot-light.html",
  "interactive_dark_html": "https://storage.googleapis.com/anyplot-images/plots/heatmap-periodic-table/python/pygal/plot-dark.html",
  "quality_score": 87.0,
  "license": "MIT",
  "guide": "https://anyplot.ai/llms.txt"
}
Part of Periodic Table Property Heatmap on anyplot.ai.