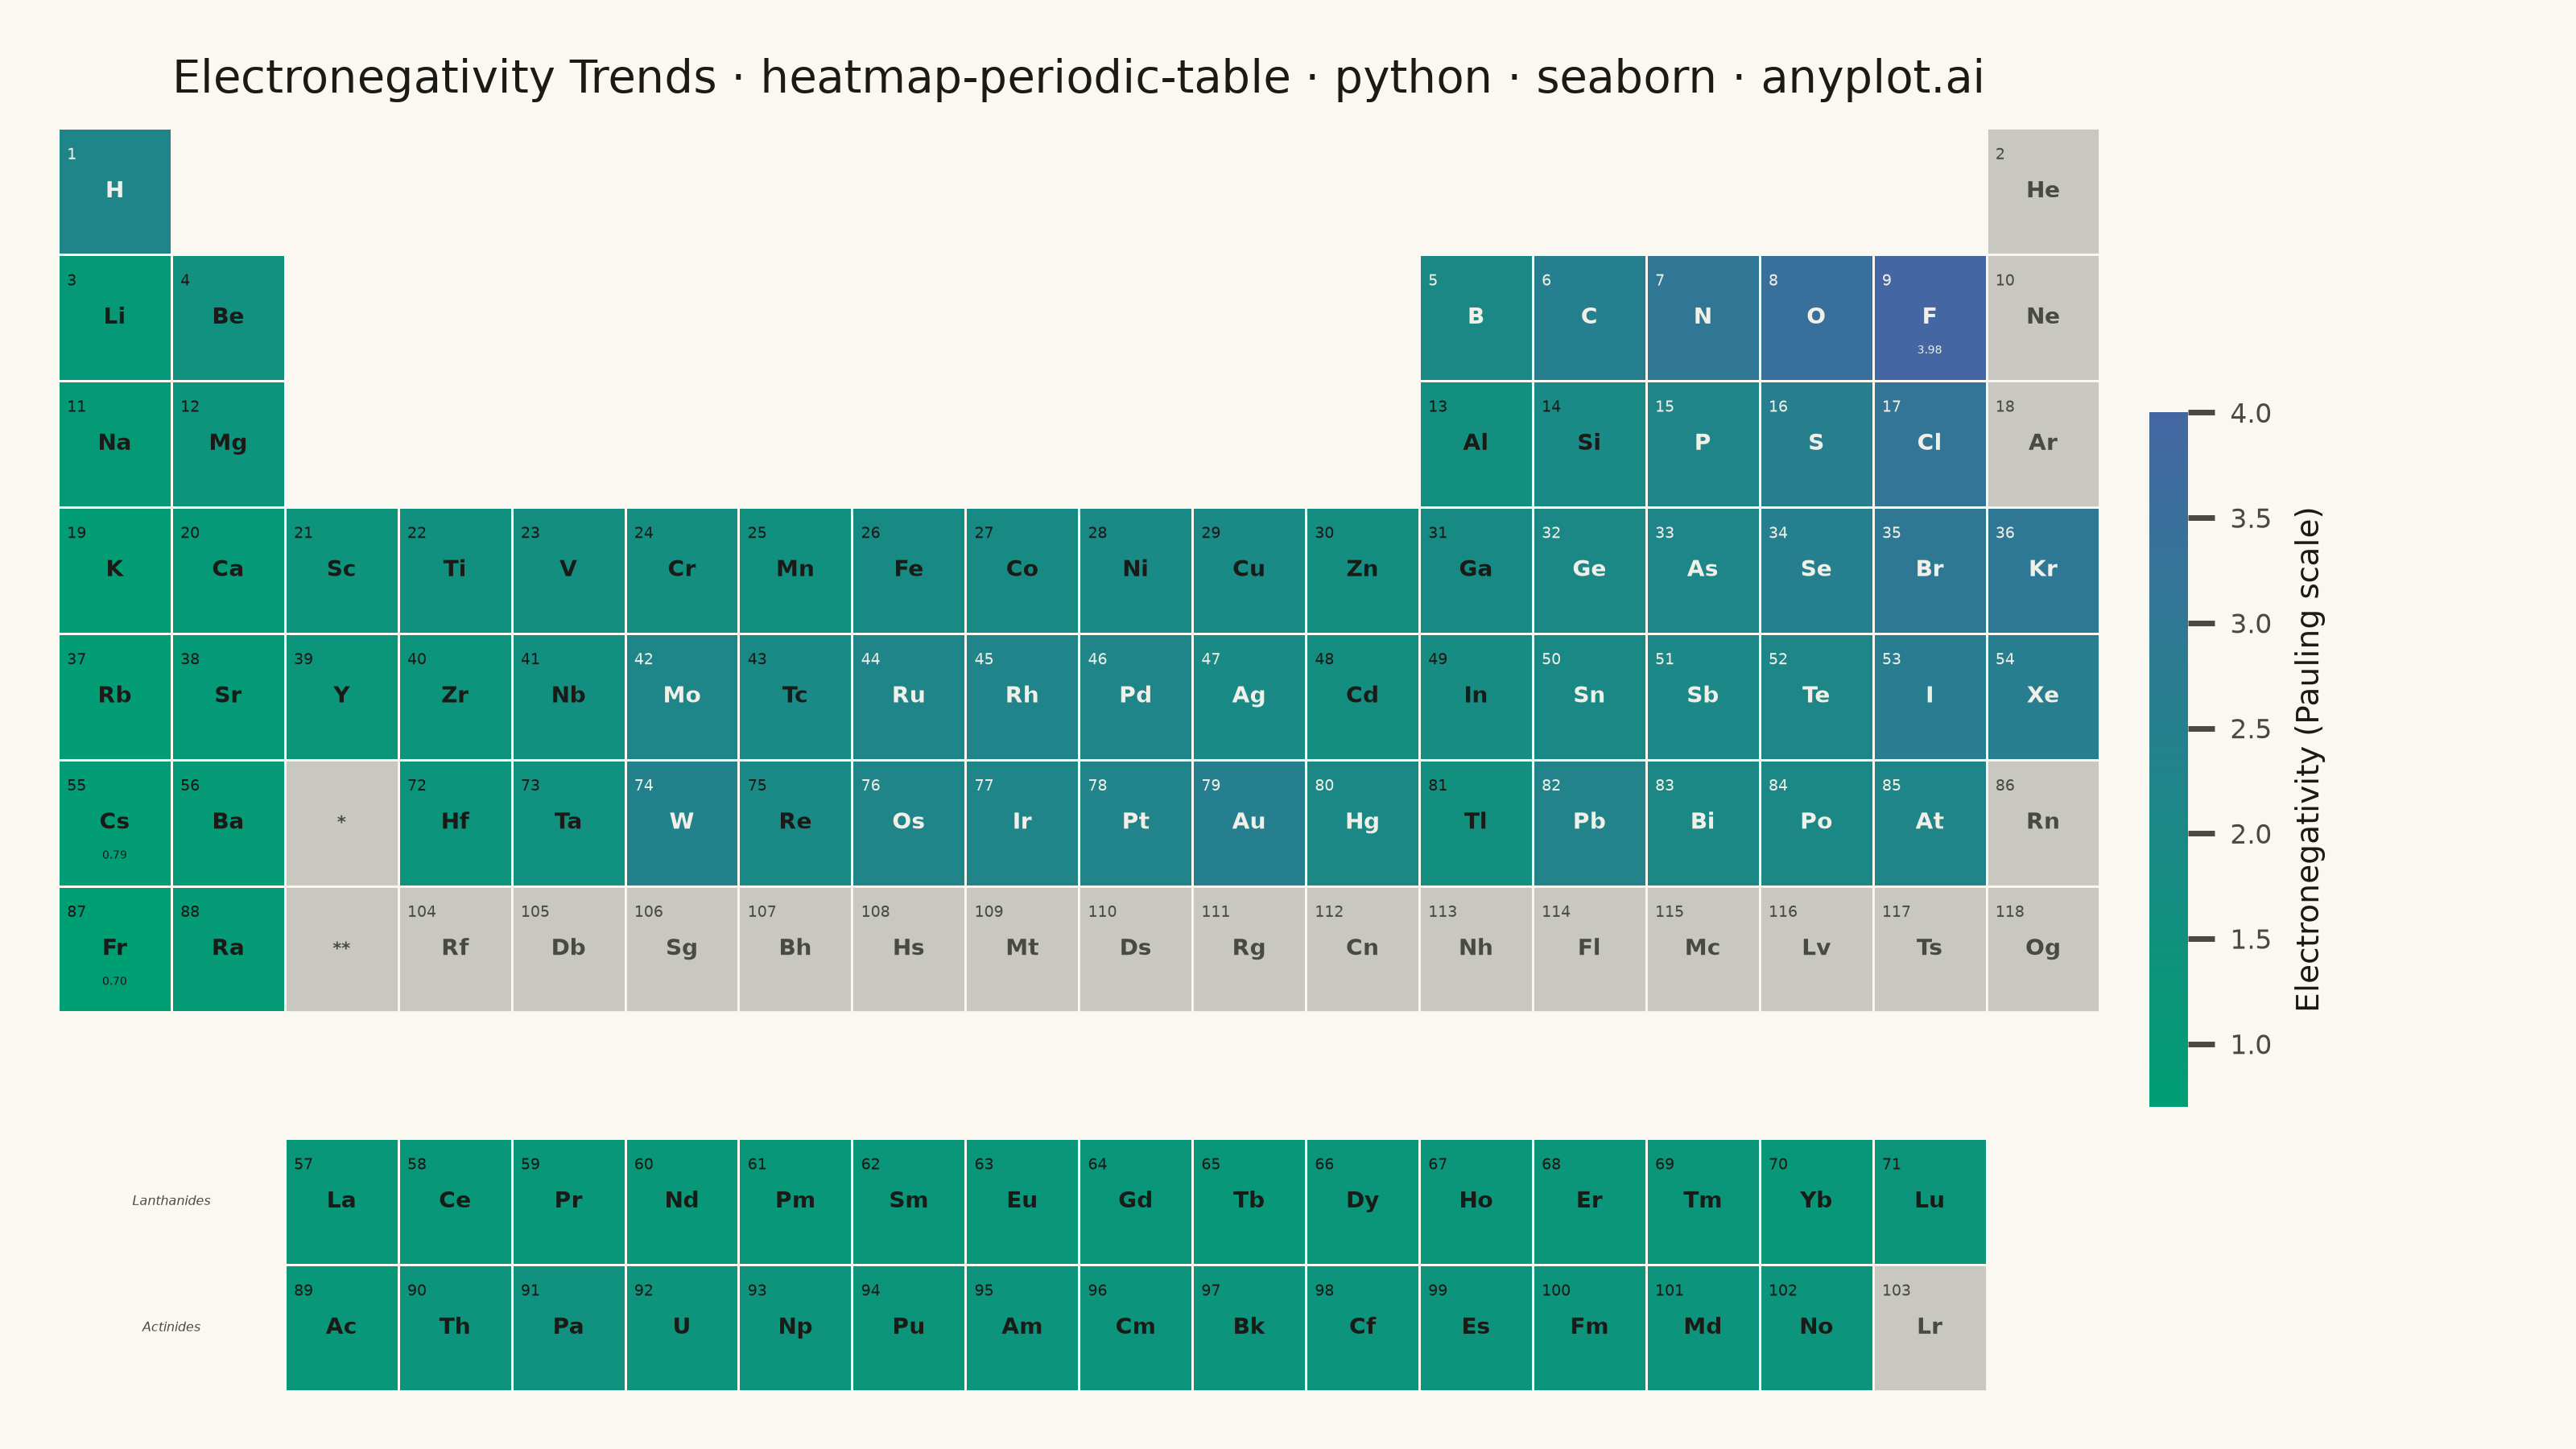
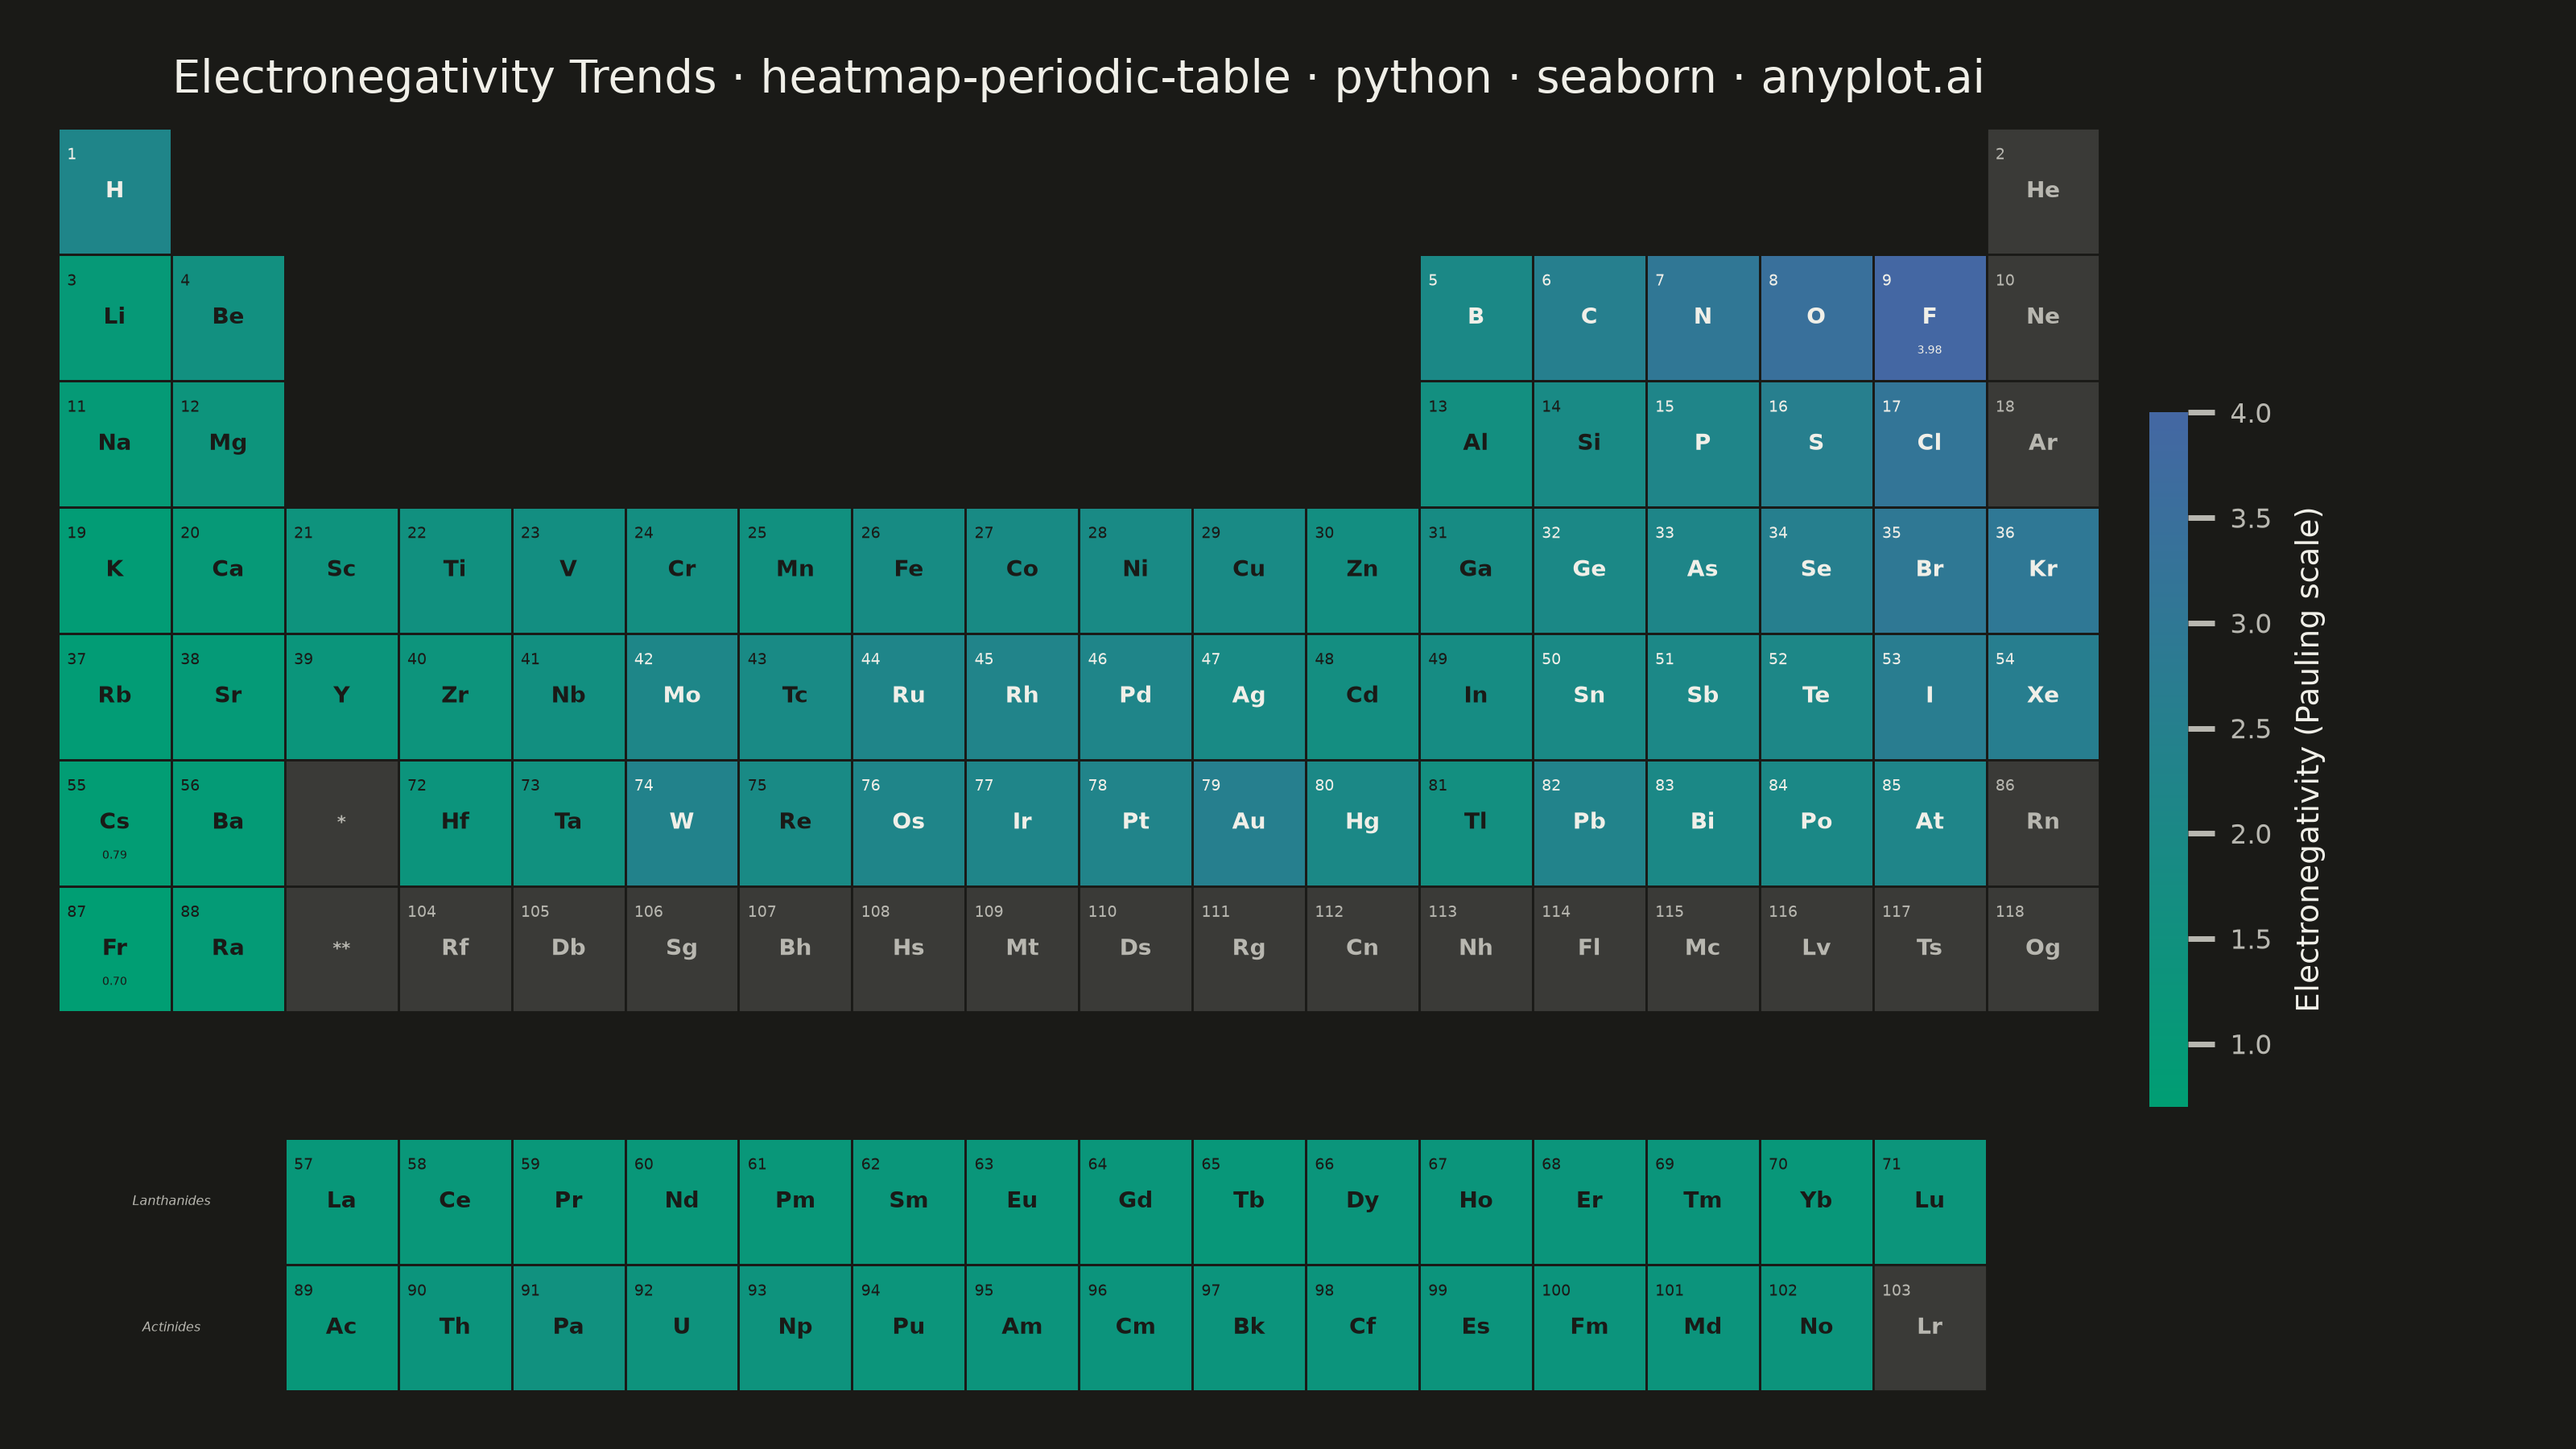
A periodic table of the elements rendered in its canonical layout — 18 groups across by 7 periods down, with the lanthanide and actinide series detached as two separate rows below — where each element tile is colored by a continuous property such as electronegativity, atomic radius, melting point, or first ionization energy. A colorbar maps tile color to property value, and every tile carries the element symbol and atomic number, optionally with the numeric property value. This visualization fuses an immediately recognizable fixed grid with heatmap encoding, turning a familiar reference chart into a tool for spotting periodic trends at a glance.
""" anyplot.ai
heatmap-periodic-table: Periodic Table Property Heatmap
Library: seaborn 0.13.2 | Python 3.13.13
Quality: 90/100 | Created: 2026-06-15
"""

import os
import sys


# Prevent local seaborn.py from shadowing the installed package
_script_dir = os.path.dirname(os.path.abspath(__file__))
for _p in (_script_dir, "", "."):
    if _p in sys.path:
        sys.path.remove(_p)

import matplotlib.pyplot as plt
import numpy as np
import seaborn as sns
from matplotlib.colors import LinearSegmentedColormap, Normalize


THEME = os.getenv("ANYPLOT_THEME", "light")
PAGE_BG = "#FAF8F1" if THEME == "light" else "#1A1A17"
ELEVATED_BG = "#FFFDF6" if THEME == "light" else "#242420"
INK = "#1A1A17" if THEME == "light" else "#F0EFE8"
INK_SOFT = "#4A4A44" if THEME == "light" else "#B8B7B0"
GREY_TILE = "#C8C7C0" if THEME == "light" else "#3A3A37"

sns.set_theme(
    style="ticks",
    rc={
        "figure.facecolor": PAGE_BG,
        "axes.facecolor": PAGE_BG,
        "axes.edgecolor": INK_SOFT,
        "axes.labelcolor": INK,
        "text.color": INK,
        "xtick.color": INK_SOFT,
        "ytick.color": INK_SOFT,
    },
)

# Data: (symbol, atomic_number, period, group, pauling_electronegativity)
# Lanthanides/actinides use period=8/9 so they land at grid rows 8/9
# (gap row 7 creates visual separation from the main body)
elements = [
    ("H", 1, 1, 1, 2.20),
    ("He", 2, 1, 18, None),
    ("Li", 3, 2, 1, 0.98),
    ("Be", 4, 2, 2, 1.57),
    ("B", 5, 2, 13, 2.04),
    ("C", 6, 2, 14, 2.55),
    ("N", 7, 2, 15, 3.04),
    ("O", 8, 2, 16, 3.44),
    ("F", 9, 2, 17, 3.98),
    ("Ne", 10, 2, 18, None),
    ("Na", 11, 3, 1, 0.93),
    ("Mg", 12, 3, 2, 1.31),
    ("Al", 13, 3, 13, 1.61),
    ("Si", 14, 3, 14, 1.90),
    ("P", 15, 3, 15, 2.19),
    ("S", 16, 3, 16, 2.58),
    ("Cl", 17, 3, 17, 3.16),
    ("Ar", 18, 3, 18, None),
    ("K", 19, 4, 1, 0.82),
    ("Ca", 20, 4, 2, 1.00),
    ("Sc", 21, 4, 3, 1.36),
    ("Ti", 22, 4, 4, 1.54),
    ("V", 23, 4, 5, 1.63),
    ("Cr", 24, 4, 6, 1.66),
    ("Mn", 25, 4, 7, 1.55),
    ("Fe", 26, 4, 8, 1.83),
    ("Co", 27, 4, 9, 1.88),
    ("Ni", 28, 4, 10, 1.91),
    ("Cu", 29, 4, 11, 1.90),
    ("Zn", 30, 4, 12, 1.65),
    ("Ga", 31, 4, 13, 1.81),
    ("Ge", 32, 4, 14, 2.01),
    ("As", 33, 4, 15, 2.18),
    ("Se", 34, 4, 16, 2.55),
    ("Br", 35, 4, 17, 2.96),
    ("Kr", 36, 4, 18, 3.00),
    ("Rb", 37, 5, 1, 0.82),
    ("Sr", 38, 5, 2, 0.95),
    ("Y", 39, 5, 3, 1.22),
    ("Zr", 40, 5, 4, 1.33),
    ("Nb", 41, 5, 5, 1.60),
    ("Mo", 42, 5, 6, 2.16),
    ("Tc", 43, 5, 7, 1.90),
    ("Ru", 44, 5, 8, 2.20),
    ("Rh", 45, 5, 9, 2.28),
    ("Pd", 46, 5, 10, 2.20),
    ("Ag", 47, 5, 11, 1.93),
    ("Cd", 48, 5, 12, 1.69),
    ("In", 49, 5, 13, 1.78),
    ("Sn", 50, 5, 14, 1.96),
    ("Sb", 51, 5, 15, 2.05),
    ("Te", 52, 5, 16, 2.10),
    ("I", 53, 5, 17, 2.66),
    ("Xe", 54, 5, 18, 2.60),
    ("Cs", 55, 6, 1, 0.79),
    ("Ba", 56, 6, 2, 0.89),
    # period 6, group 3 left empty (lanthanide placeholder added separately)
    ("Hf", 72, 6, 4, 1.30),
    ("Ta", 73, 6, 5, 1.50),
    ("W", 74, 6, 6, 2.36),
    ("Re", 75, 6, 7, 1.90),
    ("Os", 76, 6, 8, 2.20),
    ("Ir", 77, 6, 9, 2.20),
    ("Pt", 78, 6, 10, 2.28),
    ("Au", 79, 6, 11, 2.54),
    ("Hg", 80, 6, 12, 2.00),
    ("Tl", 81, 6, 13, 1.62),
    ("Pb", 82, 6, 14, 2.33),
    ("Bi", 83, 6, 15, 2.02),
    ("Po", 84, 6, 16, 2.00),
    ("At", 85, 6, 17, 2.20),
    ("Rn", 86, 6, 18, None),
    ("Fr", 87, 7, 1, 0.70),
    ("Ra", 88, 7, 2, 0.90),
    # period 7, group 3 left empty (actinide placeholder added separately)
    ("Rf", 104, 7, 4, None),
    ("Db", 105, 7, 5, None),
    ("Sg", 106, 7, 6, None),
    ("Bh", 107, 7, 7, None),
    ("Hs", 108, 7, 8, None),
    ("Mt", 109, 7, 9, None),
    ("Ds", 110, 7, 10, None),
    ("Rg", 111, 7, 11, None),
    ("Cn", 112, 7, 12, None),
    ("Nh", 113, 7, 13, None),
    ("Fl", 114, 7, 14, None),
    ("Mc", 115, 7, 15, None),
    ("Lv", 116, 7, 16, None),
    ("Ts", 117, 7, 17, None),
    ("Og", 118, 7, 18, None),
    # Lanthanides (La–Lu) in detached f-block row 8
    ("La", 57, 8, 3, 1.10),
    ("Ce", 58, 8, 4, 1.12),
    ("Pr", 59, 8, 5, 1.13),
    ("Nd", 60, 8, 6, 1.14),
    ("Pm", 61, 8, 7, 1.13),
    ("Sm", 62, 8, 8, 1.17),
    ("Eu", 63, 8, 9, 1.20),
    ("Gd", 64, 8, 10, 1.20),
    ("Tb", 65, 8, 11, 1.10),
    ("Dy", 66, 8, 12, 1.22),
    ("Ho", 67, 8, 13, 1.23),
    ("Er", 68, 8, 14, 1.24),
    ("Tm", 69, 8, 15, 1.25),
    ("Yb", 70, 8, 16, 1.10),
    ("Lu", 71, 8, 17, 1.27),
    # Actinides (Ac–Lr) in detached f-block row 9
    ("Ac", 89, 9, 3, 1.10),
    ("Th", 90, 9, 4, 1.30),
    ("Pa", 91, 9, 5, 1.50),
    ("U", 92, 9, 6, 1.38),
    ("Np", 93, 9, 7, 1.36),
    ("Pu", 94, 9, 8, 1.28),
    ("Am", 95, 9, 9, 1.30),
    ("Cm", 96, 9, 10, 1.30),
    ("Bk", 97, 9, 11, 1.30),
    ("Cf", 98, 9, 12, 1.30),
    ("Es", 99, 9, 13, 1.30),
    ("Fm", 100, 9, 14, 1.30),
    ("Md", 101, 9, 15, 1.30),
    ("No", 102, 9, 16, 1.30),
    ("Lr", 103, 9, 17, None),
]

# Build 10×18 grid: periods 1–7 → rows 0–6; row 7 = gap; rows 8–9 = f-block
n_rows, n_cols = 10, 18
grid_values = np.full((n_rows, n_cols), np.nan)
cell_info = {}

for sym, anum, period, group, en in elements:
    row = period - 1 if period <= 7 else period
    col = group - 1
    cell_info[(row, col)] = (sym, anum, en)
    if en is not None:
        grid_values[row, col] = en

# Placeholder tiles at group 3 for periods 6 and 7 (f-block reference)
cell_info[(5, 2)] = ("*", None, None)
cell_info[(6, 2)] = ("**", None, None)

# Imprint sequential colormap: green (#009E73) → blue (#4467A3)
imprint_seq = LinearSegmentedColormap.from_list("imprint_seq", ["#009E73", "#4467A3"])
norm = Normalize(vmin=0.7, vmax=4.0)

# Build seaborn annot array: symbols for EN-valued cells (seaborn handles coloring via annot)
symbol_grid = np.full((n_rows, n_cols), "", dtype=object)
for (row, col), (sym, _anum, en) in cell_info.items():
    if en is not None:
        symbol_grid[row, col] = sym

# Pre-compute WCAG luminance-based text colors for all EN-valued cells
lum_map = {}
for (row, col), (_sym, _anum, en) in cell_info.items():
    if en is not None:
        rgba = imprint_seq(norm(en))
        r, g, b = rgba[0], rgba[1], rgba[2]
        r_l = r / 12.92 if r <= 0.04045 else ((r + 0.055) / 1.055) ** 2.4
        g_l = g / 12.92 if g <= 0.04045 else ((g + 0.055) / 1.055) ** 2.4
        b_l = b / 12.92 if b <= 0.04045 else ((b + 0.055) / 1.055) ** 2.4
        lum = 0.2126 * r_l + 0.7152 * g_l + 0.0722 * b_l
        lum_map[(row, col)] = "#1A1A17" if lum > 0.20 else "#F0EFE8"

# Canvas: landscape 3200×1800 (periodic table is 18:10, not square)
title = "Electronegativity Trends · heatmap-periodic-table · python · seaborn · anyplot.ai"
title_fs = max(8, round(12 * 67 / len(title)))

fig, ax = plt.subplots(figsize=(8, 4.5), dpi=400, facecolor=PAGE_BG)
ax.set_facecolor(PAGE_BG)

# Plot — use seaborn annot parameter with custom symbol array (idiomatic seaborn annotation)
sns.heatmap(
    grid_values,
    ax=ax,
    cmap=imprint_seq,
    mask=np.isnan(grid_values),
    linewidths=0.5,
    linecolor=PAGE_BG,
    vmin=0.7,
    vmax=4.0,
    cbar=True,
    cbar_kws={"shrink": 0.55, "pad": 0.02, "aspect": 18},
    annot=symbol_grid,
    fmt="",
    annot_kws={"fontsize": 5.0, "fontweight": "bold"},
    xticklabels=False,
    yticklabels=False,
)

# Update text colors for seaborn-generated symbol annotations via WCAG luminance
for txt_obj in ax.texts:
    x, y = txt_obj.get_position()
    row, col = int(y), int(x)
    txt_obj.set_color(lum_map.get((row, col), INK_SOFT))

# Style: grey tiles for elements with no defined electronegativity (noble gases, synthetic)
for (row, col), (_sym, _anum, en) in cell_info.items():
    if en is None:
        rect = plt.Rectangle((col, row), 1, 1, facecolor=GREY_TILE, edgecolor=PAGE_BG, linewidth=0.5, zorder=2)
        ax.add_patch(rect)

# Text annotations: atomic numbers (all cells) + symbols for masked cells
for (row, col), (sym, anum, en) in cell_info.items():
    txt_col = lum_map.get((row, col), INK_SOFT)

    # Atomic number top-left corner — increased to 3.5pt for readability
    if anum is not None:
        ax.text(col + 0.08, row + 0.15, str(anum), ha="left", va="top", fontsize=3.5, color=txt_col, zorder=3)

    # Symbol for masked cells (seaborn annot skips masked/NaN cells)
    if en is None:
        sym_fs = 5.0 if sym not in ("*", "**") else 3.8
        ax.text(
            col + 0.5,
            row + 0.5,
            sym,
            ha="center",
            va="center",
            fontsize=sym_fs,
            color=txt_col,
            fontweight="bold",
            zorder=3,
        )

# EN value labels for max (F: 3.98) and min (Cs: 0.79, Fr: 0.70) — trend storytelling
for ann_row, ann_col, ann_val in [(1, 16, "3.98"), (5, 0, "0.79"), (6, 0, "0.70")]:
    txt_col = lum_map.get((ann_row, ann_col), INK)
    ax.text(ann_col + 0.5, ann_row + 0.76, ann_val, ha="center", va="center", fontsize=2.5, color=txt_col, zorder=4)

# Lanthanides / Actinides group labels in the empty left columns of f-block rows
ax.text(1.0, 8.5, "Lanthanides", ha="center", va="center", fontsize=2.8, color=INK_SOFT, style="italic", zorder=3)
ax.text(1.0, 9.5, "Actinides", ha="center", va="center", fontsize=2.8, color=INK_SOFT, style="italic", zorder=3)

# Colorbar styling
cbar = ax.collections[0].colorbar
cbar.set_label("Electronegativity (Pauling scale)", color=INK, fontsize=7, labelpad=5)
cbar.ax.tick_params(colors=INK_SOFT, labelsize=6)
for spine in cbar.ax.spines.values():
    spine.set_edgecolor(INK_SOFT)

# Axes cleanup
for spine in ax.spines.values():
    spine.set_visible(False)
ax.set_xlabel("")
ax.set_ylabel("")
ax.set_title(title, fontsize=title_fs, color=INK, fontweight="medium", pad=8)

plt.tight_layout()
plt.savefig(f"plot-{THEME}.png", dpi=400, facecolor=PAGE_BG)
plt.close()
Runnable source as JSON, for any HTTP client: https://api.anyplot.ai/specs/heatmap-periodic-table/seaborn/code. Any spec id and library id listed in llms-full.txt fit the same URL shape; every URL below is complete and callable.
{
  "spec_id": "heatmap-periodic-table",
  "language": "python",
  "library": "seaborn",
  "page": "https://anyplot.ai/heatmap-periodic-table/python/seaborn",
  "hub": "https://anyplot.ai/heatmap-periodic-table",
  "code_json": "https://api.anyplot.ai/specs/heatmap-periodic-table/seaborn/code",
  "spec_json": "https://api.anyplot.ai/specs/heatmap-periodic-table",
  "render_light_png": "https://storage.googleapis.com/anyplot-images/plots/heatmap-periodic-table/python/seaborn/plot-light.png",
  "render_dark_png": "https://storage.googleapis.com/anyplot-images/plots/heatmap-periodic-table/python/seaborn/plot-dark.png",
  "quality_score": 90.0,
  "license": "MIT",
  "guide": "https://anyplot.ai/llms.txt"
}
Part of Periodic Table Property Heatmap on anyplot.ai.