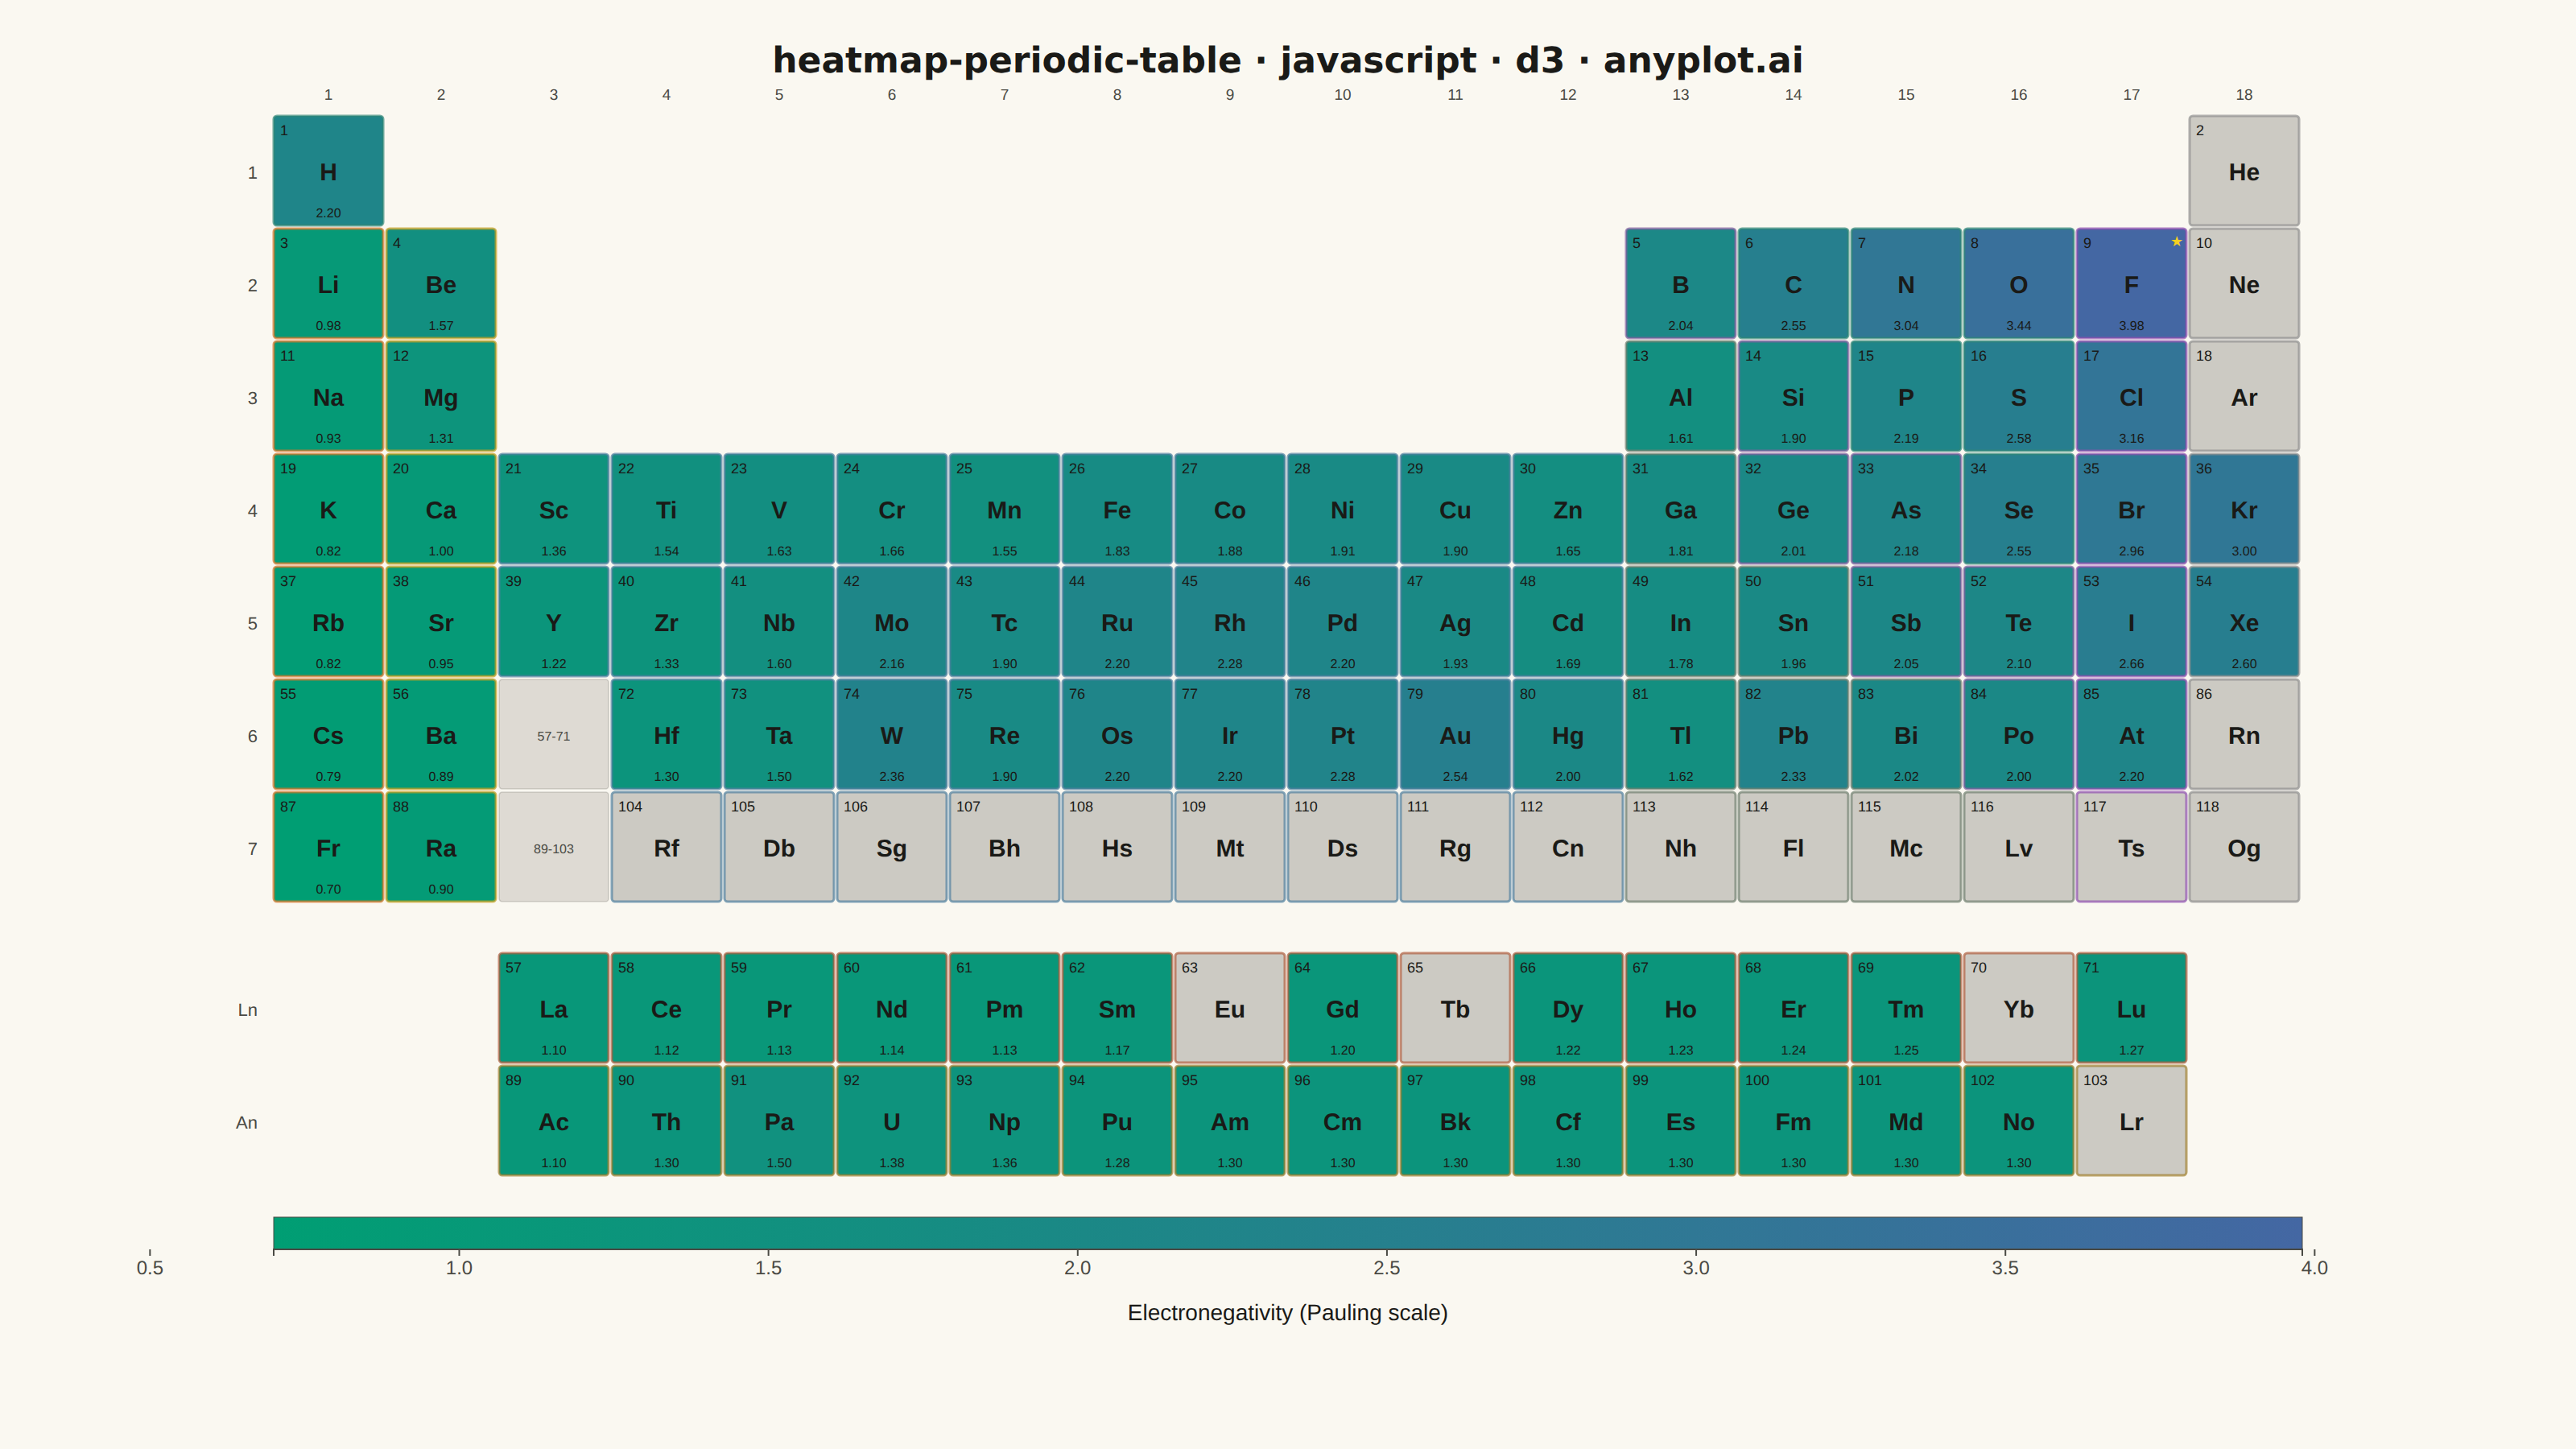
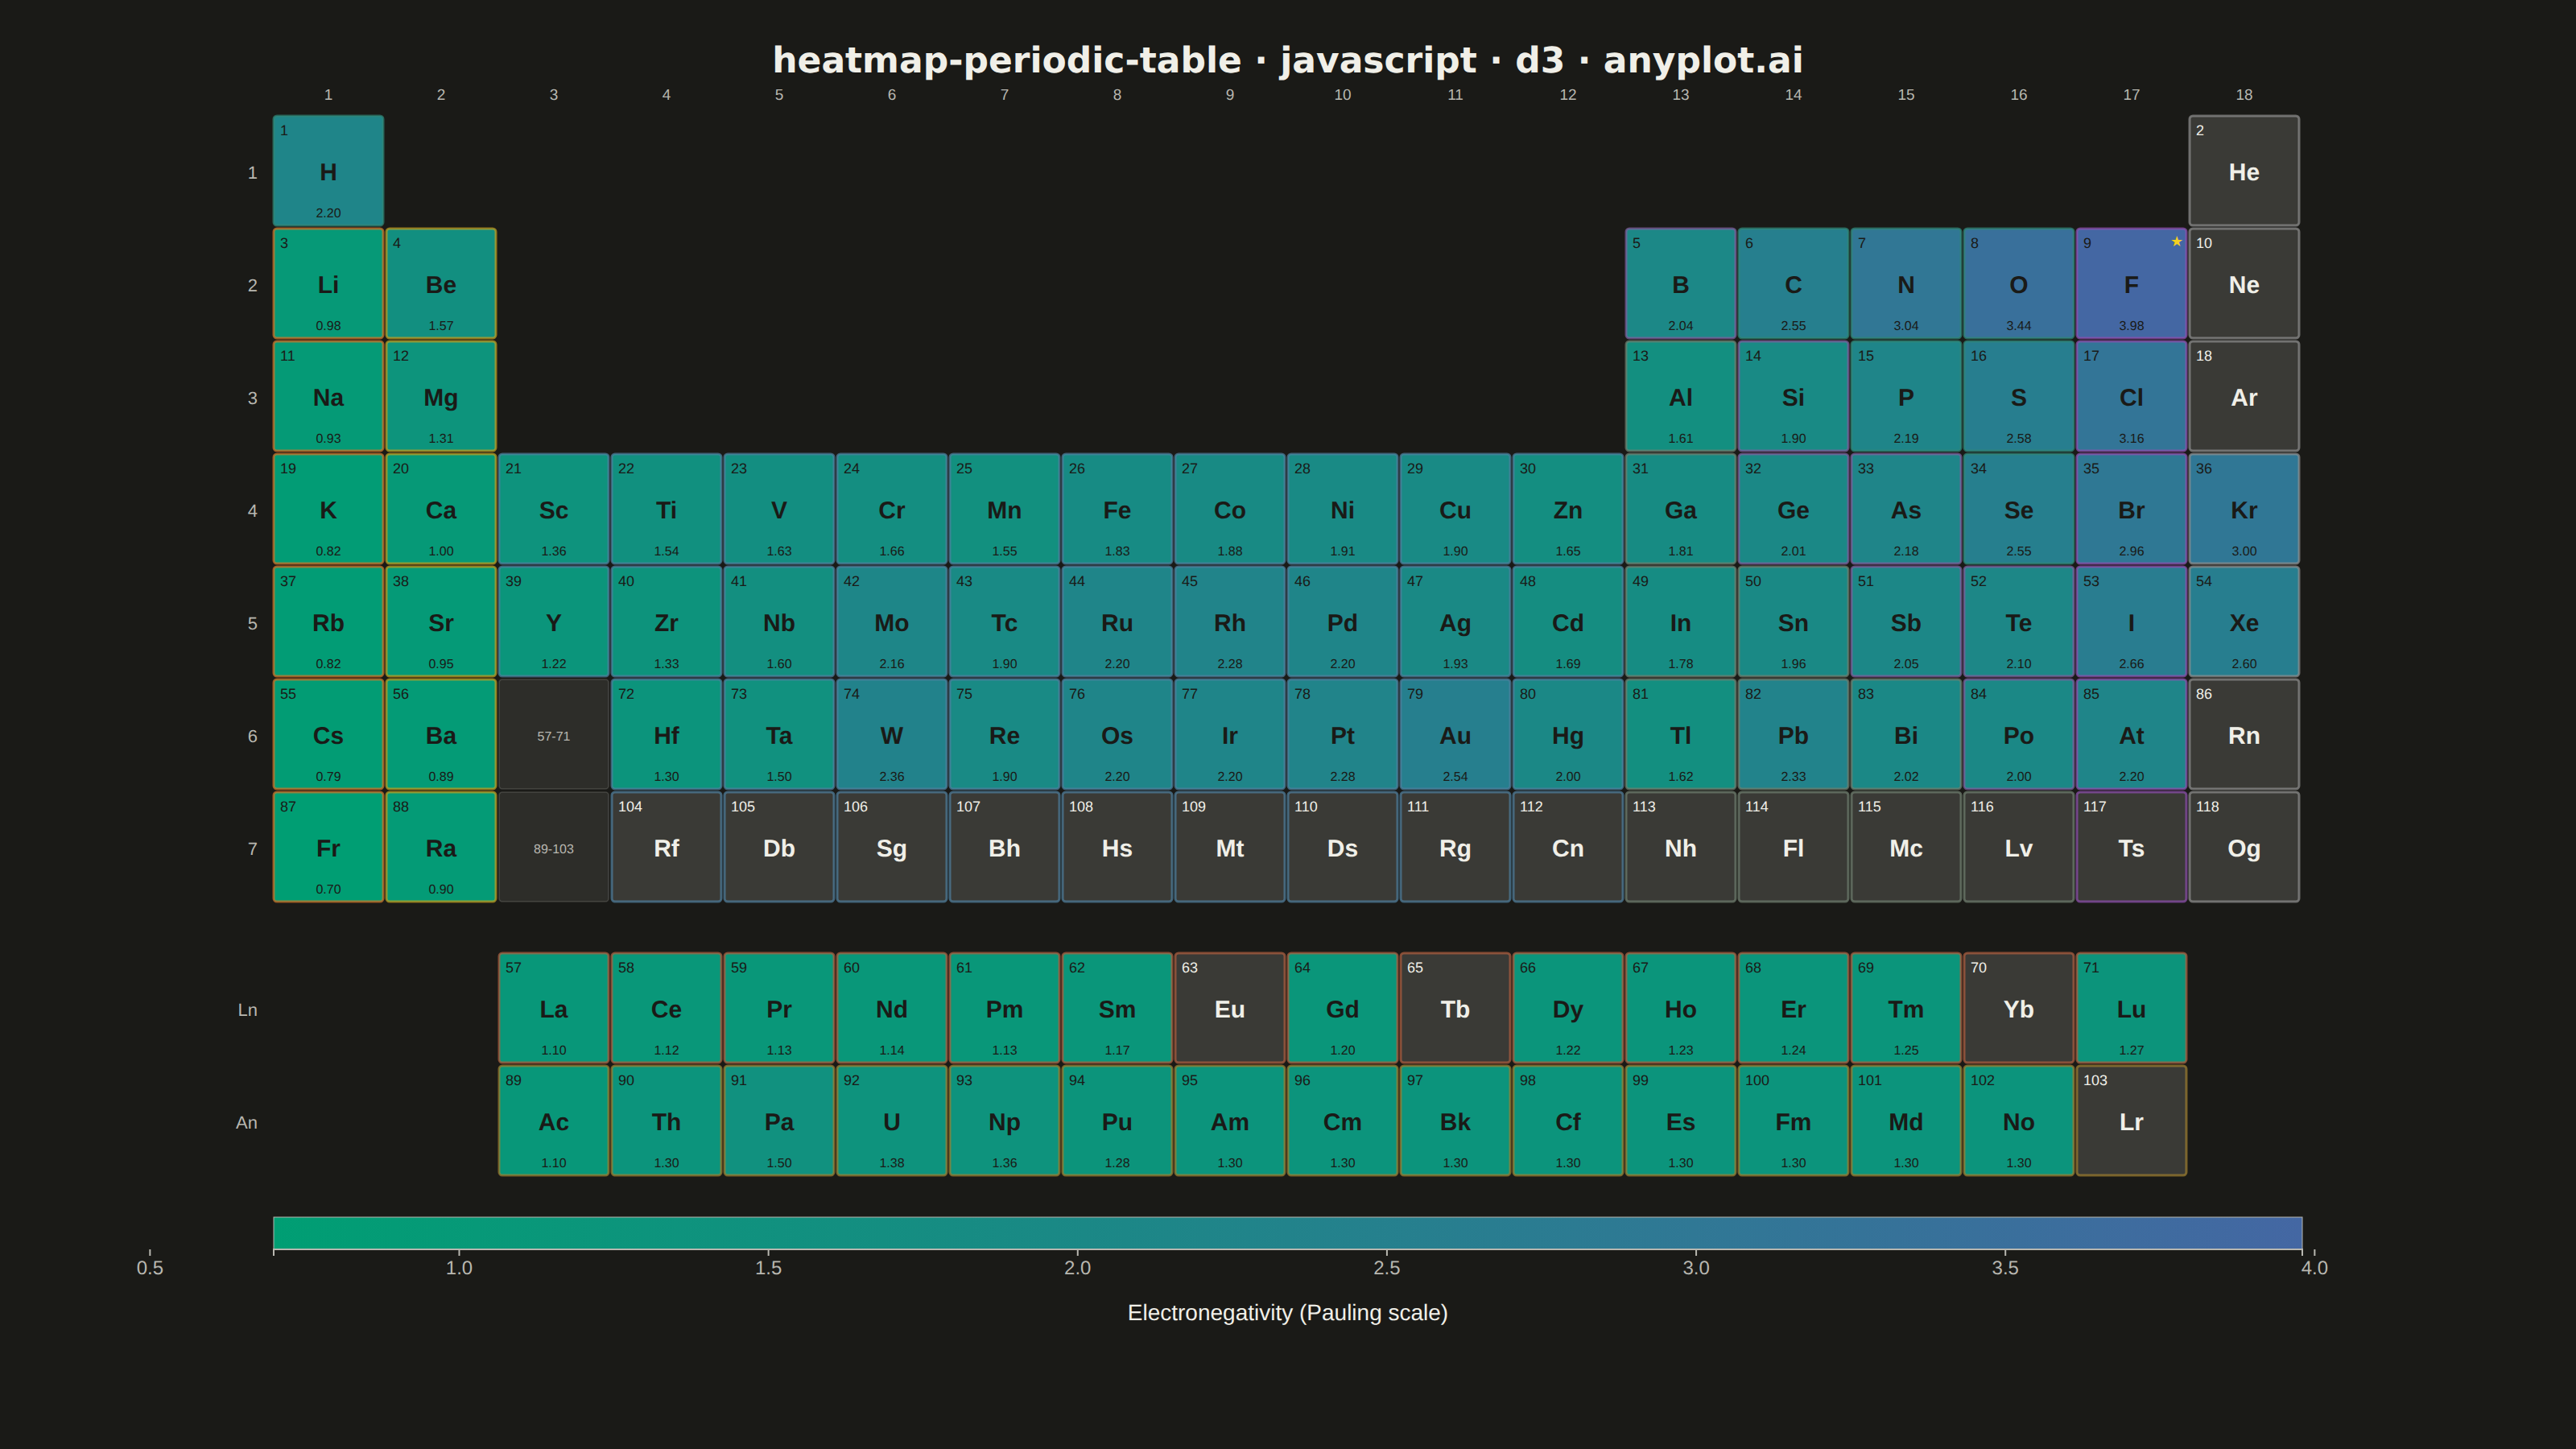
A periodic table of the elements rendered in its canonical layout — 18 groups across by 7 periods down, with the lanthanide and actinide series detached as two separate rows below — where each element tile is colored by a continuous property such as electronegativity, atomic radius, melting point, or first ionization energy. A colorbar maps tile color to property value, and every tile carries the element symbol and atomic number, optionally with the numeric property value. This visualization fuses an immediately recognizable fixed grid with heatmap encoding, turning a familiar reference chart into a tool for spotting periodic trends at a glance.
// anyplot.ai
// heatmap-periodic-table: Periodic Table Property Heatmap
// Library: d3 7.9.0 | JavaScript 22.22.3
// Quality: 88/100 | Created: 2026-06-15

const t = window.ANYPLOT_TOKENS;
const { width, height } = window.ANYPLOT_SIZE;
const THEME = window.ANYPLOT_THEME;

// --- Element data: [atomic_number, symbol, period, group, electronegativity, category]
// Categories: a=alkali, e=alkaline-earth, t=transition, p=post-transition,
//             m=metalloid, n=nonmetal, h=halogen, g=noble-gas, l=lanthanide, c=actinide
// period 8 = lanthanide f-block row, period 9 = actinide f-block row
const elements = [
  // Period 1
  [1,"H",1,1,2.20,"n"],[2,"He",1,18,null,"g"],
  // Period 2
  [3,"Li",2,1,0.98,"a"],[4,"Be",2,2,1.57,"e"],
  [5,"B",2,13,2.04,"m"],[6,"C",2,14,2.55,"n"],[7,"N",2,15,3.04,"n"],
  [8,"O",2,16,3.44,"n"],[9,"F",2,17,3.98,"h"],[10,"Ne",2,18,null,"g"],
  // Period 3
  [11,"Na",3,1,0.93,"a"],[12,"Mg",3,2,1.31,"e"],
  [13,"Al",3,13,1.61,"p"],[14,"Si",3,14,1.90,"m"],[15,"P",3,15,2.19,"n"],
  [16,"S",3,16,2.58,"n"],[17,"Cl",3,17,3.16,"h"],[18,"Ar",3,18,null,"g"],
  // Period 4
  [19,"K",4,1,0.82,"a"],[20,"Ca",4,2,1.00,"e"],
  [21,"Sc",4,3,1.36,"t"],[22,"Ti",4,4,1.54,"t"],[23,"V",4,5,1.63,"t"],
  [24,"Cr",4,6,1.66,"t"],[25,"Mn",4,7,1.55,"t"],[26,"Fe",4,8,1.83,"t"],
  [27,"Co",4,9,1.88,"t"],[28,"Ni",4,10,1.91,"t"],[29,"Cu",4,11,1.90,"t"],
  [30,"Zn",4,12,1.65,"t"],[31,"Ga",4,13,1.81,"p"],[32,"Ge",4,14,2.01,"m"],
  [33,"As",4,15,2.18,"m"],[34,"Se",4,16,2.55,"n"],[35,"Br",4,17,2.96,"h"],
  [36,"Kr",4,18,3.00,"g"],
  // Period 5
  [37,"Rb",5,1,0.82,"a"],[38,"Sr",5,2,0.95,"e"],
  [39,"Y",5,3,1.22,"t"],[40,"Zr",5,4,1.33,"t"],[41,"Nb",5,5,1.60,"t"],
  [42,"Mo",5,6,2.16,"t"],[43,"Tc",5,7,1.90,"t"],[44,"Ru",5,8,2.20,"t"],
  [45,"Rh",5,9,2.28,"t"],[46,"Pd",5,10,2.20,"t"],[47,"Ag",5,11,1.93,"t"],
  [48,"Cd",5,12,1.69,"t"],[49,"In",5,13,1.78,"p"],[50,"Sn",5,14,1.96,"p"],
  [51,"Sb",5,15,2.05,"m"],[52,"Te",5,16,2.10,"m"],[53,"I",5,17,2.66,"h"],
  [54,"Xe",5,18,2.60,"g"],
  // Period 6 (main table — group 3 is lanthanide placeholder)
  [55,"Cs",6,1,0.79,"a"],[56,"Ba",6,2,0.89,"e"],
  [72,"Hf",6,4,1.30,"t"],[73,"Ta",6,5,1.50,"t"],[74,"W",6,6,2.36,"t"],
  [75,"Re",6,7,1.90,"t"],[76,"Os",6,8,2.20,"t"],[77,"Ir",6,9,2.20,"t"],
  [78,"Pt",6,10,2.28,"t"],[79,"Au",6,11,2.54,"t"],[80,"Hg",6,12,2.00,"t"],
  [81,"Tl",6,13,1.62,"p"],[82,"Pb",6,14,2.33,"p"],[83,"Bi",6,15,2.02,"p"],
  [84,"Po",6,16,2.00,"m"],[85,"At",6,17,2.20,"h"],[86,"Rn",6,18,null,"g"],
  // Period 7 (main table — group 3 is actinide placeholder)
  [87,"Fr",7,1,0.70,"a"],[88,"Ra",7,2,0.90,"e"],
  [104,"Rf",7,4,null,"t"],[105,"Db",7,5,null,"t"],[106,"Sg",7,6,null,"t"],
  [107,"Bh",7,7,null,"t"],[108,"Hs",7,8,null,"t"],[109,"Mt",7,9,null,"t"],
  [110,"Ds",7,10,null,"t"],[111,"Rg",7,11,null,"t"],[112,"Cn",7,12,null,"t"],
  [113,"Nh",7,13,null,"p"],[114,"Fl",7,14,null,"p"],[115,"Mc",7,15,null,"p"],
  [116,"Lv",7,16,null,"p"],[117,"Ts",7,17,null,"h"],[118,"Og",7,18,null,"g"],
  // Lanthanides (f-block row, period=8, group=position 1-15)
  [57,"La",8,1,1.10,"l"],[58,"Ce",8,2,1.12,"l"],[59,"Pr",8,3,1.13,"l"],
  [60,"Nd",8,4,1.14,"l"],[61,"Pm",8,5,1.13,"l"],[62,"Sm",8,6,1.17,"l"],
  [63,"Eu",8,7,null,"l"],[64,"Gd",8,8,1.20,"l"],[65,"Tb",8,9,null,"l"],
  [66,"Dy",8,10,1.22,"l"],[67,"Ho",8,11,1.23,"l"],[68,"Er",8,12,1.24,"l"],
  [69,"Tm",8,13,1.25,"l"],[70,"Yb",8,14,null,"l"],[71,"Lu",8,15,1.27,"l"],
  // Actinides (f-block row, period=9, group=position 1-15)
  [89,"Ac",9,1,1.10,"c"],[90,"Th",9,2,1.30,"c"],[91,"Pa",9,3,1.50,"c"],
  [92,"U",9,4,1.38,"c"],[93,"Np",9,5,1.36,"c"],[94,"Pu",9,6,1.28,"c"],
  [95,"Am",9,7,1.30,"c"],[96,"Cm",9,8,1.30,"c"],[97,"Bk",9,9,1.30,"c"],
  [98,"Cf",9,10,1.30,"c"],[99,"Es",9,11,1.30,"c"],[100,"Fm",9,12,1.30,"c"],
  [101,"Md",9,13,1.30,"c"],[102,"No",9,14,1.30,"c"],[103,"Lr",9,15,null,"c"],
];

// --- Category border colors (muted accents differentiating element families)
const CAT_COLOR = {
  a: "#D4762A",  // alkali metals: amber-orange
  e: "#C4A020",  // alkaline earth: golden
  t: "#5080A0",  // transition metals: steel blue
  p: "#708070",  // post-transition: sage
  m: "#8060A0",  // metalloids: violet
  n: "#308878",  // nonmetals: teal-green
  h: "#9050B0",  // halogens: purple
  g: "#909090",  // noble gases: gray
  l: "#B06040",  // lanthanides: terra cotta
  c: "#A08030",  // actinides: bronze
};

// --- Layout (landscape 1600×900 CSS → 3200×1800 PNG at dpr=2)
const TILE = 70;
const INNER = 68;
const MAIN_LEFT = (width - 18 * TILE) / 2;   // (1600-1260)/2 = 170
const MAIN_TOP = 72;
const FB_LEFT = MAIN_LEFT + 2 * TILE;          // f-block aligns under group-3 placeholder
const FB_TOP = MAIN_TOP + 7 * TILE + 30;
const CB_TOP = FB_TOP + 2 * TILE + 24;
const CB_H = 20;
const CB_W = 18 * TILE;

// --- Color scale: imprint_seq (green → blue) for Pauling electronegativity
const knownVals = elements.filter(d => d[4] !== null).map(d => d[4]);
const valMin = Math.min(...knownVals);  // Fr: 0.70
const valMax = Math.max(...knownVals);  // F:  3.98
const colorScale = d3.scaleSequential()
  .domain([valMin, valMax])
  .interpolator(d3.interpolateRgbBasis(t.seq));

// --- SVG
const svg = d3.select("#container")
  .append("svg").attr("width", width).attr("height", height);

// --- Colorbar linearGradient definition (idiomatic SVG — single rect, no rect-per-step)
const defs = svg.append("defs");
const grad = defs.append("linearGradient")
  .attr("id", "cb-grad")
  .attr("x1", "0%").attr("x2", "100%")
  .attr("y1", "0%").attr("y2", "0%");
d3.range(11).forEach(i => {
  grad.append("stop")
    .attr("offset", `${i * 10}%`)
    .attr("stop-color", colorScale(valMin + (i / 10) * (valMax - valMin)));
});

// --- Title
svg.append("text")
  .attr("x", width / 2).attr("y", 45)
  .attr("text-anchor", "middle")
  .attr("fill", t.ink)
  .style("font-size", "22px").style("font-weight", "600")
  .style("font-family", "system-ui, sans-serif")
  .text("heatmap-periodic-table · javascript · d3 · anyplot.ai");

// --- Luminance-based text color for tile contrast (handles hex and rgb() strings)
function textOnFill(c) {
  let r, g, b;
  if (c[0] === "#") {
    r = parseInt(c.slice(1, 3), 16);
    g = parseInt(c.slice(3, 5), 16);
    b = parseInt(c.slice(5, 7), 16);
  } else {
    [r, g, b] = c.match(/\d+/g).map(Number);
  }
  return (0.2126 * r + 0.7152 * g + 0.0722 * b) / 255 > 0.38 ? "#1A1A17" : "#F0EFE8";
}

const EMPTY_FILL = THEME === "light" ? "#CCCAC3" : "#3A3A36";

// --- Idiomatic D3 data-join tile renderer
function drawTiles(sel, data, xFn, yFn) {
  const tileG = sel.selectAll("g.el-tile")
    .data(data)
    .join("g")
    .attr("class", "el-tile")
    .attr("transform", d => `translate(${xFn(d)},${yFn(d)})`);

  tileG.append("rect")
    .attr("width", INNER).attr("height", INNER).attr("rx", 2)
    .attr("fill", d => d[4] !== null ? colorScale(d[4]) : EMPTY_FILL)
    .attr("stroke", d => CAT_COLOR[d[5]] || "none")
    .attr("stroke-width", 1.5)
    .attr("stroke-opacity", 0.7);

  // atomic number — top-left
  tileG.append("text").attr("x", 4).attr("y", 12)
    .style("font-size", "9px").style("font-family", "sans-serif")
    .attr("fill", d => textOnFill(d[4] !== null ? colorScale(d[4]) : EMPTY_FILL))
    .text(d => d[0]);

  // element symbol — centered
  tileG.append("text")
    .attr("x", INNER / 2).attr("y", INNER / 2 + 6)
    .attr("text-anchor", "middle")
    .style("font-size", "15px").style("font-weight", "700")
    .style("font-family", "sans-serif")
    .attr("fill", d => textOnFill(d[4] !== null ? colorScale(d[4]) : EMPTY_FILL))
    .text(d => d[1]);

  // EN value — bottom center (known values only)
  tileG.filter(d => d[4] !== null)
    .append("text")
    .attr("x", INNER / 2).attr("y", INNER - 5)
    .attr("text-anchor", "middle")
    .style("font-size", "8px").style("font-family", "sans-serif")
    .attr("fill", d => textOnFill(colorScale(d[4])))
    .text(d => d[4].toFixed(2));

  return tileG;
}

// --- Main table: periods 1-7
const mainG = svg.append("g");
const mainTiles = drawTiles(
  mainG,
  elements.filter(d => d[2] <= 7),
  d => MAIN_LEFT + (d[3] - 1) * TILE,
  d => MAIN_TOP + (d[2] - 1) * TILE
);

// --- Fluorine annotation: global electronegativity maximum
mainTiles.filter(d => d[1] === "F")
  .append("text")
  .attr("x", INNER - 2).attr("y", 11)
  .attr("text-anchor", "end")
  .style("font-size", "9px").style("font-family", "sans-serif")
  .attr("fill", "#F5D020")
  .text("★");

// --- F-block placeholder tiles at group 3, periods 6-7
[["57-71", 5], ["89-103", 6]].forEach(([label, per]) => {
  const fill = THEME === "light" ? "#DEDAD3" : "#2D2D29";
  const x = MAIN_LEFT + 2 * TILE;
  const y = MAIN_TOP + per * TILE;
  const g = svg.append("g").attr("transform", `translate(${x},${y})`);
  g.append("rect")
    .attr("width", INNER).attr("height", INNER)
    .attr("rx", 2).attr("fill", fill)
    .attr("stroke", t.grid).attr("stroke-width", 0.8);
  g.append("text").attr("x", INNER / 2).attr("y", INNER / 2 + 4)
    .attr("text-anchor", "middle")
    .style("font-size", "8px").style("font-family", "sans-serif")
    .attr("fill", t.inkSoft).text(label);
});

// --- F-block rows (period 8 = lanthanides, period 9 = actinides)
const fbG = svg.append("g");
drawTiles(
  fbG,
  elements.filter(d => d[2] >= 8),
  d => FB_LEFT + (d[3] - 1) * TILE,
  d => FB_TOP + (d[2] - 8) * TILE
);

// --- F-block row labels (Ln / An) — idiomatic D3 data join
svg.selectAll("text.fblock-label")
  .data([["Ln", 0], ["An", 1]])
  .join("text")
  .attr("class", "fblock-label")
  .attr("x", MAIN_LEFT - 10)
  .attr("y", ([, i]) => FB_TOP + i * TILE + INNER / 2 + 5)
  .attr("text-anchor", "end")
  .style("font-size", "11px").style("font-family", "sans-serif")
  .attr("fill", t.inkSoft)
  .text(([label]) => label);

// --- Period labels (1-7)
svg.selectAll("text.period-label")
  .data(d3.range(1, 8))
  .join("text")
  .attr("class", "period-label")
  .attr("x", MAIN_LEFT - 10)
  .attr("y", p => MAIN_TOP + (p - 1) * TILE + INNER / 2 + 5)
  .attr("text-anchor", "end")
  .style("font-size", "11px").style("font-family", "sans-serif")
  .attr("fill", t.inkSoft)
  .text(p => p);

// --- Group labels (1-18)
svg.selectAll("text.group-label")
  .data(d3.range(1, 19))
  .join("text")
  .attr("class", "group-label")
  .attr("x", grp => MAIN_LEFT + (grp - 1) * TILE + INNER / 2)
  .attr("y", MAIN_TOP - 10)
  .attr("text-anchor", "middle")
  .style("font-size", "9.5px").style("font-family", "sans-serif")
  .attr("fill", t.inkSoft)
  .text(grp => grp);

// --- Colorbar: single rect filled with linearGradient
svg.append("rect")
  .attr("x", MAIN_LEFT).attr("y", CB_TOP)
  .attr("width", CB_W).attr("height", CB_H)
  .attr("fill", "url(#cb-grad)");
svg.append("rect")
  .attr("x", MAIN_LEFT).attr("y", CB_TOP)
  .attr("width", CB_W).attr("height", CB_H)
  .attr("fill", "none").attr("stroke", t.inkSoft).attr("stroke-width", 0.5);

// --- Colorbar axis
const cbScale = d3.scaleLinear()
  .domain([valMin, valMax])
  .range([MAIN_LEFT, MAIN_LEFT + CB_W]);
const cbAxisG = svg.append("g")
  .attr("transform", `translate(0,${CB_TOP + CB_H})`)
  .call(
    d3.axisBottom(cbScale)
      .tickValues([0.5, 1.0, 1.5, 2.0, 2.5, 3.0, 3.5, 4.0])
      .tickFormat(d3.format(".1f"))
      .tickSize(4)
  );
cbAxisG.selectAll("text")
  .attr("fill", t.inkSoft)
  .style("font-size", "12px")
  .style("font-family", "sans-serif");
cbAxisG.selectAll("line").attr("stroke", t.inkSoft);
cbAxisG.select(".domain").attr("stroke", t.inkSoft);

// --- Colorbar property label
svg.append("text")
  .attr("x", MAIN_LEFT + CB_W / 2)
  .attr("y", CB_TOP + CB_H + 44)
  .attr("text-anchor", "middle")
  .style("font-size", "14px").style("font-family", "sans-serif")
  .attr("fill", t.ink)
  .text("Electronegativity (Pauling scale)");
Runnable source as JSON, for any HTTP client: https://api.anyplot.ai/specs/heatmap-periodic-table/d3/code. Any spec id and library id listed in llms-full.txt fit the same URL shape; every URL below is complete and callable.
{
  "spec_id": "heatmap-periodic-table",
  "language": "javascript",
  "library": "d3",
  "page": "https://anyplot.ai/heatmap-periodic-table/javascript/d3",
  "hub": "https://anyplot.ai/heatmap-periodic-table",
  "code_json": "https://api.anyplot.ai/specs/heatmap-periodic-table/d3/code",
  "spec_json": "https://api.anyplot.ai/specs/heatmap-periodic-table",
  "render_light_png": "https://storage.googleapis.com/anyplot-images/plots/heatmap-periodic-table/javascript/d3/plot-light.png",
  "render_dark_png": "https://storage.googleapis.com/anyplot-images/plots/heatmap-periodic-table/javascript/d3/plot-dark.png",
  "interactive_light_html": "https://storage.googleapis.com/anyplot-images/plots/heatmap-periodic-table/javascript/d3/plot-light.html",
  "interactive_dark_html": "https://storage.googleapis.com/anyplot-images/plots/heatmap-periodic-table/javascript/d3/plot-dark.html",
  "quality_score": 88.0,
  "license": "MIT",
  "guide": "https://anyplot.ai/llms.txt"
}
Part of Periodic Table Property Heatmap on anyplot.ai.