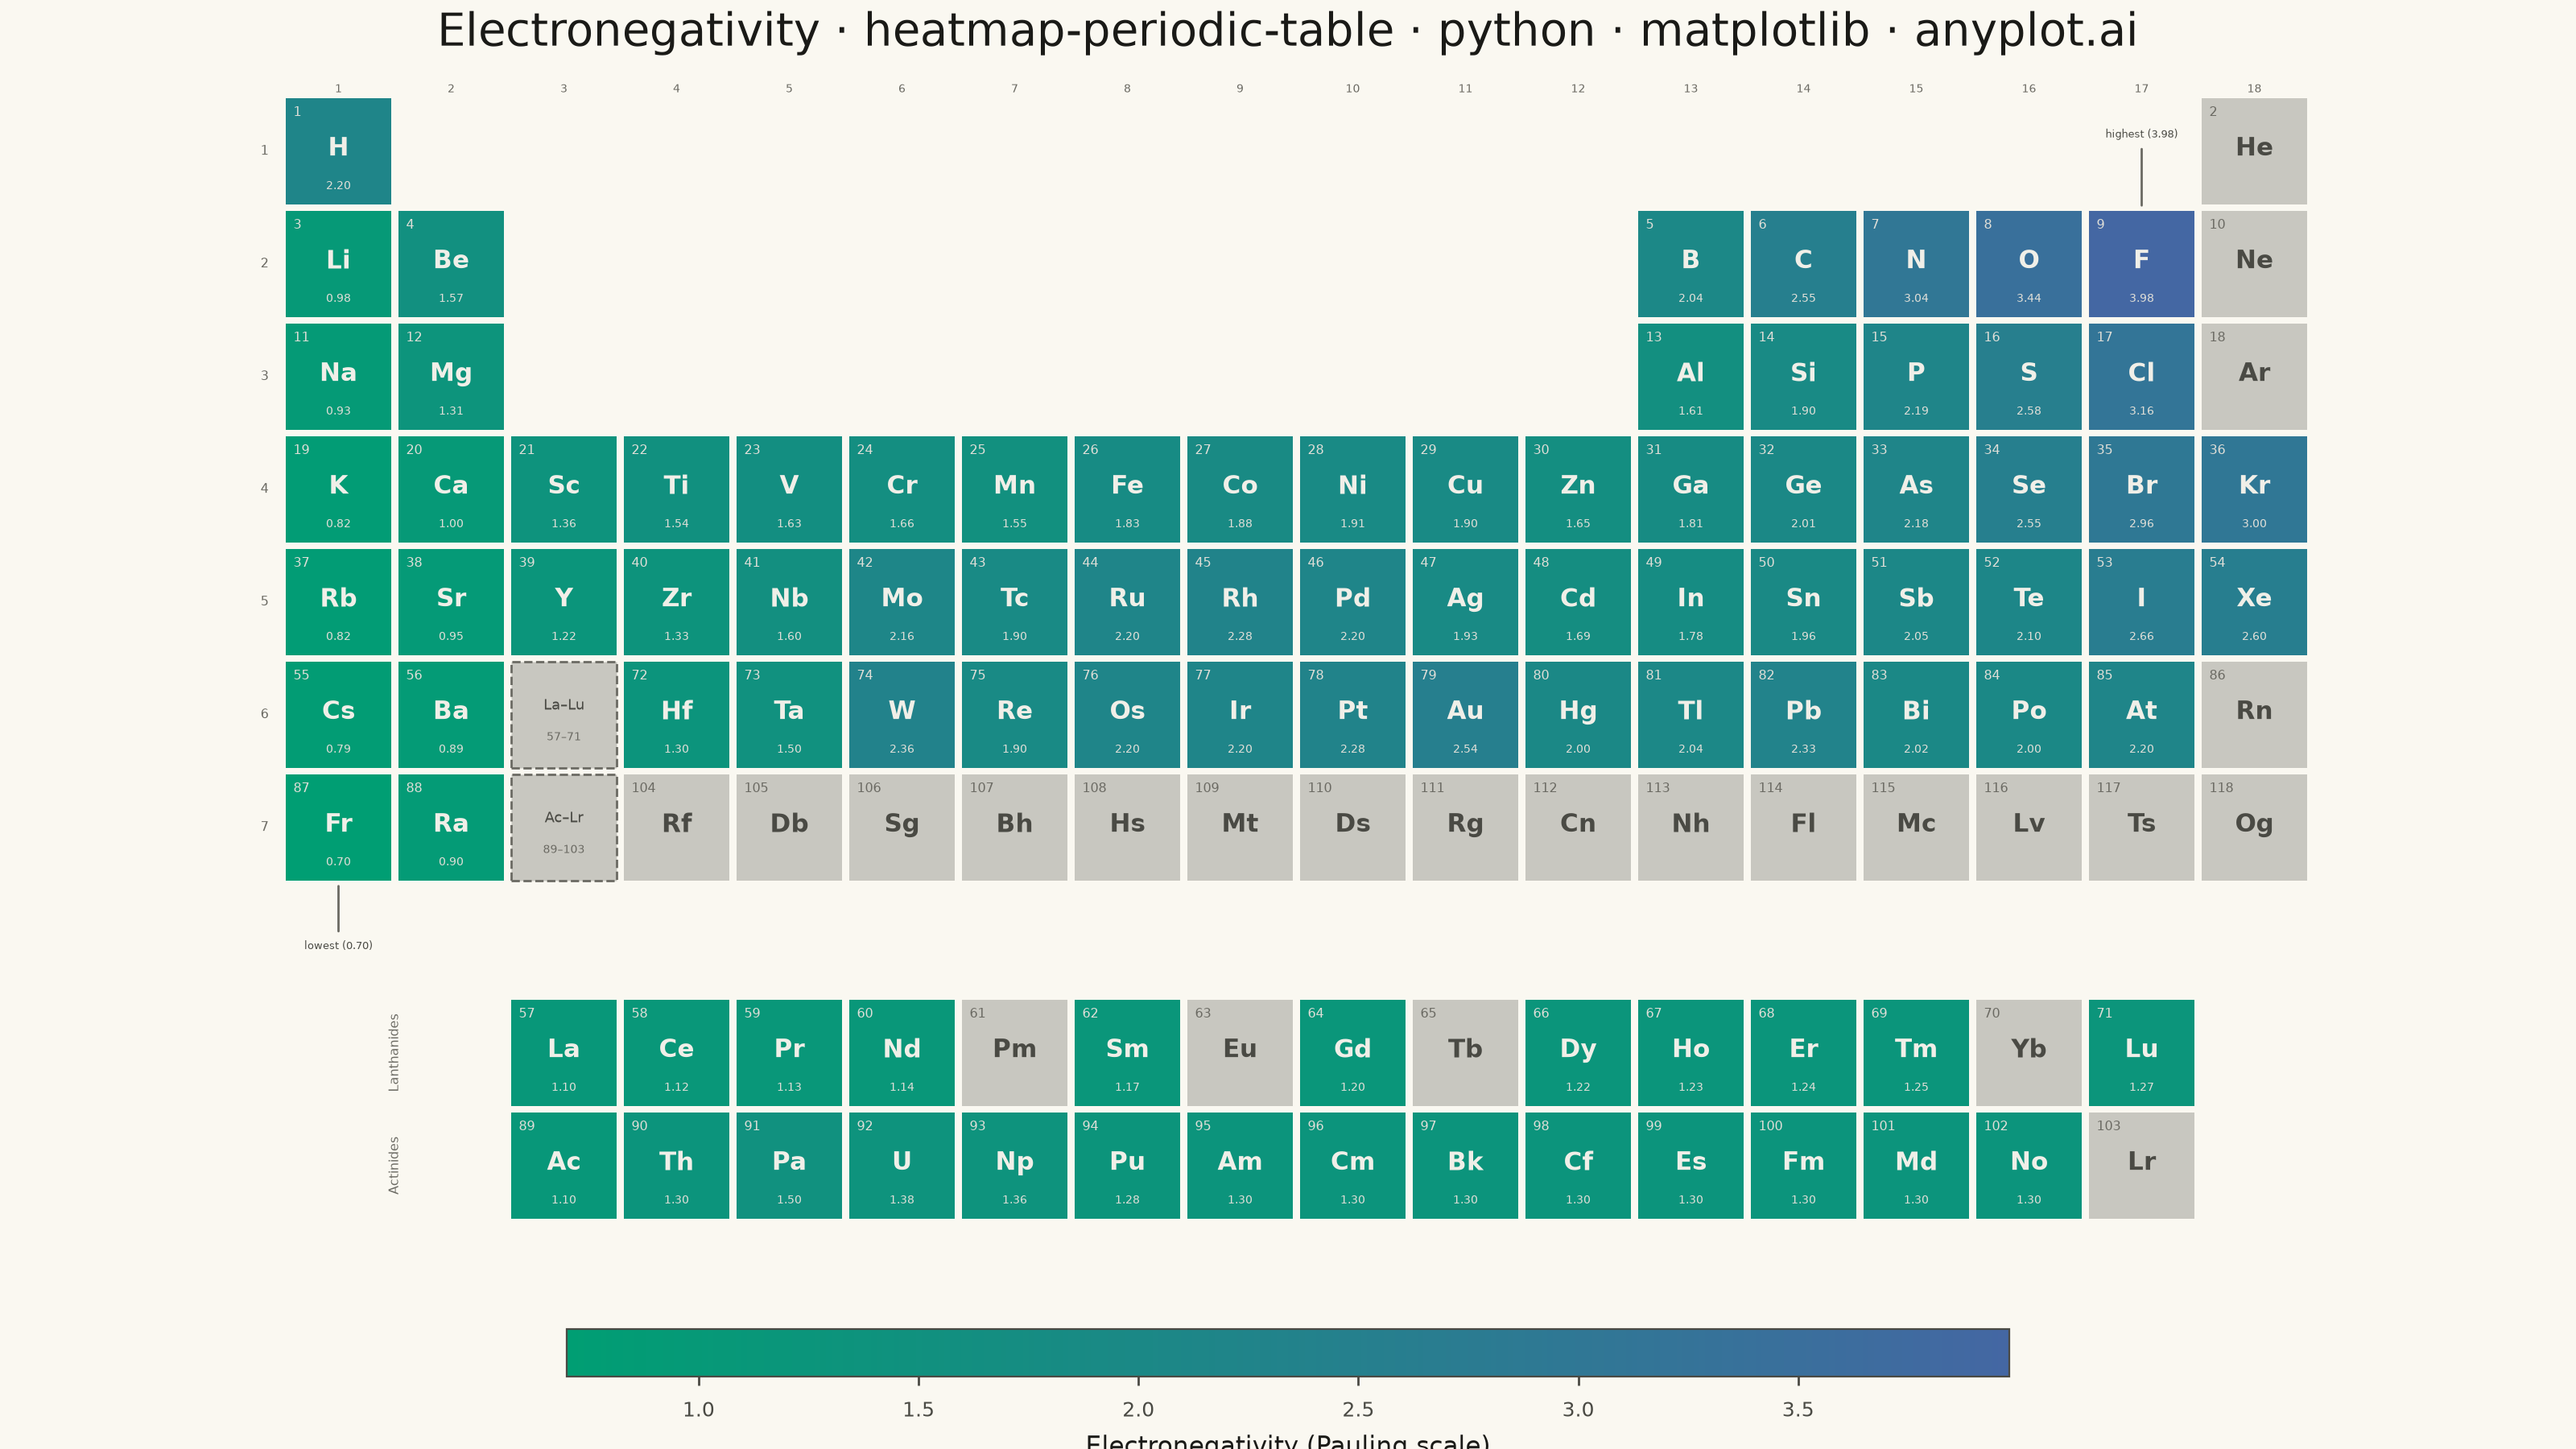
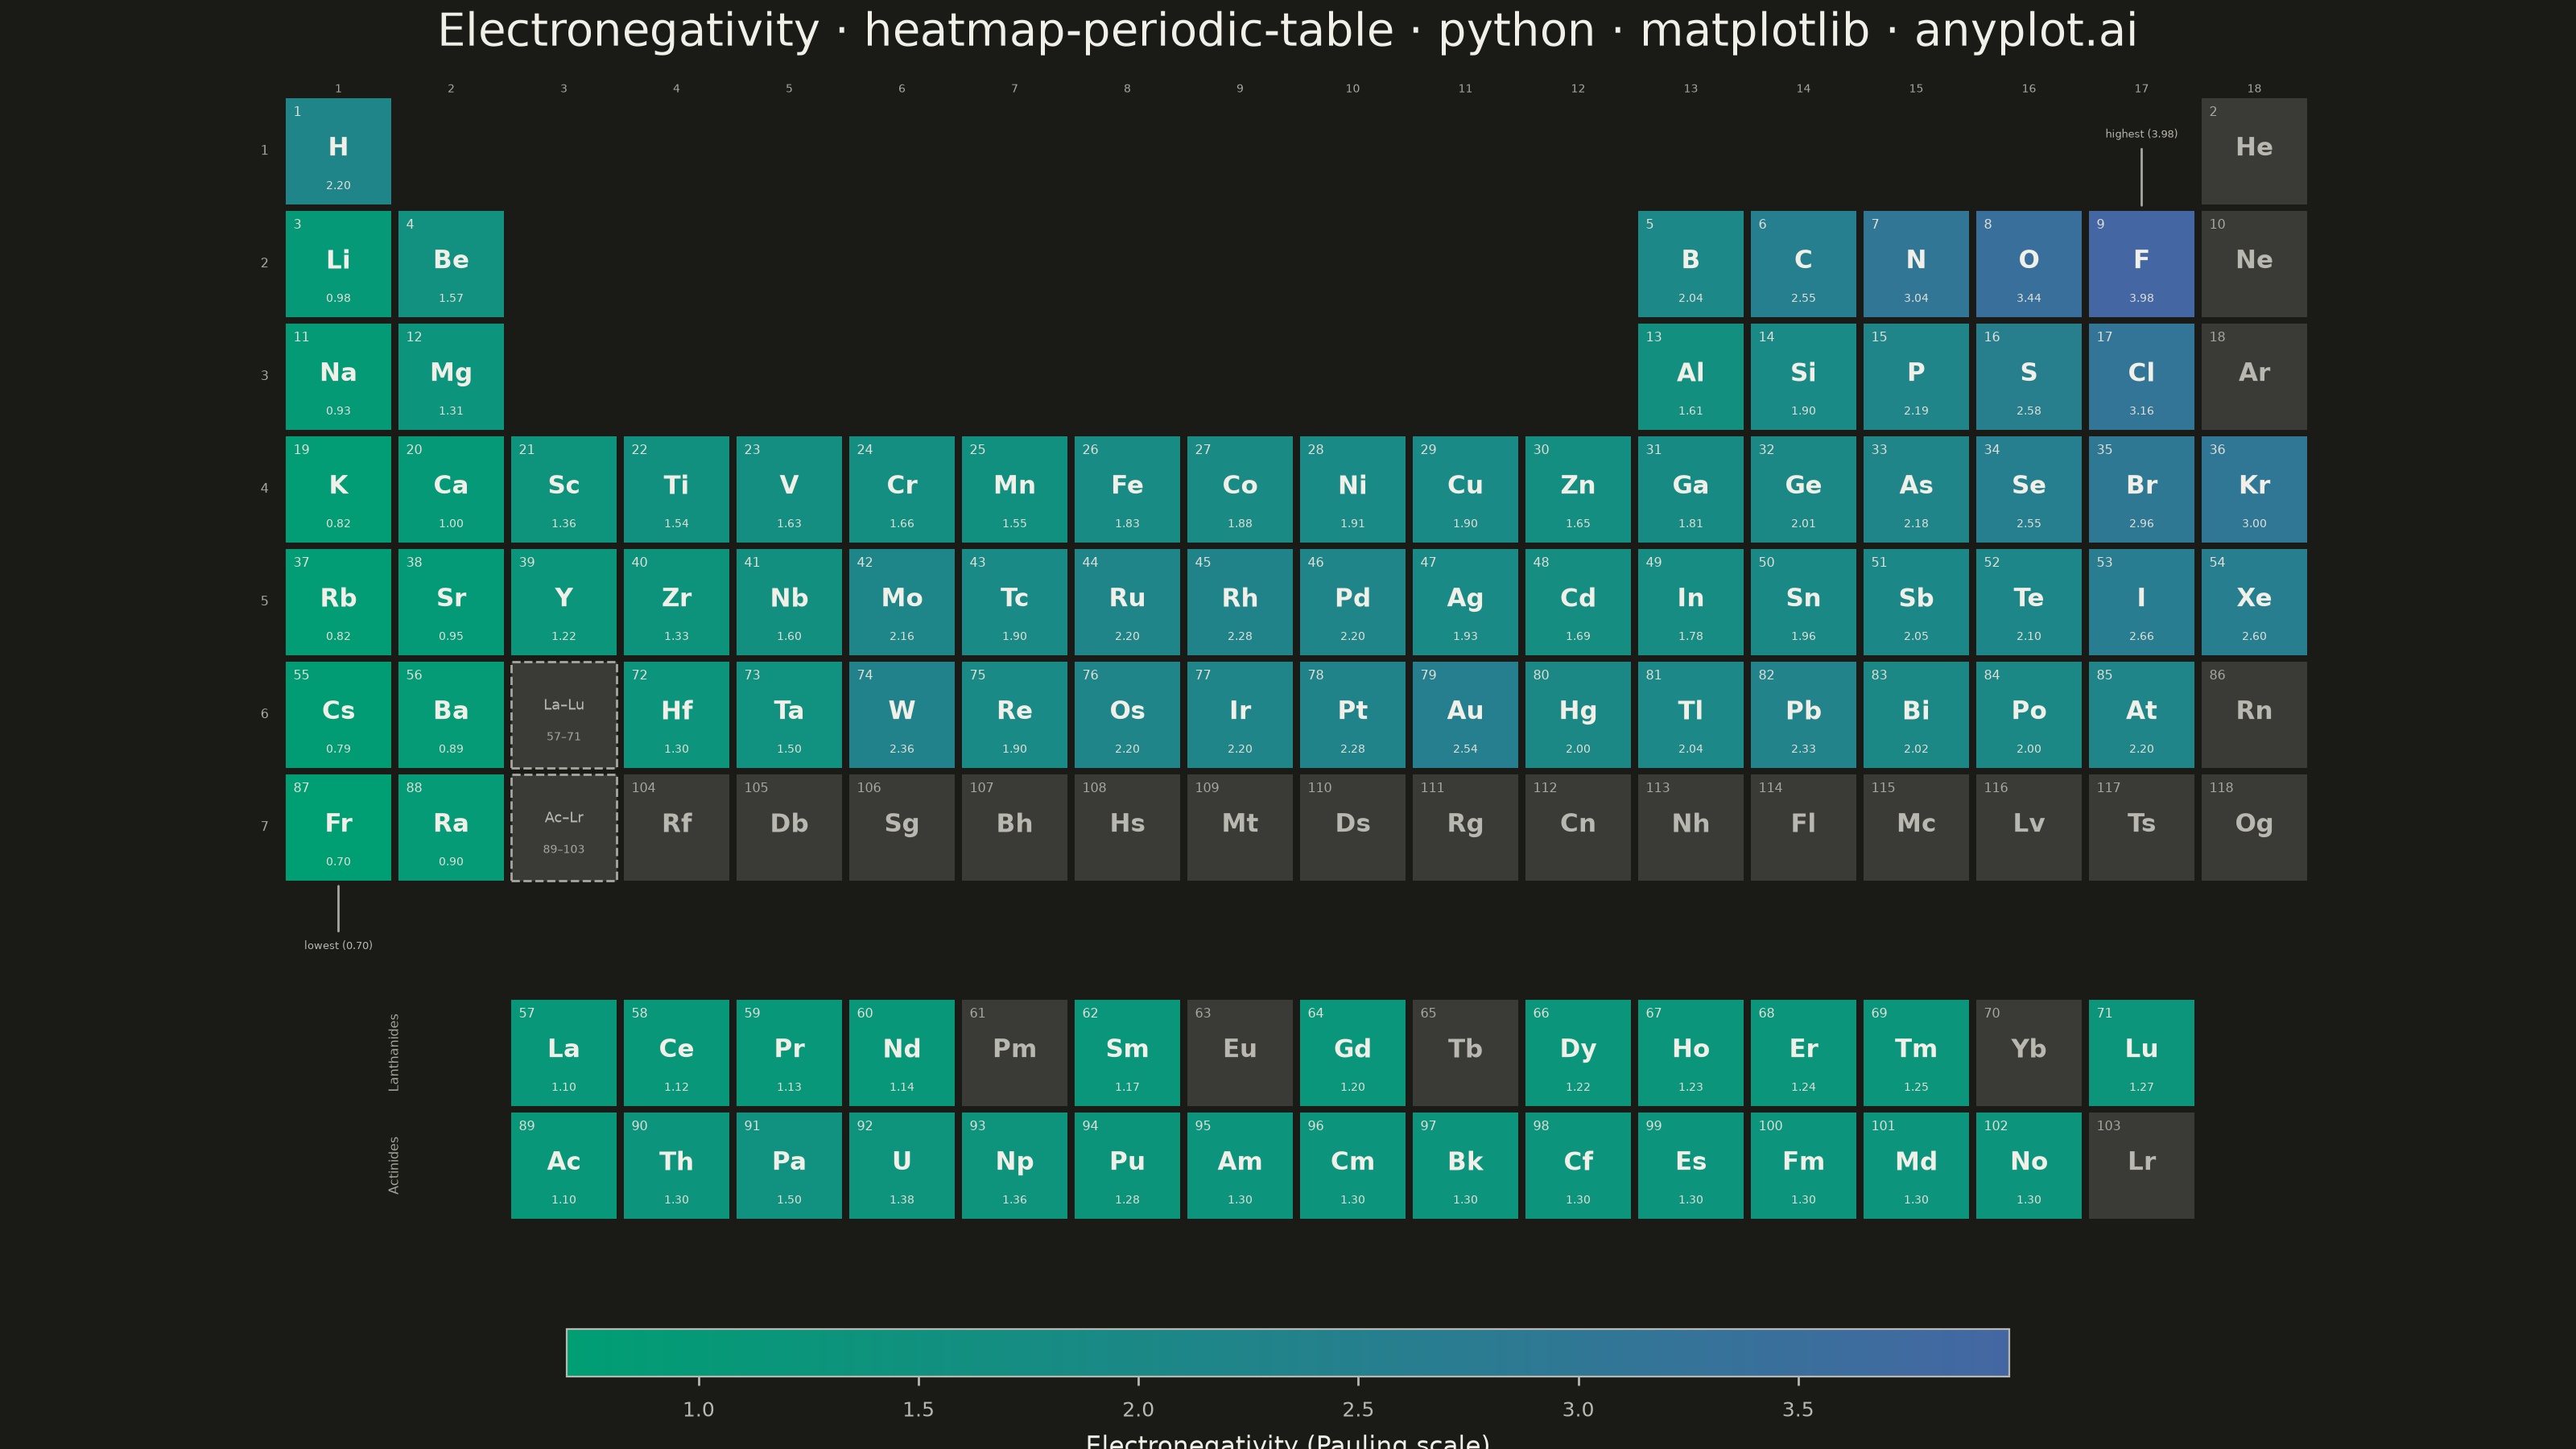
A periodic table of the elements rendered in its canonical layout — 18 groups across by 7 periods down, with the lanthanide and actinide series detached as two separate rows below — where each element tile is colored by a continuous property such as electronegativity, atomic radius, melting point, or first ionization energy. A colorbar maps tile color to property value, and every tile carries the element symbol and atomic number, optionally with the numeric property value. This visualization fuses an immediately recognizable fixed grid with heatmap encoding, turning a familiar reference chart into a tool for spotting periodic trends at a glance.
""" anyplot.ai
heatmap-periodic-table: Periodic Table Property Heatmap
Library: matplotlib 3.11.0 | Python 3.13.13
Quality: 88/100 | Created: 2026-06-15
"""

import os

import matplotlib.patches as mpatches
import matplotlib.pyplot as plt
from matplotlib.colors import LinearSegmentedColormap, Normalize


# Theme
THEME = os.getenv("ANYPLOT_THEME", "light")
PAGE_BG = "#FAF8F1" if THEME == "light" else "#1A1A17"
ELEVATED_BG = "#FFFDF6" if THEME == "light" else "#242420"
INK = "#1A1A17" if THEME == "light" else "#F0EFE8"
INK_SOFT = "#4A4A44" if THEME == "light" else "#B8B7B0"
INK_MUTED = "#6B6A63" if THEME == "light" else "#A8A79F"

# Imprint sequential colormap for Pauling electronegativity (unipolar)
imprint_seq = LinearSegmentedColormap.from_list("imprint_seq", ["#009E73", "#4467A3"])
GRAY_TILE = "#C8C7C0" if THEME == "light" else "#3A3A37"

# Data — (atomic_number, symbol, group, period, pauling_electronegativity or None)
# Lanthanides (57-71) and actinides (89-103) are listed separately below.
ELEMENTS = [
    # Period 1
    (1, "H", 1, 1, 2.20),
    (2, "He", 18, 1, None),
    # Period 2
    (3, "Li", 1, 2, 0.98),
    (4, "Be", 2, 2, 1.57),
    (5, "B", 13, 2, 2.04),
    (6, "C", 14, 2, 2.55),
    (7, "N", 15, 2, 3.04),
    (8, "O", 16, 2, 3.44),
    (9, "F", 17, 2, 3.98),
    (10, "Ne", 18, 2, None),
    # Period 3
    (11, "Na", 1, 3, 0.93),
    (12, "Mg", 2, 3, 1.31),
    (13, "Al", 13, 3, 1.61),
    (14, "Si", 14, 3, 1.90),
    (15, "P", 15, 3, 2.19),
    (16, "S", 16, 3, 2.58),
    (17, "Cl", 17, 3, 3.16),
    (18, "Ar", 18, 3, None),
    # Period 4
    (19, "K", 1, 4, 0.82),
    (20, "Ca", 2, 4, 1.00),
    (21, "Sc", 3, 4, 1.36),
    (22, "Ti", 4, 4, 1.54),
    (23, "V", 5, 4, 1.63),
    (24, "Cr", 6, 4, 1.66),
    (25, "Mn", 7, 4, 1.55),
    (26, "Fe", 8, 4, 1.83),
    (27, "Co", 9, 4, 1.88),
    (28, "Ni", 10, 4, 1.91),
    (29, "Cu", 11, 4, 1.90),
    (30, "Zn", 12, 4, 1.65),
    (31, "Ga", 13, 4, 1.81),
    (32, "Ge", 14, 4, 2.01),
    (33, "As", 15, 4, 2.18),
    (34, "Se", 16, 4, 2.55),
    (35, "Br", 17, 4, 2.96),
    (36, "Kr", 18, 4, 3.00),
    # Period 5
    (37, "Rb", 1, 5, 0.82),
    (38, "Sr", 2, 5, 0.95),
    (39, "Y", 3, 5, 1.22),
    (40, "Zr", 4, 5, 1.33),
    (41, "Nb", 5, 5, 1.60),
    (42, "Mo", 6, 5, 2.16),
    (43, "Tc", 7, 5, 1.90),
    (44, "Ru", 8, 5, 2.20),
    (45, "Rh", 9, 5, 2.28),
    (46, "Pd", 10, 5, 2.20),
    (47, "Ag", 11, 5, 1.93),
    (48, "Cd", 12, 5, 1.69),
    (49, "In", 13, 5, 1.78),
    (50, "Sn", 14, 5, 1.96),
    (51, "Sb", 15, 5, 2.05),
    (52, "Te", 16, 5, 2.10),
    (53, "I", 17, 5, 2.66),
    (54, "Xe", 18, 5, 2.60),
    # Period 6 — group 3 is a placeholder for lanthanides (57-71)
    (55, "Cs", 1, 6, 0.79),
    (56, "Ba", 2, 6, 0.89),
    (72, "Hf", 4, 6, 1.30),
    (73, "Ta", 5, 6, 1.50),
    (74, "W", 6, 6, 2.36),
    (75, "Re", 7, 6, 1.90),
    (76, "Os", 8, 6, 2.20),
    (77, "Ir", 9, 6, 2.20),
    (78, "Pt", 10, 6, 2.28),
    (79, "Au", 11, 6, 2.54),
    (80, "Hg", 12, 6, 2.00),
    (81, "Tl", 13, 6, 2.04),
    (82, "Pb", 14, 6, 2.33),
    (83, "Bi", 15, 6, 2.02),
    (84, "Po", 16, 6, 2.00),
    (85, "At", 17, 6, 2.20),
    (86, "Rn", 18, 6, None),
    # Period 7 — group 3 is a placeholder for actinides (89-103)
    (87, "Fr", 1, 7, 0.70),
    (88, "Ra", 2, 7, 0.90),
    (104, "Rf", 4, 7, None),
    (105, "Db", 5, 7, None),
    (106, "Sg", 6, 7, None),
    (107, "Bh", 7, 7, None),
    (108, "Hs", 8, 7, None),
    (109, "Mt", 9, 7, None),
    (110, "Ds", 10, 7, None),
    (111, "Rg", 11, 7, None),
    (112, "Cn", 12, 7, None),
    (113, "Nh", 13, 7, None),
    (114, "Fl", 14, 7, None),
    (115, "Mc", 15, 7, None),
    (116, "Lv", 16, 7, None),
    (117, "Ts", 17, 7, None),
    (118, "Og", 18, 7, None),
]

# Lanthanides: La(57) to Lu(71), placed in f-block row at y=1.0, starting x=2
LANTHANIDES = [
    (57, "La", 1.10),
    (58, "Ce", 1.12),
    (59, "Pr", 1.13),
    (60, "Nd", 1.14),
    (61, "Pm", None),
    (62, "Sm", 1.17),
    (63, "Eu", None),
    (64, "Gd", 1.20),
    (65, "Tb", None),
    (66, "Dy", 1.22),
    (67, "Ho", 1.23),
    (68, "Er", 1.24),
    (69, "Tm", 1.25),
    (70, "Yb", None),
    (71, "Lu", 1.27),
]

# Actinides: Ac(89) to Lr(103), placed in f-block row at y=0.0, starting x=2
ACTINIDES = [
    (89, "Ac", 1.10),
    (90, "Th", 1.30),
    (91, "Pa", 1.50),
    (92, "U", 1.38),
    (93, "Np", 1.36),
    (94, "Pu", 1.28),
    (95, "Am", 1.30),
    (96, "Cm", 1.30),
    (97, "Bk", 1.30),
    (98, "Cf", 1.30),
    (99, "Es", 1.30),
    (100, "Fm", 1.30),
    (101, "Md", 1.30),
    (102, "No", 1.30),
    (103, "Lr", None),
]

# Colormap normalization across all defined values
all_en = [e[4] for e in ELEMENTS if e[4] is not None]
all_en += [ln[2] for ln in LANTHANIDES if ln[2] is not None]
all_en += [a[2] for a in ACTINIDES if a[2] is not None]
vmin, vmax = min(all_en), max(all_en)
norm = Normalize(vmin=vmin, vmax=vmax)

# Plot — landscape 3200×1800 (figsize=(8,4.5) × dpi=400)
fig = plt.figure(figsize=(8, 4.5), dpi=400, facecolor=PAGE_BG)
ax = fig.add_axes([0.01, 0.11, 0.98, 0.84])
ax.set_facecolor(PAGE_BG)
ax.set_xlim(-0.25, 18.1)
ax.set_ylim(-0.6, 10.2)
ax.set_aspect("equal")
ax.axis("off")

GAP = 0.06
TILE_SIZE = 1 - GAP

# Period labels (left margin)
for p in range(1, 8):
    ax.text(-0.12, 10 - p + 0.5, str(p), fontsize=2.8, color=INK_MUTED, ha="right", va="center")

# Group labels (top)
for g in range(1, 19):
    ax.text(g - 0.5, 10.0, str(g), fontsize=2.5, color=INK_MUTED, ha="center", va="bottom")

# Build combined element list: (z, sym, en, x, y) — main table, lanthanides, actinides
all_tiles = []
for z, sym, grp, per, en in ELEMENTS:
    all_tiles.append((z, sym, en, grp - 1, 10 - per))
for i, (z, sym, en) in enumerate(LANTHANIDES):
    all_tiles.append((z, sym, en, 2 + i, 1.0))
for i, (z, sym, en) in enumerate(ACTINIDES):
    all_tiles.append((z, sym, en, 2 + i, 0.0))

# Draw all tiles in a single pass
for z, sym, en, x, y in all_tiles:
    if en is not None:
        rgba = imprint_seq(norm(en))
        lum = 0.299 * rgba[0] + 0.587 * rgba[1] + 0.114 * rgba[2]
        tile_color = rgba
        tc = "#1A1A17" if lum > 0.45 else "#F0EFE8"
        tiny_tc = "#2A2A27" if lum > 0.45 else "#E0DFD8"
    else:
        tile_color = GRAY_TILE
        tc = INK_SOFT
        tiny_tc = INK_MUTED

    rect = mpatches.Rectangle(
        (x + GAP / 2, y + GAP / 2), TILE_SIZE, TILE_SIZE, facecolor=tile_color, edgecolor="none", zorder=2
    )
    ax.add_patch(rect)
    ax.text(
        x + GAP / 2 + 0.07,
        y + TILE_SIZE + GAP / 2 - 0.07,
        str(z),
        fontsize=2.8,
        color=tiny_tc,
        ha="left",
        va="top",
        zorder=3,
    )
    ax.text(x + 0.5, y + 0.52, sym, fontsize=5.5, color=tc, ha="center", va="center", fontweight="bold", zorder=3)
    if en is not None:
        ax.text(
            x + 0.5, y + GAP / 2 + 0.11, f"{en:.2f}", fontsize=2.6, color=tiny_tc, ha="center", va="bottom", zorder=3
        )

# Placeholder tile at group 3, period 6 — marks the lanthanide series
xp, yp = 2, 4
rect = mpatches.Rectangle(
    (xp + GAP / 2, yp + GAP / 2),
    TILE_SIZE,
    TILE_SIZE,
    facecolor=GRAY_TILE,
    edgecolor=INK_MUTED,
    linewidth=0.5,
    linestyle="--",
    zorder=2,
)
ax.add_patch(rect)
ax.text(xp + 0.5, yp + 0.58, "La–Lu", fontsize=3.2, color=INK_SOFT, ha="center", va="center", zorder=3)
ax.text(xp + 0.5, yp + 0.30, "57–71", fontsize=2.5, color=INK_MUTED, ha="center", va="center", zorder=3)

# Placeholder tile at group 3, period 7 — marks the actinide series
xp, yp = 2, 3
rect = mpatches.Rectangle(
    (xp + GAP / 2, yp + GAP / 2),
    TILE_SIZE,
    TILE_SIZE,
    facecolor=GRAY_TILE,
    edgecolor=INK_MUTED,
    linewidth=0.5,
    linestyle="--",
    zorder=2,
)
ax.add_patch(rect)
ax.text(xp + 0.5, yp + 0.58, "Ac–Lr", fontsize=3.2, color=INK_SOFT, ha="center", va="center", zorder=3)
ax.text(xp + 0.5, yp + 0.30, "89–103", fontsize=2.5, color=INK_MUTED, ha="center", va="center", zorder=3)

# F-block row labels
ax.text(1.0, 1.5, "Lanthanides", fontsize=2.8, color=INK_MUTED, ha="center", va="center", rotation=90)
ax.text(1.0, 0.5, "Actinides", fontsize=2.8, color=INK_MUTED, ha="center", va="center", rotation=90)

# Annotations — highlight the key top-right vs bottom-left electronegativity gradient
# F (group 17, period 2) is the most electronegative; Fr (group 1, period 7) is the least.
# Group 17, period 1 is empty — use that space for the "highest" label above F.
ax.annotate(
    "highest (3.98)",
    xy=(16.5, 8.94),
    xytext=(16.5, 9.60),
    fontsize=2.4,
    color=INK_SOFT,
    ha="center",
    va="bottom",
    arrowprops={"arrowstyle": "-", "color": INK_MUTED, "lw": 0.5, "shrinkA": 0, "shrinkB": 2},
    zorder=5,
)
# Gap row (y=2–3) below period 7 is empty — use it for the "lowest" label below Fr.
ax.annotate(
    "lowest (0.70)",
    xy=(0.5, 3.06),
    xytext=(0.5, 2.50),
    fontsize=2.4,
    color=INK_SOFT,
    ha="center",
    va="top",
    arrowprops={"arrowstyle": "-", "color": INK_MUTED, "lw": 0.5, "shrinkA": 0, "shrinkB": 2},
    zorder=5,
)

# Style — title with scaled fontsize
title = "Electronegativity · heatmap-periodic-table · python · matplotlib · anyplot.ai"
title_len = len(title)
title_fs = max(8, round(12 * 67 / title_len)) if title_len > 67 else 12
ax.set_title(title, fontsize=title_fs, fontweight="medium", color=INK, pad=6)

# Colorbar — raised to y=0.050 so the label clears the canvas bottom
cbar_ax = fig.add_axes([0.22, 0.050, 0.56, 0.033])
sm = plt.cm.ScalarMappable(cmap=imprint_seq, norm=norm)
sm.set_array([])
cbar = fig.colorbar(sm, cax=cbar_ax, orientation="horizontal")
cbar.set_label("Electronegativity (Pauling scale)", fontsize=5.5, color=INK, labelpad=3)
cbar.set_ticks([1.0, 1.5, 2.0, 2.5, 3.0, 3.5])
cbar.ax.tick_params(labelsize=4.5, colors=INK_SOFT, length=2, width=0.5)
cbar.outline.set_edgecolor(INK_SOFT)
cbar.outline.set_linewidth(0.4)
for label in cbar.ax.get_xticklabels():
    label.set_color(INK_SOFT)

# Save
plt.savefig(f"plot-{THEME}.png", dpi=400, facecolor=PAGE_BG)
Runnable source as JSON, for any HTTP client: https://api.anyplot.ai/specs/heatmap-periodic-table/matplotlib/code. Any spec id and library id listed in llms-full.txt fit the same URL shape; every URL below is complete and callable.
{
  "spec_id": "heatmap-periodic-table",
  "language": "python",
  "library": "matplotlib",
  "page": "https://anyplot.ai/heatmap-periodic-table/python/matplotlib",
  "hub": "https://anyplot.ai/heatmap-periodic-table",
  "code_json": "https://api.anyplot.ai/specs/heatmap-periodic-table/matplotlib/code",
  "spec_json": "https://api.anyplot.ai/specs/heatmap-periodic-table",
  "render_light_png": "https://storage.googleapis.com/anyplot-images/plots/heatmap-periodic-table/python/matplotlib/plot-light.png",
  "render_dark_png": "https://storage.googleapis.com/anyplot-images/plots/heatmap-periodic-table/python/matplotlib/plot-dark.png",
  "quality_score": 88.0,
  "license": "MIT",
  "guide": "https://anyplot.ai/llms.txt"
}
Part of Periodic Table Property Heatmap on anyplot.ai.