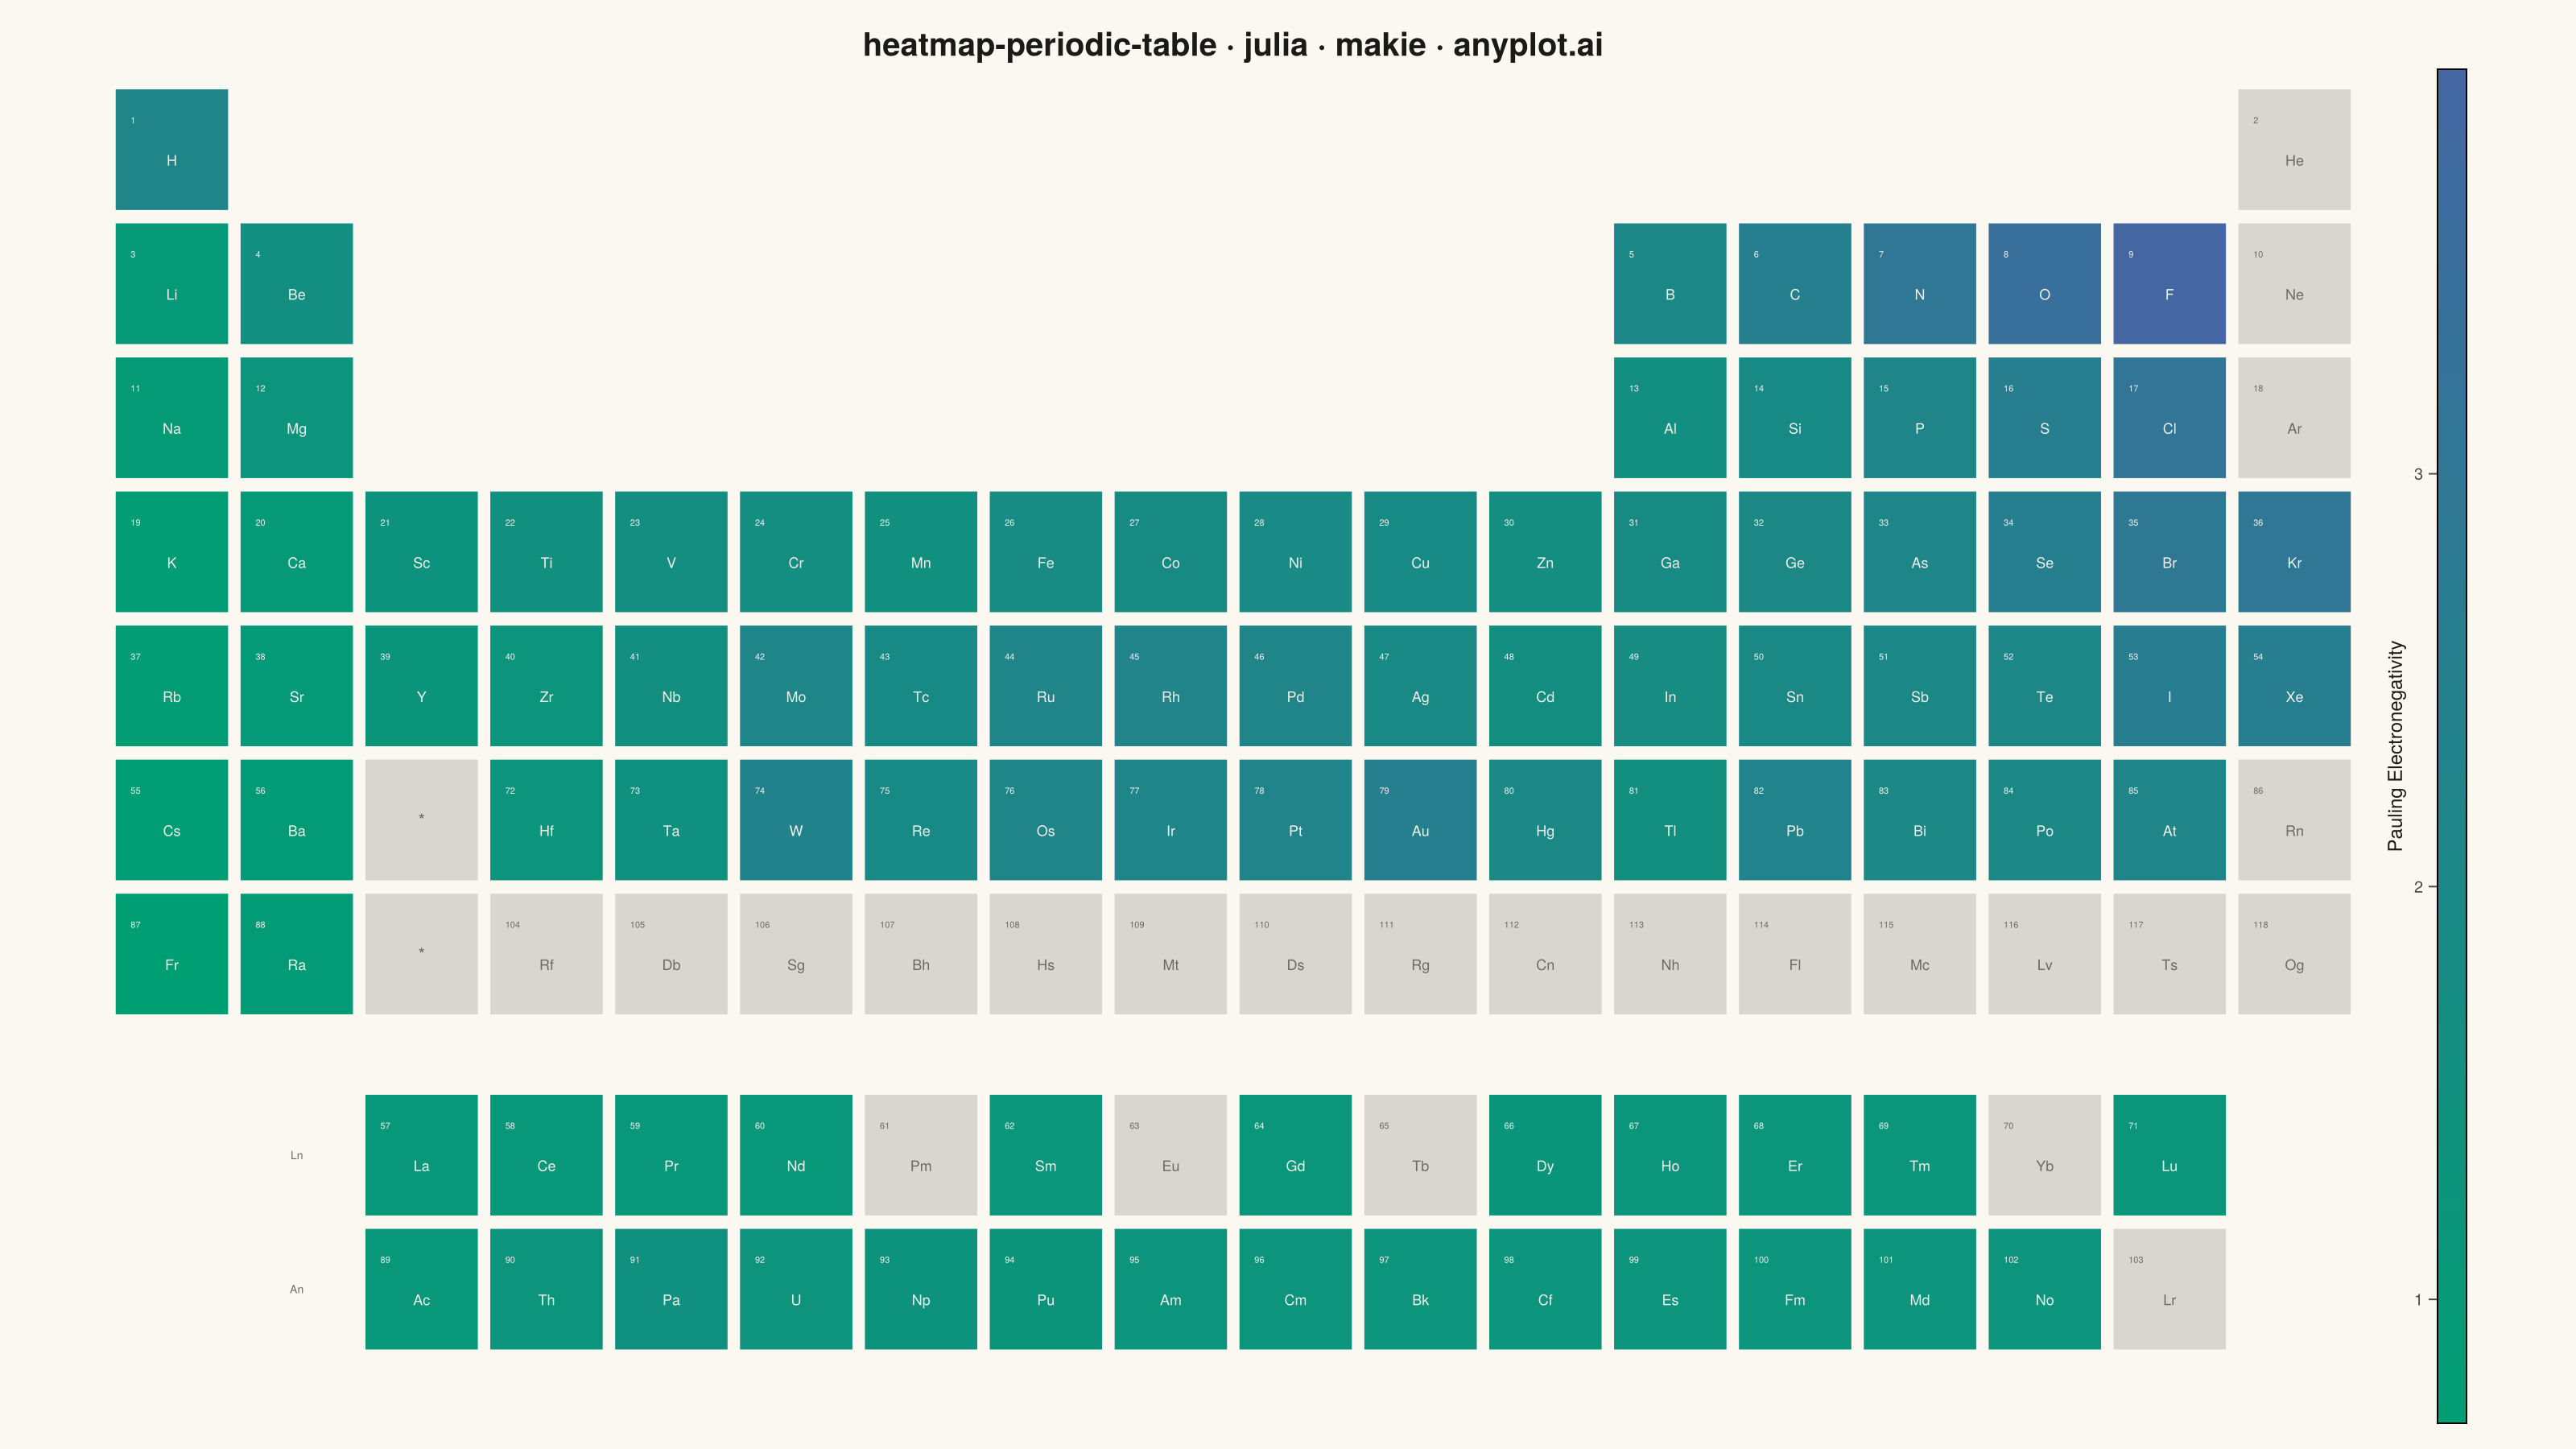
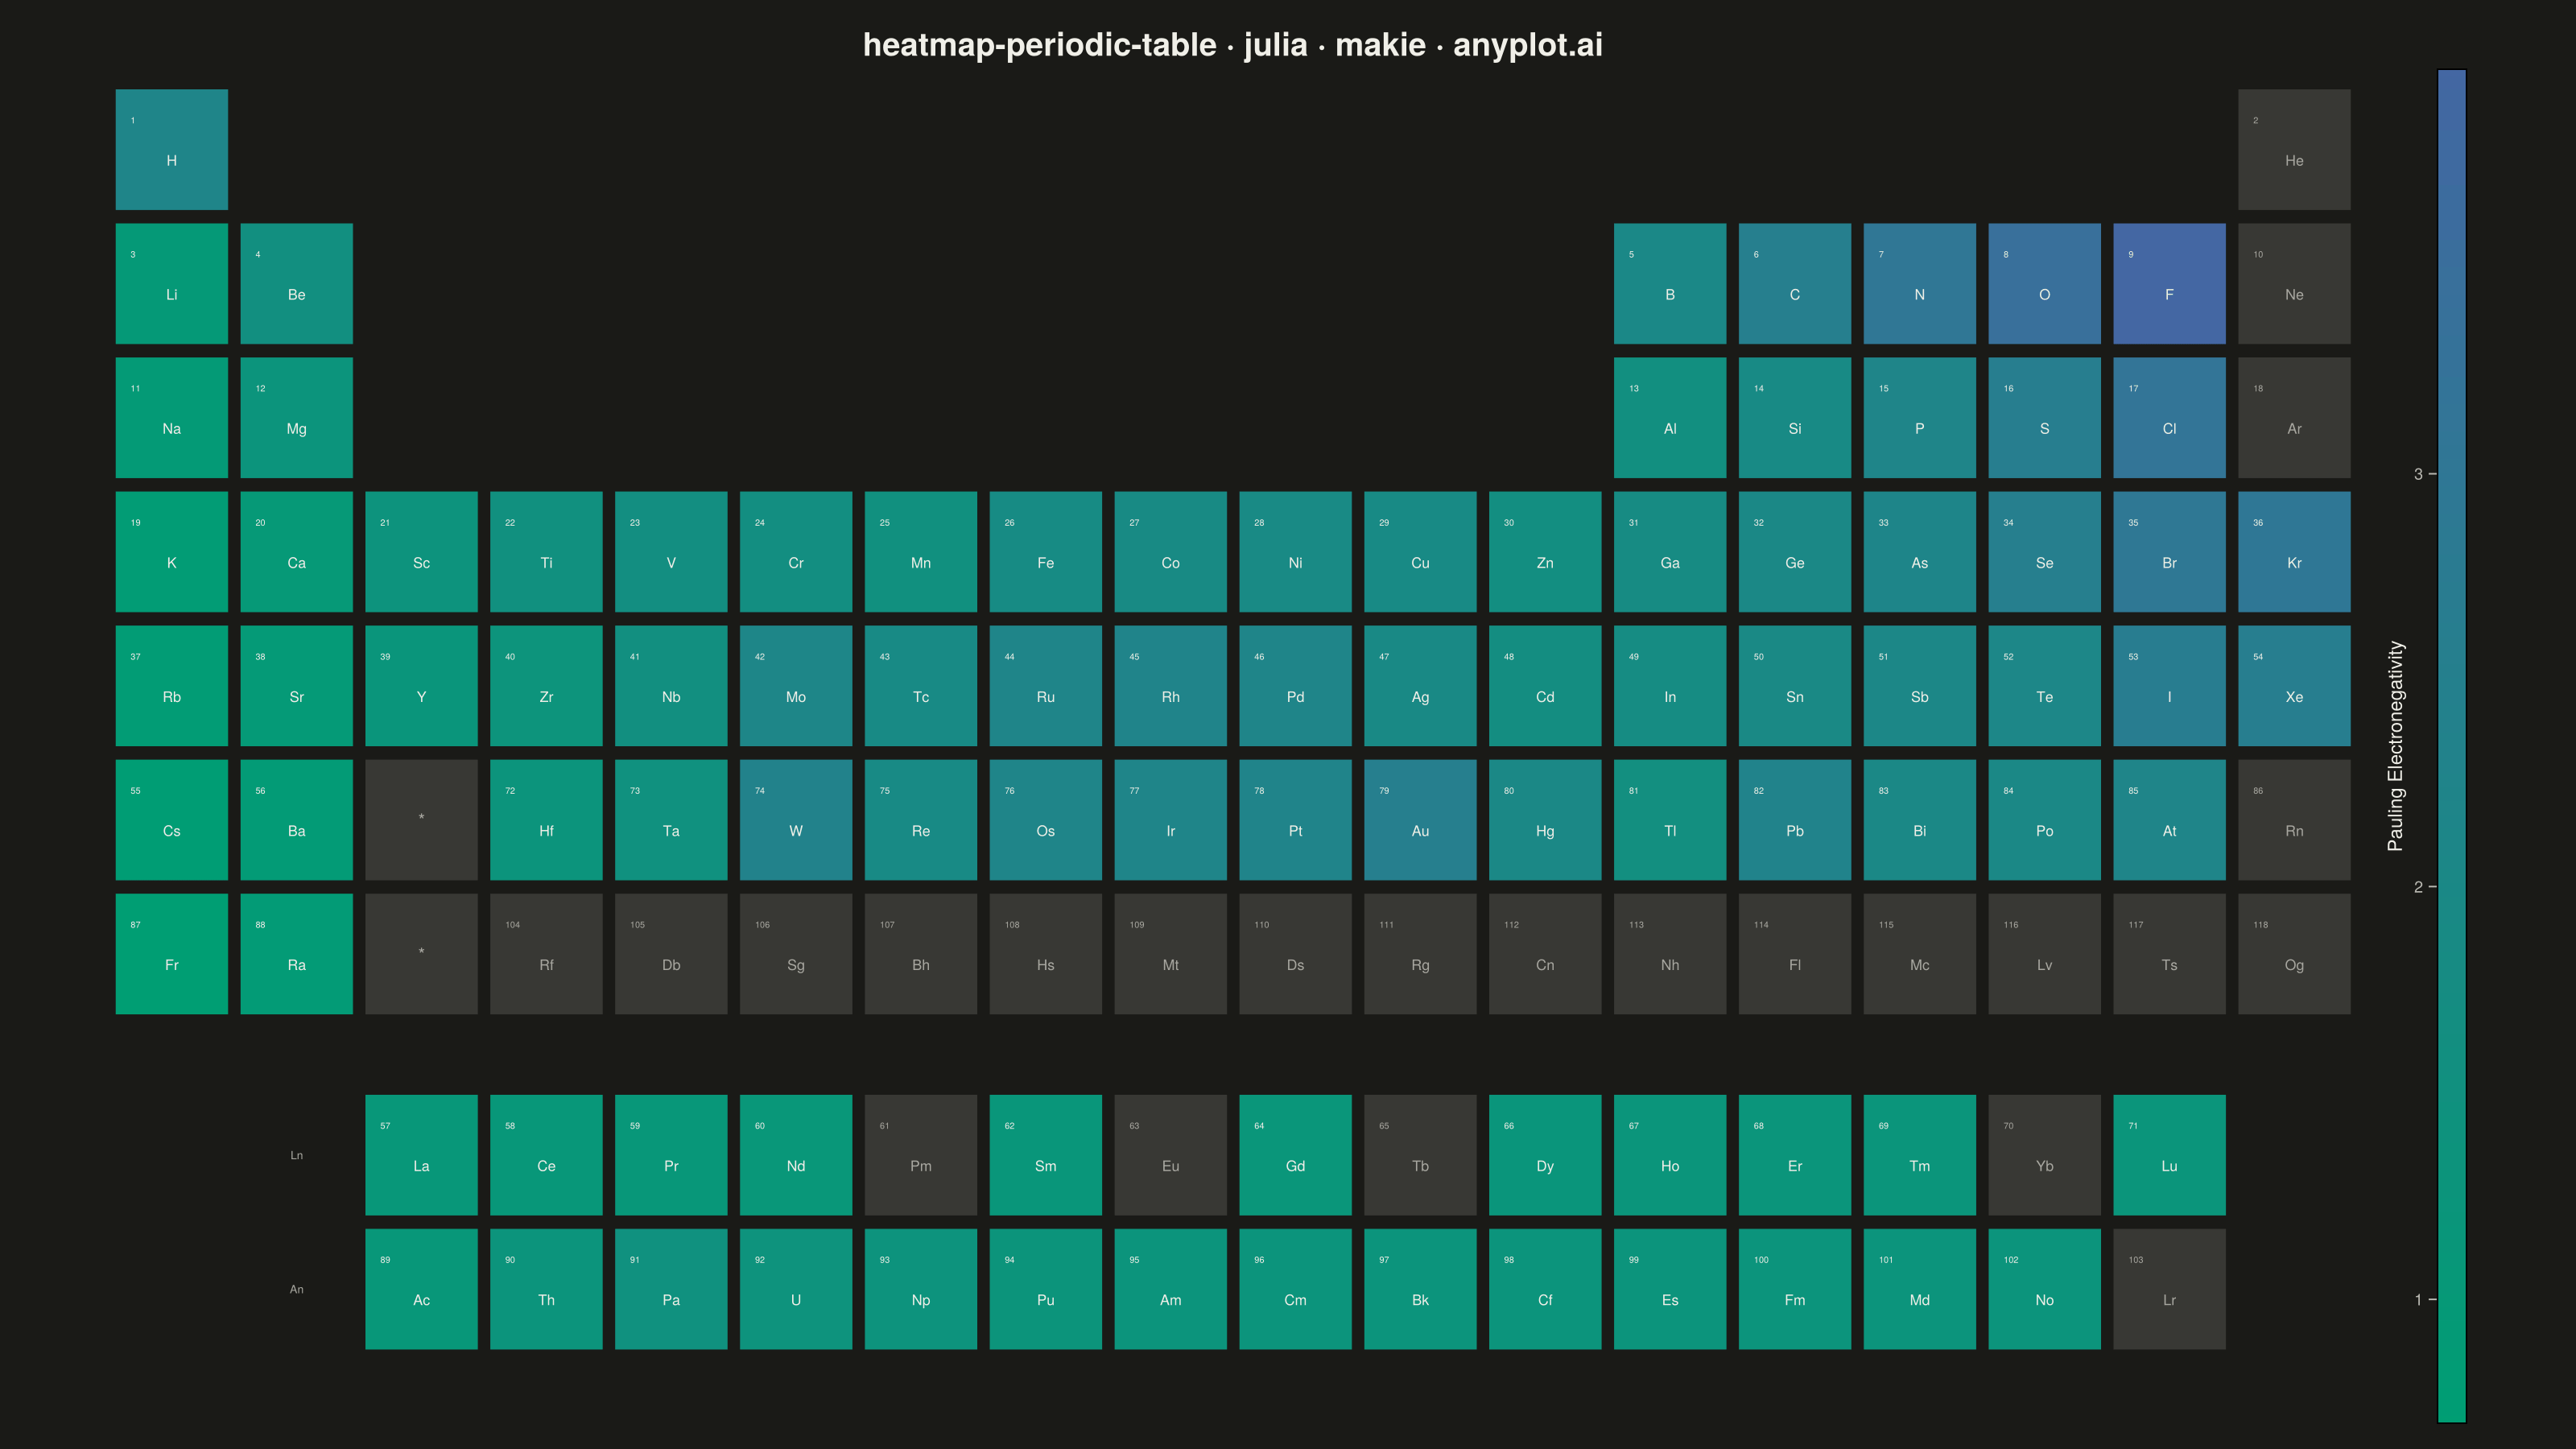
A periodic table of the elements rendered in its canonical layout — 18 groups across by 7 periods down, with the lanthanide and actinide series detached as two separate rows below — where each element tile is colored by a continuous property such as electronegativity, atomic radius, melting point, or first ionization energy. A colorbar maps tile color to property value, and every tile carries the element symbol and atomic number, optionally with the numeric property value. This visualization fuses an immediately recognizable fixed grid with heatmap encoding, turning a familiar reference chart into a tool for spotting periodic trends at a glance.
# anyplot.ai
# heatmap-periodic-table: Periodic Table Property Heatmap
# Library: makie 0.22.10 | Julia 1.11.9
# Quality: 88/100 | Created: 2026-06-15

using CairoMakie
using Colors

const THEME        = get(ENV, "ANYPLOT_THEME", "light")
const PAGE_BG      = THEME == "light" ? colorant"#FAF8F1" : colorant"#1A1A17"
const INK          = THEME == "light" ? colorant"#1A1A17" : colorant"#F0EFE8"
const INK_SOFT     = THEME == "light" ? colorant"#4A4A44" : colorant"#B8B7B0"
const INK_MUTED    = THEME == "light" ? colorant"#6B6A63" : colorant"#A8A79F"
const TILE_MISSING = THEME == "light" ? colorant"#D8D6CE" : colorant"#383834"

# Imprint sequential colormap: brand green → blue (single-polarity continuous data)
const ANYPLOT_SEQ = cgrad([colorant"#009E73", colorant"#4467A3"])

# Element data: (symbol, atomic_number, display_col, display_row, pauling_electronegativity)
# display_col 1–18; display_row 1–7 (main table), 8.5 (lanthanides), 9.5 (actinides)
# NaN = no standard Pauling electronegativity value
const ELEMENTS = [
    # Period 1
    ("H",   1,  1, 1.0, 2.20), ("He",  2, 18, 1.0, NaN),
    # Period 2
    ("Li",  3,  1, 2.0, 0.98), ("Be",  4,  2, 2.0, 1.57),
    ("B",   5, 13, 2.0, 2.04), ("C",   6, 14, 2.0, 2.55),
    ("N",   7, 15, 2.0, 3.04), ("O",   8, 16, 2.0, 3.44),
    ("F",   9, 17, 2.0, 3.98), ("Ne", 10, 18, 2.0, NaN),
    # Period 3
    ("Na", 11,  1, 3.0, 0.93), ("Mg", 12,  2, 3.0, 1.31),
    ("Al", 13, 13, 3.0, 1.61), ("Si", 14, 14, 3.0, 1.90),
    ("P",  15, 15, 3.0, 2.19), ("S",  16, 16, 3.0, 2.58),
    ("Cl", 17, 17, 3.0, 3.16), ("Ar", 18, 18, 3.0, NaN),
    # Period 4
    ("K",  19,  1, 4.0, 0.82), ("Ca", 20,  2, 4.0, 1.00),
    ("Sc", 21,  3, 4.0, 1.36), ("Ti", 22,  4, 4.0, 1.54),
    ("V",  23,  5, 4.0, 1.63), ("Cr", 24,  6, 4.0, 1.66),
    ("Mn", 25,  7, 4.0, 1.55), ("Fe", 26,  8, 4.0, 1.83),
    ("Co", 27,  9, 4.0, 1.88), ("Ni", 28, 10, 4.0, 1.91),
    ("Cu", 29, 11, 4.0, 1.90), ("Zn", 30, 12, 4.0, 1.65),
    ("Ga", 31, 13, 4.0, 1.81), ("Ge", 32, 14, 4.0, 2.01),
    ("As", 33, 15, 4.0, 2.18), ("Se", 34, 16, 4.0, 2.55),
    ("Br", 35, 17, 4.0, 2.96), ("Kr", 36, 18, 4.0, 3.00),
    # Period 5
    ("Rb", 37,  1, 5.0, 0.82), ("Sr", 38,  2, 5.0, 0.95),
    ("Y",  39,  3, 5.0, 1.22), ("Zr", 40,  4, 5.0, 1.33),
    ("Nb", 41,  5, 5.0, 1.60), ("Mo", 42,  6, 5.0, 2.16),
    ("Tc", 43,  7, 5.0, 1.90), ("Ru", 44,  8, 5.0, 2.20),
    ("Rh", 45,  9, 5.0, 2.28), ("Pd", 46, 10, 5.0, 2.20),
    ("Ag", 47, 11, 5.0, 1.93), ("Cd", 48, 12, 5.0, 1.69),
    ("In", 49, 13, 5.0, 1.78), ("Sn", 50, 14, 5.0, 1.96),
    ("Sb", 51, 15, 5.0, 2.05), ("Te", 52, 16, 5.0, 2.10),
    ("I",  53, 17, 5.0, 2.66), ("Xe", 54, 18, 5.0, 2.60),
    # Period 6 (col 3 left empty for f-block pointer tile)
    ("Cs", 55,  1, 6.0, 0.79), ("Ba", 56,  2, 6.0, 0.89),
    ("Hf", 72,  4, 6.0, 1.30), ("Ta", 73,  5, 6.0, 1.50),
    ("W",  74,  6, 6.0, 2.36), ("Re", 75,  7, 6.0, 1.90),
    ("Os", 76,  8, 6.0, 2.20), ("Ir", 77,  9, 6.0, 2.20),
    ("Pt", 78, 10, 6.0, 2.28), ("Au", 79, 11, 6.0, 2.54),
    ("Hg", 80, 12, 6.0, 2.00), ("Tl", 81, 13, 6.0, 1.62),
    ("Pb", 82, 14, 6.0, 2.33), ("Bi", 83, 15, 6.0, 2.02),
    ("Po", 84, 16, 6.0, 2.00), ("At", 85, 17, 6.0, 2.20),
    ("Rn", 86, 18, 6.0, NaN),
    # Period 7 (col 3 left empty for f-block pointer tile)
    ("Fr", 87,  1, 7.0, 0.70), ("Ra", 88,  2, 7.0, 0.89),
    ("Rf",104,  4, 7.0, NaN), ("Db",105,  5, 7.0, NaN),
    ("Sg",106,  6, 7.0, NaN), ("Bh",107,  7, 7.0, NaN),
    ("Hs",108,  8, 7.0, NaN), ("Mt",109,  9, 7.0, NaN),
    ("Ds",110, 10, 7.0, NaN), ("Rg",111, 11, 7.0, NaN),
    ("Cn",112, 12, 7.0, NaN), ("Nh",113, 13, 7.0, NaN),
    ("Fl",114, 14, 7.0, NaN), ("Mc",115, 15, 7.0, NaN),
    ("Lv",116, 16, 7.0, NaN), ("Ts",117, 17, 7.0, NaN),
    ("Og",118, 18, 7.0, NaN),
    # Lanthanides (f-block row 1, cols 3–17)
    ("La", 57,  3, 8.5, 1.10), ("Ce", 58,  4, 8.5, 1.12),
    ("Pr", 59,  5, 8.5, 1.13), ("Nd", 60,  6, 8.5, 1.14),
    ("Pm", 61,  7, 8.5, NaN),  ("Sm", 62,  8, 8.5, 1.17),
    ("Eu", 63,  9, 8.5, NaN),  ("Gd", 64, 10, 8.5, 1.20),
    ("Tb", 65, 11, 8.5, NaN),  ("Dy", 66, 12, 8.5, 1.22),
    ("Ho", 67, 13, 8.5, 1.23), ("Er", 68, 14, 8.5, 1.24),
    ("Tm", 69, 15, 8.5, 1.25), ("Yb", 70, 16, 8.5, NaN),
    ("Lu", 71, 17, 8.5, 1.27),
    # Actinides (f-block row 2, cols 3–17)
    ("Ac", 89,  3, 9.5, 1.10), ("Th", 90,  4, 9.5, 1.30),
    ("Pa", 91,  5, 9.5, 1.50), ("U",  92,  6, 9.5, 1.38),
    ("Np", 93,  7, 9.5, 1.36), ("Pu", 94,  8, 9.5, 1.28),
    ("Am", 95,  9, 9.5, 1.30), ("Cm", 96, 10, 9.5, 1.30),
    ("Bk", 97, 11, 9.5, 1.30), ("Cf", 98, 12, 9.5, 1.30),
    ("Es", 99, 13, 9.5, 1.30), ("Fm",100, 14, 9.5, 1.30),
    ("Md",101, 15, 9.5, 1.30), ("No",102, 16, 9.5, 1.30),
    ("Lr",103, 17, 9.5, NaN),
]

# Colormap range over elements with a known EN value
const EN_VALS  = [en for (_, _, _, _, en) in ELEMENTS if !isnan(en)]
const EN_MIN   = minimum(EN_VALS)   # 0.70 (Fr)
const EN_MAX   = maximum(EN_VALS)   # 3.98 (F)

function tile_color(en::Float64)
    isnan(en) && return TILE_MISSING
    t = clamp((en - EN_MIN) / (EN_MAX - EN_MIN), 0.0, 1.0)
    return get(ANYPLOT_SEQ, t)
end

function text_color_for(c)
    lum = 0.299 * Float64(red(c)) + 0.587 * Float64(green(c)) + 0.114 * Float64(blue(c))
    return lum > 0.45 ? colorant"#1A1A17" : colorant"#F0EFE8"
end

# --- Figure -----------------------------------------------------------------
fig = Figure(
    size            = (1600, 900),
    fontsize        = 14,
    backgroundcolor = PAGE_BG,
    figure_padding  = 16,
)

ax = Axis(
    fig[1, 1];
    title               = "heatmap-periodic-table · julia · makie · anyplot.ai",
    titlesize           = 20,
    titlecolor          = INK,
    subtitle            = "Pauling electronegativity: highest at F (3.98, top-right), lowest at Fr (0.70, bottom-left)",
    subtitlesize        = 11,
    subtitlecolor       = INK_SOFT,
    backgroundcolor     = PAGE_BG,
    xticksvisible       = false,
    yticksvisible       = false,
    xticklabelsvisible  = false,
    yticklabelsvisible  = false,
    topspinevisible     = false,
    rightspinevisible   = false,
    leftspinevisible    = false,
    bottomspinevisible  = false,
    xgridvisible        = false,
    ygridvisible        = false,
)

xlims!(ax, 0.5, 18.5)
ylims!(ax, 0.0, 10.1)

# Flip y so period 1 appears at the top: dy = 10.5 - display_row
# period 1 → dy=9.5 (near top), actinides → dy=1.0 (near bottom)
flip_y(row) = 10.5 - row

# --- Draw element tiles and labels ------------------------------------------
const TILE_HALF = 0.45f0   # half-side of each square tile (gap ≈ 0.10 per side)

for (sym, z, dx, row, en) in ELEMENTS
    dy  = flip_y(row)
    tc  = tile_color(en)
    ltc = isnan(en) ? INK_MUTED : text_color_for(tc)

    # Tile rectangle centred at (dx, dy)
    poly!(ax, Rect2f(dx - TILE_HALF, dy - TILE_HALF, 2 * TILE_HALF, 2 * TILE_HALF);
          color = tc)

    # Atomic number — upper-left corner of tile (dy+0.22 is visually above centre)
    text!(ax, dx - 0.33, dy + 0.22;
          text      = string(z),
          fontsize   = 7.5,
          color      = ltc,
          align      = (:left, :center))

    # Element symbol — centred, slightly below the atomic number
    text!(ax, dx, dy - 0.08;
          text      = sym,
          fontsize   = 9,
          color      = ltc,
          align      = (:center, :center))
end

# --- F-block pointer tiles at col 3 of periods 6 and 7 ---------------------
for row in (6.0, 7.0)
    dy = flip_y(row)
    poly!(ax, Rect2f(3 - TILE_HALF, dy - TILE_HALF, 2 * TILE_HALF, 2 * TILE_HALF);
          color = TILE_MISSING)
    text!(ax, 3.0, dy;
          text      = "*",
          fontsize   = 11,
          color      = INK_MUTED,
          align      = (:center, :center))
end

# --- F-block row annotations -----------------------------------------------
text!(ax, 2.0, flip_y(8.5); text = "Ln", fontsize = 7, color = INK_MUTED, align = (:center, :center))
text!(ax, 2.0, flip_y(9.5); text = "An", fontsize = 7, color = INK_MUTED, align = (:center, :center))

# --- Colorbar ---------------------------------------------------------------
cbar = Colorbar(fig[1, 2];
    colormap        = ANYPLOT_SEQ,
    limits          = (EN_MIN, EN_MAX),
    label           = "Pauling Electronegativity",
    labelcolor      = INK,
    labelsize       = 12,
    tickcolor       = INK_SOFT,
    ticklabelcolor  = INK_SOFT,
    ticklabelsize   = 10,
    width           = 18,
    flipaxis        = false,
)

colsize!(fig.layout, 1, Relative(0.92))

# --- Save -------------------------------------------------------------------
save("plot-$(THEME).png", fig; px_per_unit = 2)
Runnable source as JSON, for any HTTP client: https://api.anyplot.ai/specs/heatmap-periodic-table/makie/code. Any spec id and library id listed in llms-full.txt fit the same URL shape; every URL below is complete and callable.
{
  "spec_id": "heatmap-periodic-table",
  "language": "julia",
  "library": "makie",
  "page": "https://anyplot.ai/heatmap-periodic-table/julia/makie",
  "hub": "https://anyplot.ai/heatmap-periodic-table",
  "code_json": "https://api.anyplot.ai/specs/heatmap-periodic-table/makie/code",
  "spec_json": "https://api.anyplot.ai/specs/heatmap-periodic-table",
  "render_light_png": "https://storage.googleapis.com/anyplot-images/plots/heatmap-periodic-table/julia/makie/plot-light.png",
  "render_dark_png": "https://storage.googleapis.com/anyplot-images/plots/heatmap-periodic-table/julia/makie/plot-dark.png",
  "quality_score": 88.0,
  "license": "MIT",
  "guide": "https://anyplot.ai/llms.txt"
}
Part of Periodic Table Property Heatmap on anyplot.ai.