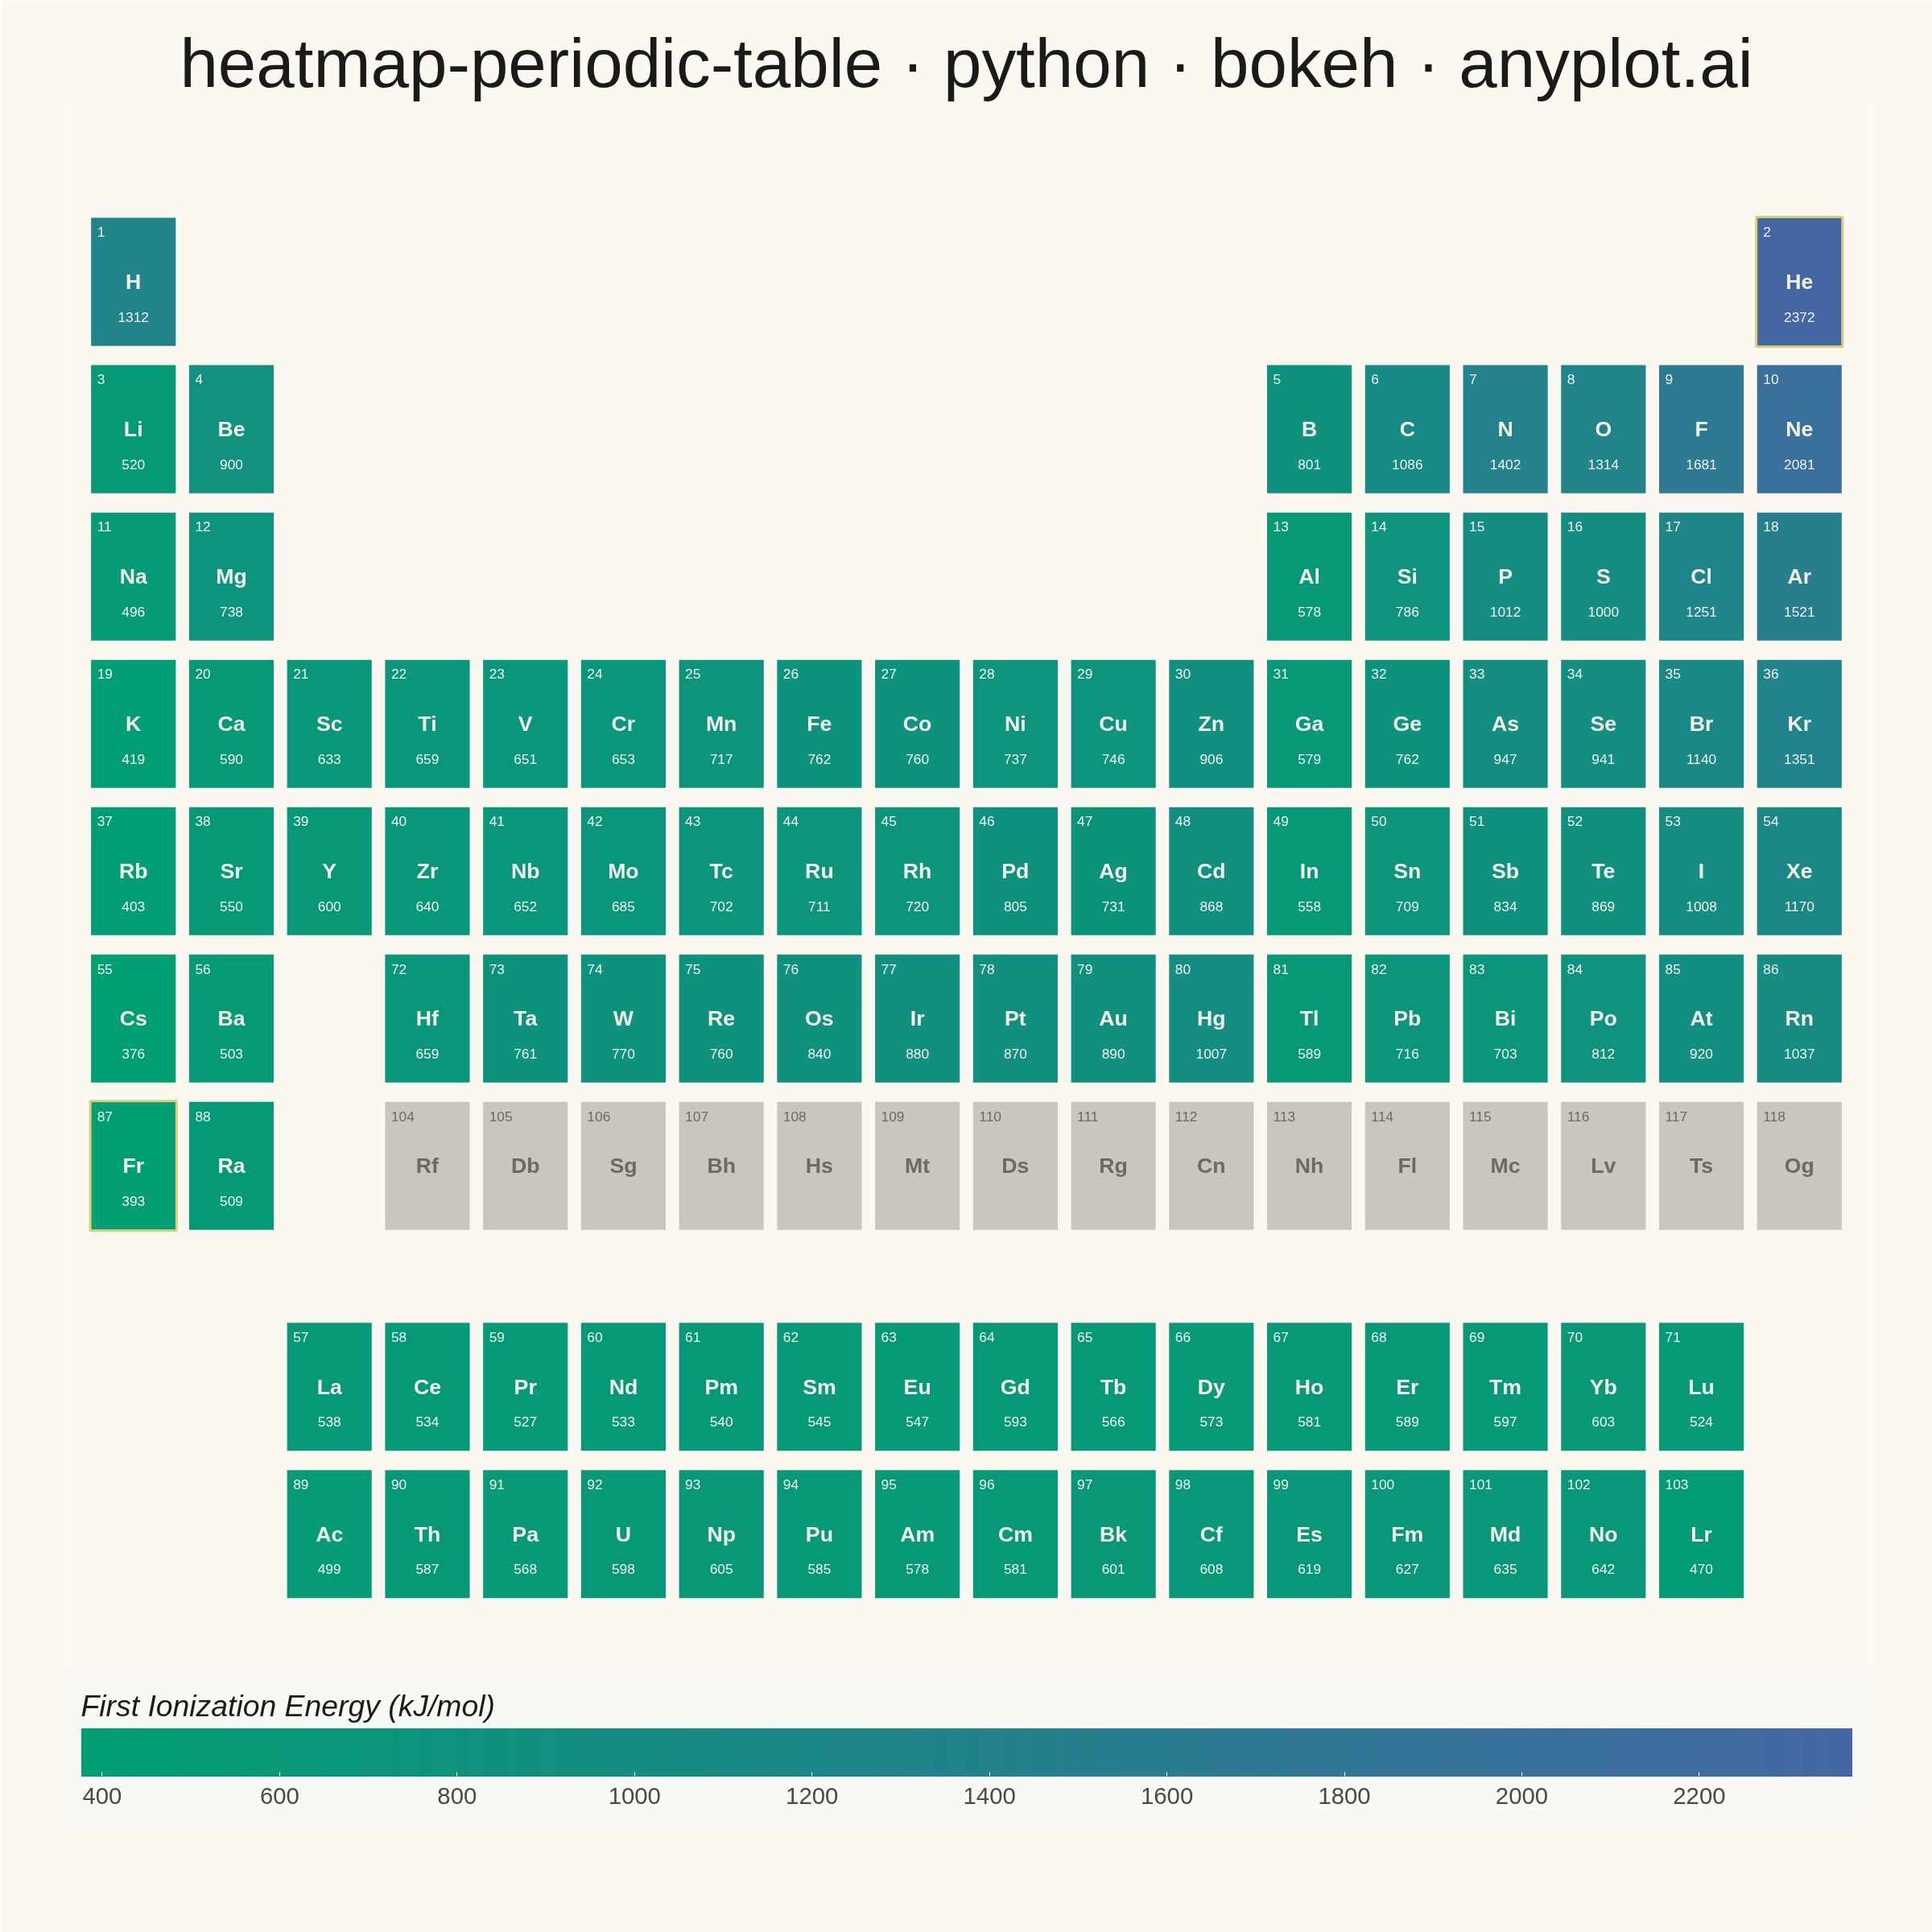
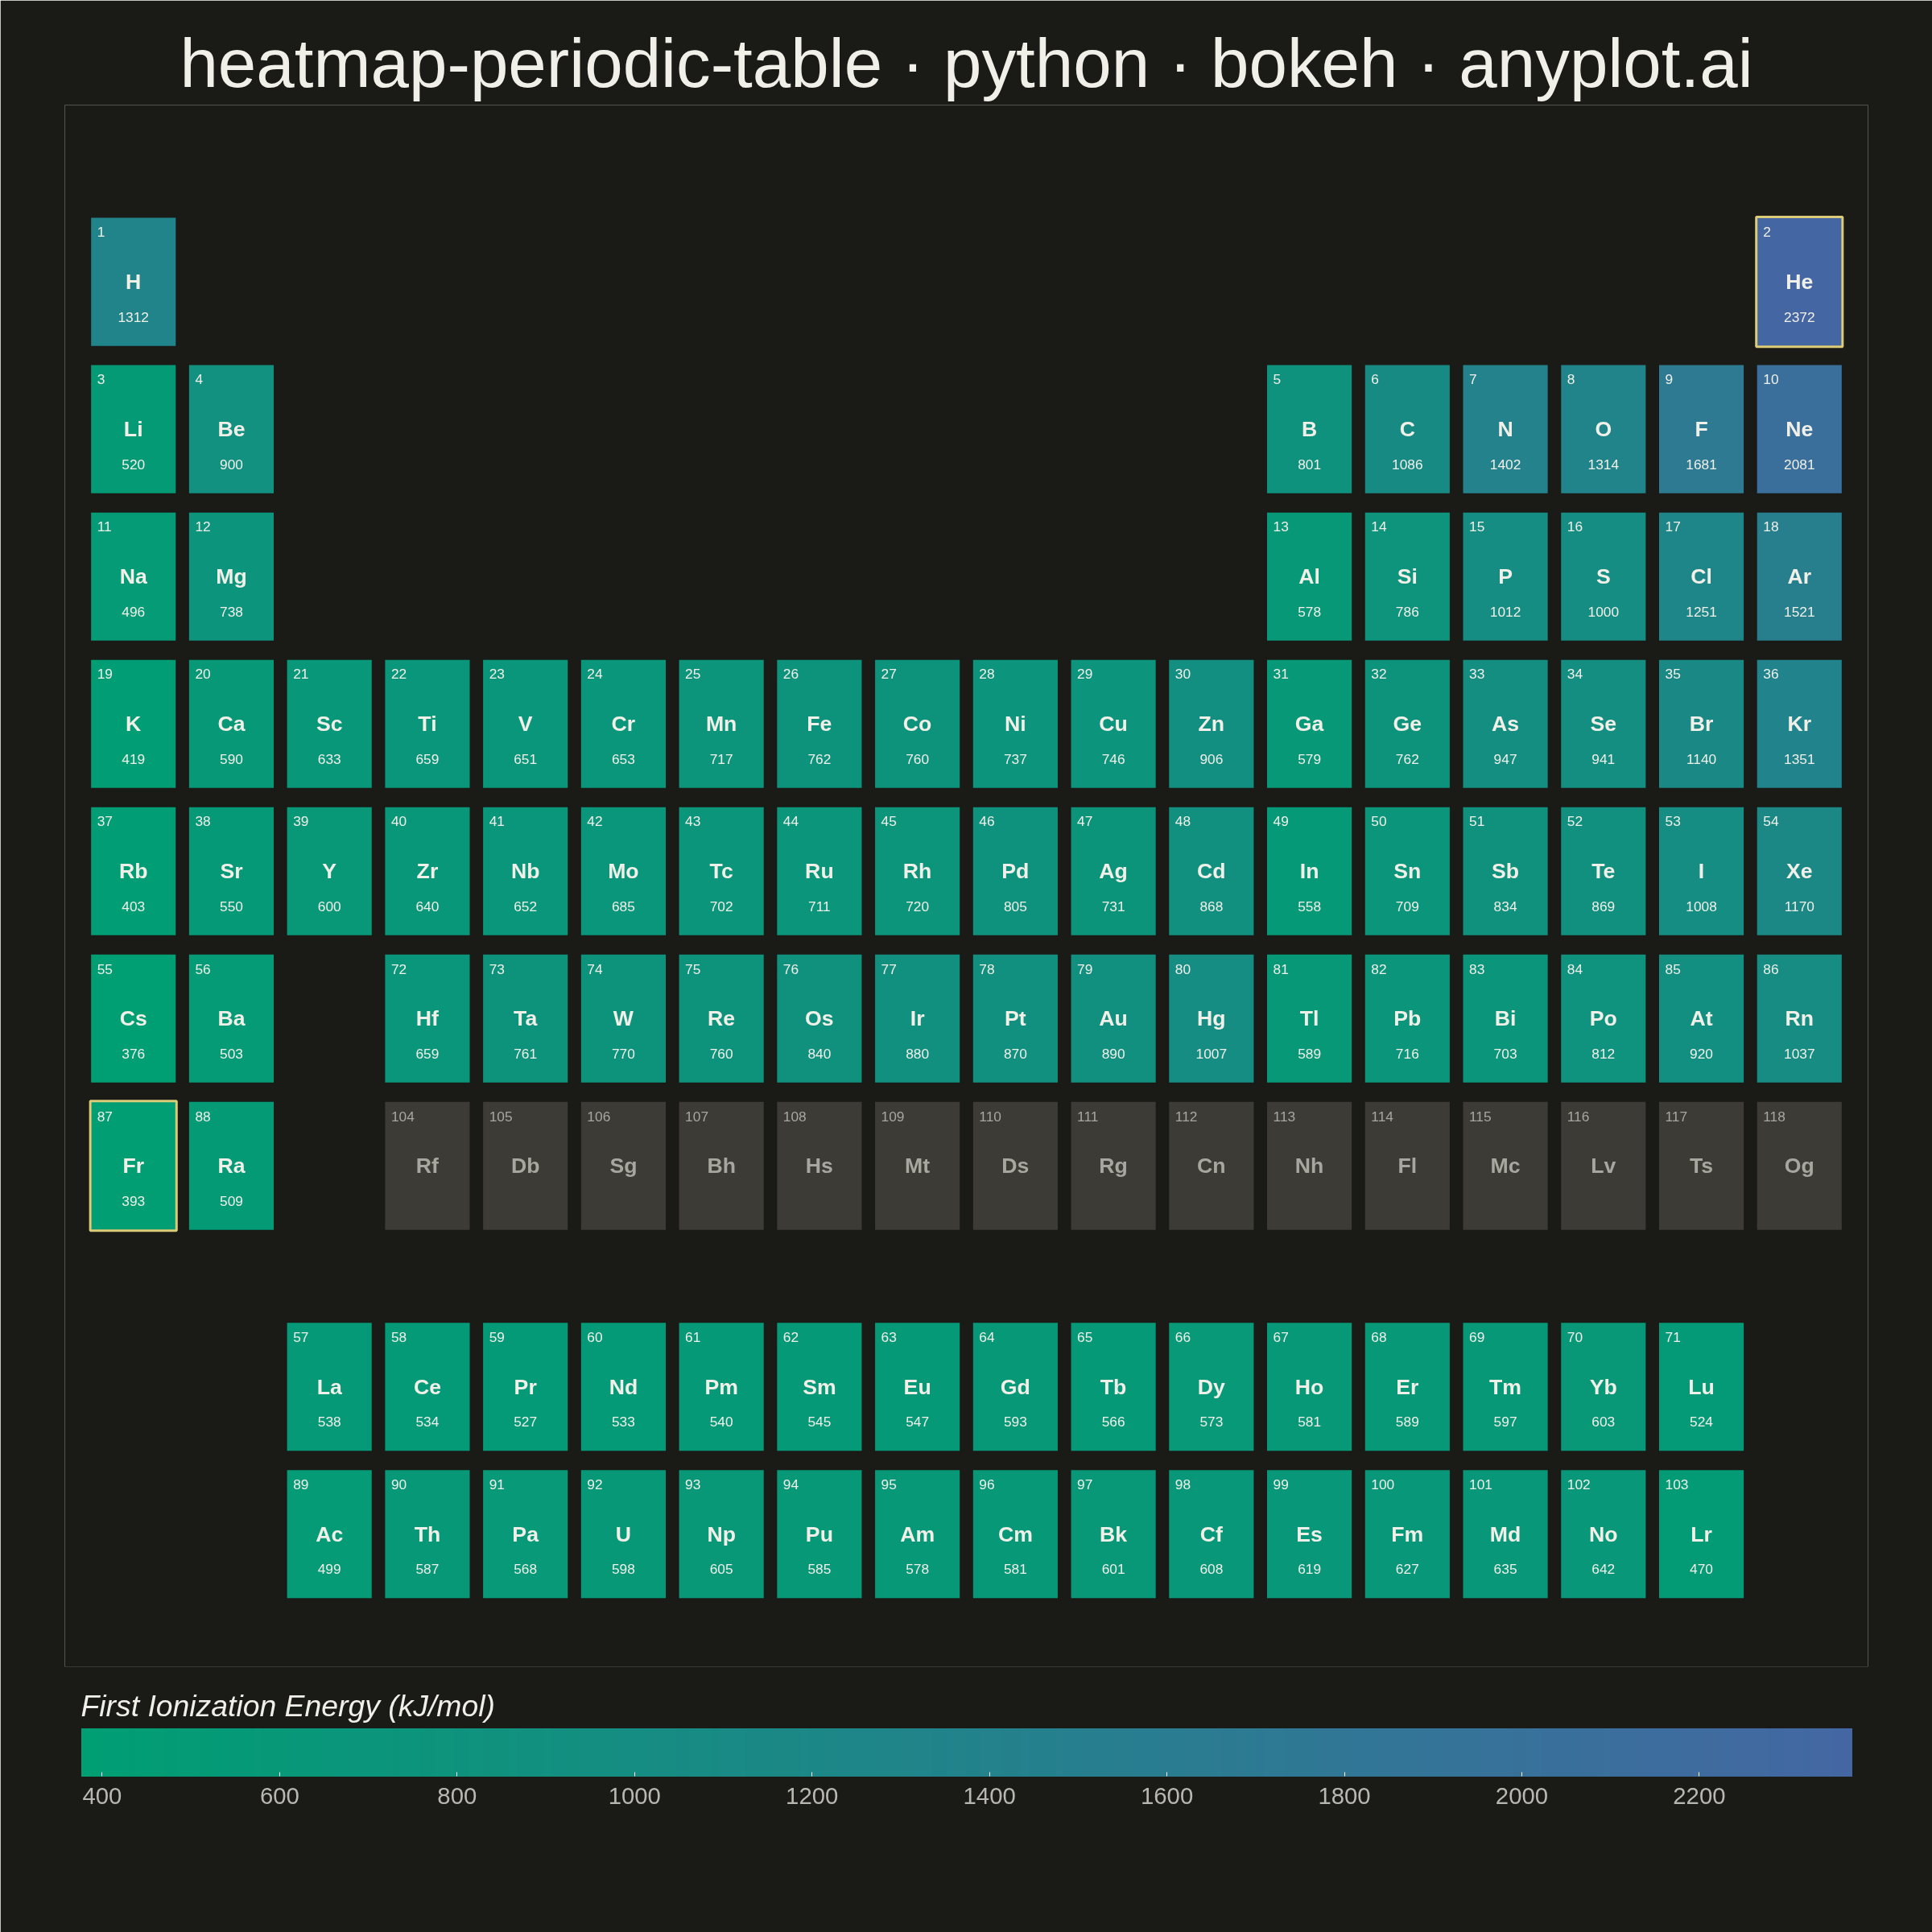
A periodic table of the elements rendered in its canonical layout — 18 groups across by 7 periods down, with the lanthanide and actinide series detached as two separate rows below — where each element tile is colored by a continuous property such as electronegativity, atomic radius, melting point, or first ionization energy. A colorbar maps tile color to property value, and every tile carries the element symbol and atomic number, optionally with the numeric property value. This visualization fuses an immediately recognizable fixed grid with heatmap encoding, turning a familiar reference chart into a tool for spotting periodic trends at a glance.
""" anyplot.ai
heatmap-periodic-table: Periodic Table Property Heatmap
Library: bokeh 3.9.1 | Python 3.13.13
Quality: 88/100 | Created: 2026-06-15
"""

import os
import sys
import time
from pathlib import Path


# Remove this script's own directory from sys.path so `import bokeh` resolves
# to the installed package rather than this file (which shares its name).
_this_dir = str(Path(__file__).resolve().parent)
sys.path[:] = [p for p in sys.path if p != _this_dir]

from bokeh.io import output_file, save
from bokeh.models import BasicTicker, ColorBar, ColumnDataSource, LinearColorMapper, Range1d
from bokeh.plotting import figure
from selenium import webdriver
from selenium.webdriver.chrome.options import Options


THEME = os.getenv("ANYPLOT_THEME", "light")
PAGE_BG = "#FAF8F1" if THEME == "light" else "#1A1A17"
INK = "#1A1A17" if THEME == "light" else "#F0EFE8"
INK_SOFT = "#4A4A44" if THEME == "light" else "#B8B7B0"
INK_MUTED = "#6B6A63" if THEME == "light" else "#A8A79F"
AMBER = "#DDCC77"


# Imprint sequential colormap: brand-green → blue (single-polarity continuous)
def _lerp_hex(c0, c1, t):
    r0, g0, b0 = (int(c0[i : i + 2], 16) for i in (1, 3, 5))
    r1, g1, b1 = (int(c1[i : i + 2], 16) for i in (1, 3, 5))
    return "#{:02X}{:02X}{:02X}".format(
        int(round(r0 + (r1 - r0) * t)), int(round(g0 + (g1 - g0) * t)), int(round(b0 + (b1 - b0) * t))
    )


IMPRINT_SEQ = [_lerp_hex("#009E73", "#4467A3", t / 255.0) for t in range(256)]
GREY_TILE = "#C8C6BE" if THEME == "light" else "#3C3B36"

# Focal elements: He (Z=2, IE=2372 — highest) and Fr (Z=87, IE=393 — lowest)
FOCAL_Z = {2, 87}


def _lum(hx):
    def _lin(c):
        return c / 12.92 if c <= 0.04045 else ((c + 0.055) / 1.055) ** 2.4

    return sum(
        w * _lin(int(hx[i : i + 2], 16) / 255.0) for w, i in zip((0.2126, 0.7152, 0.0722), (1, 3, 5), strict=False)
    )


# Element symbols (index = atomic number)
SYMBOLS = [
    "",
    "H",
    "He",
    "Li",
    "Be",
    "B",
    "C",
    "N",
    "O",
    "F",
    "Ne",
    "Na",
    "Mg",
    "Al",
    "Si",
    "P",
    "S",
    "Cl",
    "Ar",
    "K",
    "Ca",
    "Sc",
    "Ti",
    "V",
    "Cr",
    "Mn",
    "Fe",
    "Co",
    "Ni",
    "Cu",
    "Zn",
    "Ga",
    "Ge",
    "As",
    "Se",
    "Br",
    "Kr",
    "Rb",
    "Sr",
    "Y",
    "Zr",
    "Nb",
    "Mo",
    "Tc",
    "Ru",
    "Rh",
    "Pd",
    "Ag",
    "Cd",
    "In",
    "Sn",
    "Sb",
    "Te",
    "I",
    "Xe",
    "Cs",
    "Ba",
    "La",
    "Ce",
    "Pr",
    "Nd",
    "Pm",
    "Sm",
    "Eu",
    "Gd",
    "Tb",
    "Dy",
    "Ho",
    "Er",
    "Tm",
    "Yb",
    "Lu",
    "Hf",
    "Ta",
    "W",
    "Re",
    "Os",
    "Ir",
    "Pt",
    "Au",
    "Hg",
    "Tl",
    "Pb",
    "Bi",
    "Po",
    "At",
    "Rn",
    "Fr",
    "Ra",
    "Ac",
    "Th",
    "Pa",
    "U",
    "Np",
    "Pu",
    "Am",
    "Cm",
    "Bk",
    "Cf",
    "Es",
    "Fm",
    "Md",
    "No",
    "Lr",
    "Rf",
    "Db",
    "Sg",
    "Bh",
    "Hs",
    "Mt",
    "Ds",
    "Rg",
    "Cn",
    "Nh",
    "Fl",
    "Mc",
    "Lv",
    "Ts",
    "Og",
]

# First ionization energies in kJ/mol
IE = {
    1: 1312,
    2: 2372,
    3: 520,
    4: 900,
    5: 801,
    6: 1086,
    7: 1402,
    8: 1314,
    9: 1681,
    10: 2081,
    11: 496,
    12: 738,
    13: 578,
    14: 786,
    15: 1012,
    16: 1000,
    17: 1251,
    18: 1521,
    19: 419,
    20: 590,
    21: 633,
    22: 659,
    23: 651,
    24: 653,
    25: 717,
    26: 762,
    27: 760,
    28: 737,
    29: 746,
    30: 906,
    31: 579,
    32: 762,
    33: 947,
    34: 941,
    35: 1140,
    36: 1351,
    37: 403,
    38: 550,
    39: 600,
    40: 640,
    41: 652,
    42: 685,
    43: 702,
    44: 711,
    45: 720,
    46: 805,
    47: 731,
    48: 868,
    49: 558,
    50: 709,
    51: 834,
    52: 869,
    53: 1008,
    54: 1170,
    55: 376,
    56: 503,
    57: 538,
    58: 534,
    59: 527,
    60: 533,
    61: 540,
    62: 545,
    63: 547,
    64: 593,
    65: 566,
    66: 573,
    67: 581,
    68: 589,
    69: 597,
    70: 603,
    71: 524,
    72: 659,
    73: 761,
    74: 770,
    75: 760,
    76: 840,
    77: 880,
    78: 870,
    79: 890,
    80: 1007,
    81: 589,
    82: 716,
    83: 703,
    84: 812,
    85: 920,
    86: 1037,
    87: 393,
    88: 509,
    89: 499,
    90: 587,
    91: 568,
    92: 598,
    93: 605,
    94: 585,
    95: 578,
    96: 581,
    97: 601,
    98: 608,
    99: 619,
    100: 627,
    101: 635,
    102: 642,
    103: 470,
}


def _build_grid():
    """Return {atomic_number: (col, row)} using standard periodic table layout.
    Lanthanides/actinides placed in detached f-block rows below the main body.
    """
    g = {}
    g[1] = (1, 1)
    g[2] = (18, 1)
    g[3] = (1, 2)
    g[4] = (2, 2)
    for z in range(5, 11):
        g[z] = (z + 8, 2)  # B→13 … Ne→18
    g[11] = (1, 3)
    g[12] = (2, 3)
    for z in range(13, 19):
        g[z] = (z, 3)  # Al→13 … Ar→18
    for z in range(19, 37):
        g[z] = (z - 18, 4)
    for z in range(37, 55):
        g[z] = (z - 36, 5)
    g[55] = (1, 6)
    g[56] = (2, 6)
    for z in range(72, 87):
        g[z] = (z - 68, 6)  # Hf→4 … Rn→18
    g[87] = (1, 7)
    g[88] = (2, 7)
    for z in range(104, 119):
        g[z] = (z - 100, 7)  # Rf→4 … Og→18
    # Lanthanides (La–Lu, Z=57–71): f-block row 1 at display y-row 8.5
    for i, z in enumerate(range(57, 72)):
        g[z] = (i + 3, 8.5)
    # Actinides (Ac–Lr, Z=89–103): f-block row 2 at display y-row 9.5
    for i, z in enumerate(range(89, 104)):
        g[z] = (i + 3, 9.5)
    return g


GRID = _build_grid()

ie_min = min(IE.values())
ie_max = max(IE.values())

# Build unified data arrays for all tiles (colored + grey) in a single pass
xs, ys, fcs, tcs, syms, nstrs, nxs, nys, ie_strs, ivys = [], [], [], [], [], [], [], [], [], []
focal_xs, focal_ys = [], []

for z in range(1, 119):
    if z not in GRID:
        continue
    cx, cy = GRID[z]
    sym = SYMBOLS[z] if z < len(SYMBOLS) else ""
    yd = -cy  # negate: period 1 → y=-1 (near top of Range1d upper bound)

    if z in IE:
        ie = IE[z]
        nrm = (ie - ie_min) / (ie_max - ie_min)
        idx = min(255, int(round(nrm * 255)))
        fc = IMPRINT_SEQ[idx]
        tc = "#F0EFE8" if _lum(fc) < 0.35 else "#1A1A17"
        ie_str = str(ie)
    else:
        fc = GREY_TILE
        tc = INK_MUTED
        ie_str = ""

    xs.append(cx)
    ys.append(yd)
    fcs.append(fc)
    tcs.append(tc)
    syms.append(sym)
    nstrs.append(str(z))
    nxs.append(cx - 0.37)
    nys.append(yd + 0.37)
    ie_strs.append(ie_str)
    ivys.append(yd - 0.27)

    if z in FOCAL_Z:
        focal_xs.append(cx)
        focal_ys.append(yd)

# Figure — square canvas (2400×2400) for symmetric grid layout
title_str = "heatmap-periodic-table · python · bokeh · anyplot.ai"
n_chars = len(title_str)
title_pt = f"{max(34, round(50 * 67 / n_chars))}pt"

p = figure(
    width=2400,
    height=2400,
    title=title_str,
    toolbar_location=None,
    x_range=Range1d(0.3, 18.7),
    y_range=Range1d(-10.4, 0.2),
    min_border_bottom=330,
    min_border_left=80,
    min_border_top=130,
    min_border_right=80,
)

# Linear color mapper (Imprint sequential palette) — used for ColorBar
mapper = LinearColorMapper(palette=IMPRINT_SEQ, low=ie_min, high=ie_max)

# Single ColumnDataSource for all tiles (colored + grey unified)
src = ColumnDataSource(
    {"x": xs, "y": ys, "fc": fcs, "tc": tcs, "s": syms, "nstr": nstrs, "nx": nxs, "ny": nys, "ie": ie_strs, "ivy": ivys}
)

# All tile rectangles (precomputed fill colors; seamless PAGE_BG borders)
p.rect(x="x", y="y", width=0.88, height=0.88, source=src, fill_color={"field": "fc"}, line_color=PAGE_BG, line_width=2)

# Amber border highlights for focal elements: He (highest IE) and Fr (lowest IE)
src_focal = ColumnDataSource({"x": focal_xs, "y": focal_ys})
p.rect(x="x", y="y", width=0.88, height=0.88, source=src_focal, fill_alpha=0, line_color=AMBER, line_width=3)

# Element symbol — bold, centered
p.text(
    x="x",
    y="y",
    text="s",
    source=src,
    text_align="center",
    text_baseline="middle",
    text_color={"field": "tc"},
    text_font_size="20pt",
    text_font_style="bold",
)
# Atomic number — small, top-left of tile
p.text(
    x="nx",
    y="ny",
    text="nstr",
    source=src,
    text_align="left",
    text_baseline="top",
    text_color={"field": "tc"},
    text_font_size="13pt",
)
# IE value — bottom of tile (13pt for balance; empty string for grey tiles)
p.text(
    x="x",
    y="ivy",
    text="ie",
    source=src,
    text_align="center",
    text_baseline="bottom",
    text_color={"field": "tc"},
    text_font_size="13pt",
)

# Colorbar — horizontal, placed below plot area
color_bar = ColorBar(
    color_mapper=mapper,
    ticker=BasicTicker(desired_num_ticks=9),
    label_standoff=14,
    border_line_color=None,
    orientation="horizontal",
    title="First Ionization Energy (kJ/mol)",
    title_text_color=INK,
    title_text_font_size="28pt",
    title_standoff=14,
    major_label_text_color=INK_SOFT,
    major_label_text_font_size="22pt",
    background_fill_color=PAGE_BG,
    bar_line_color=None,
    height=60,
    padding=20,
)
p.add_layout(color_bar, "below")

# Chrome — theme-adaptive
p.background_fill_color = PAGE_BG
p.border_fill_color = PAGE_BG
p.outline_line_color = None
p.outline_line_alpha = 0  # fully suppress dark-mode frame outline artifact

p.title.text_color = INK
p.title.text_font_size = title_pt
p.title.text_font_style = "normal"
p.title.align = "center"

p.xaxis.visible = False
p.yaxis.visible = False
p.xgrid.grid_line_color = None
p.ygrid.grid_line_color = None

# Save interactive HTML, then screenshot via headless Chrome
output_file(f"plot-{THEME}.html")
save(p)

W, H = 2400, 2400
opts = Options()
for arg in (
    "--headless=new",
    "--no-sandbox",
    "--disable-dev-shm-usage",
    "--disable-gpu",
    f"--window-size={W},{H}",
    "--hide-scrollbars",
):
    opts.add_argument(arg)
driver = webdriver.Chrome(options=opts)
# CDP override forces exact W×H viewport regardless of outer window chrome
driver.execute_cdp_cmd(
    "Emulation.setDeviceMetricsOverride", {"width": W, "height": H, "deviceScaleFactor": 1, "mobile": False}
)
driver.get(f"file://{Path(f'plot-{THEME}.html').resolve()}")
time.sleep(3)
driver.save_screenshot(f"plot-{THEME}.png")
driver.quit()
Runnable source as JSON, for any HTTP client: https://api.anyplot.ai/specs/heatmap-periodic-table/bokeh/code. Any spec id and library id listed in llms-full.txt fit the same URL shape; every URL below is complete and callable.
{
  "spec_id": "heatmap-periodic-table",
  "language": "python",
  "library": "bokeh",
  "page": "https://anyplot.ai/heatmap-periodic-table/python/bokeh",
  "hub": "https://anyplot.ai/heatmap-periodic-table",
  "code_json": "https://api.anyplot.ai/specs/heatmap-periodic-table/bokeh/code",
  "spec_json": "https://api.anyplot.ai/specs/heatmap-periodic-table",
  "render_light_png": "https://storage.googleapis.com/anyplot-images/plots/heatmap-periodic-table/python/bokeh/plot-light.png",
  "render_dark_png": "https://storage.googleapis.com/anyplot-images/plots/heatmap-periodic-table/python/bokeh/plot-dark.png",
  "interactive_light_html": "https://storage.googleapis.com/anyplot-images/plots/heatmap-periodic-table/python/bokeh/plot-light.html",
  "interactive_dark_html": "https://storage.googleapis.com/anyplot-images/plots/heatmap-periodic-table/python/bokeh/plot-dark.html",
  "quality_score": 88.0,
  "license": "MIT",
  "guide": "https://anyplot.ai/llms.txt"
}
Part of Periodic Table Property Heatmap on anyplot.ai.