Source code in 15 libraries — Python: Altair, Bokeh, lets-plot, Matplotlib, Plotly, plotnine, Pygal, Seaborn; R: ggplot2; Julia: Makie.jl; JavaScript: Chart.js, D3.js, Apache ECharts, Highcharts, MUI X Charts.
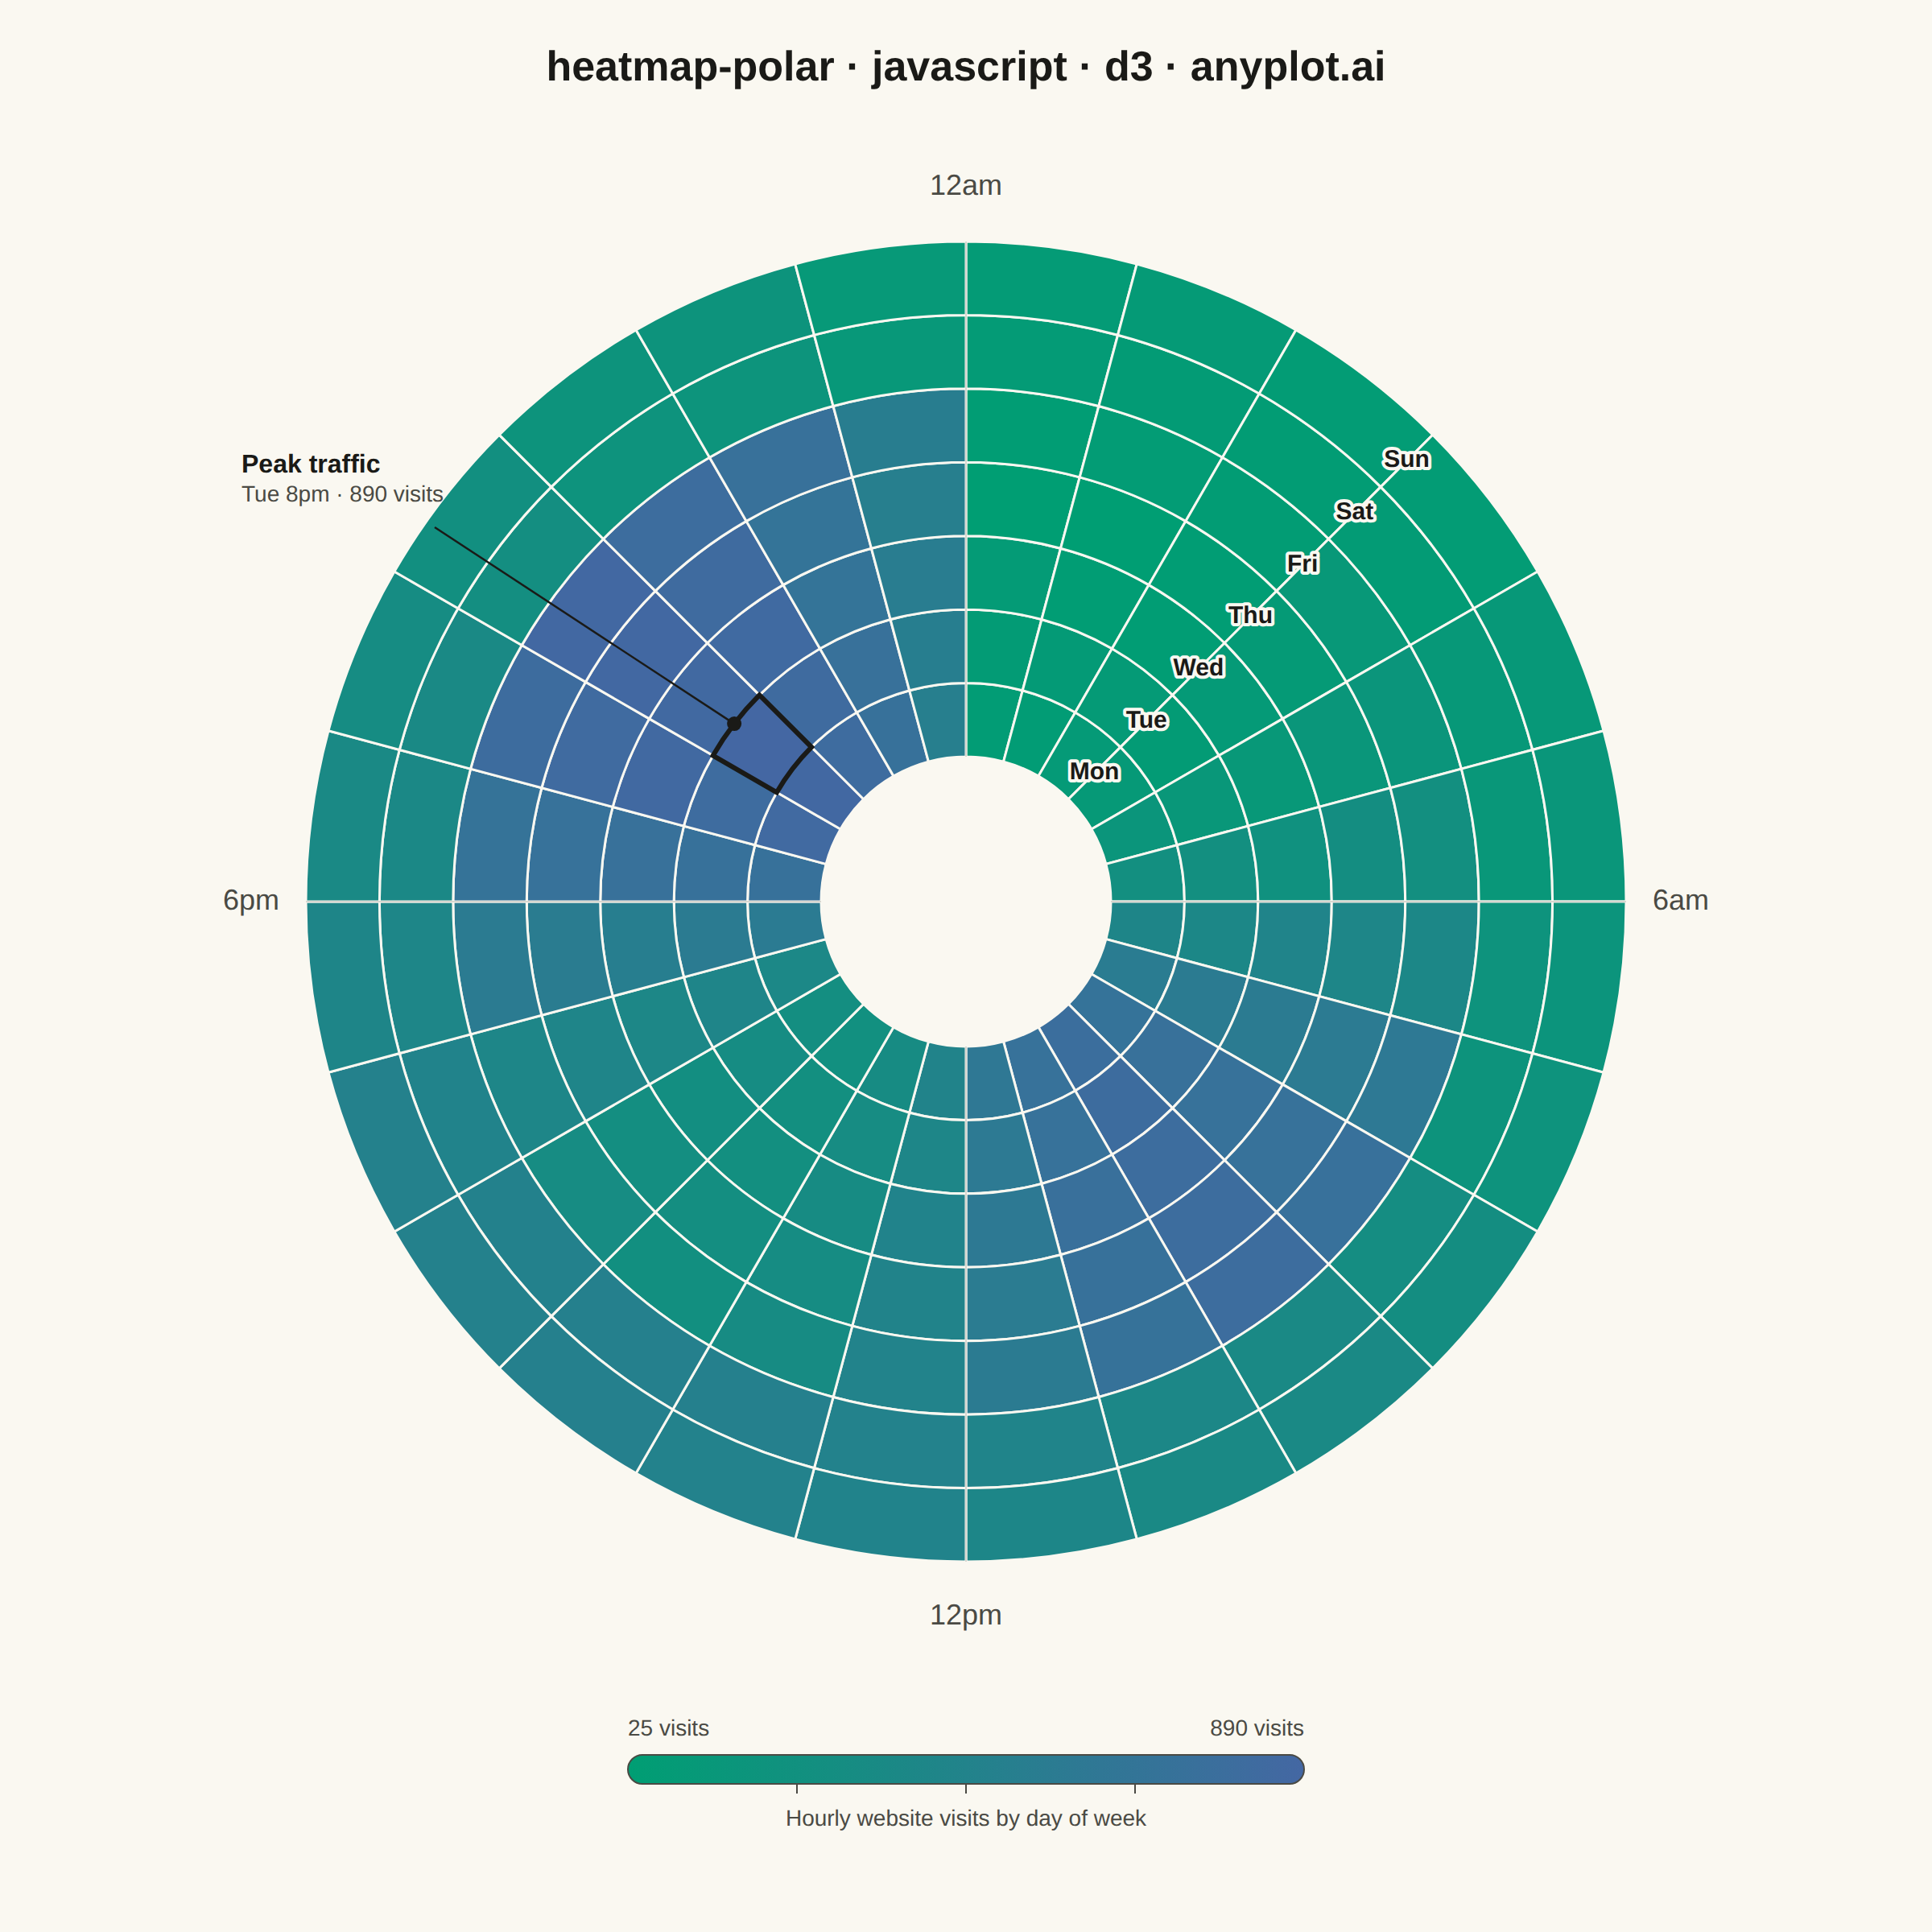
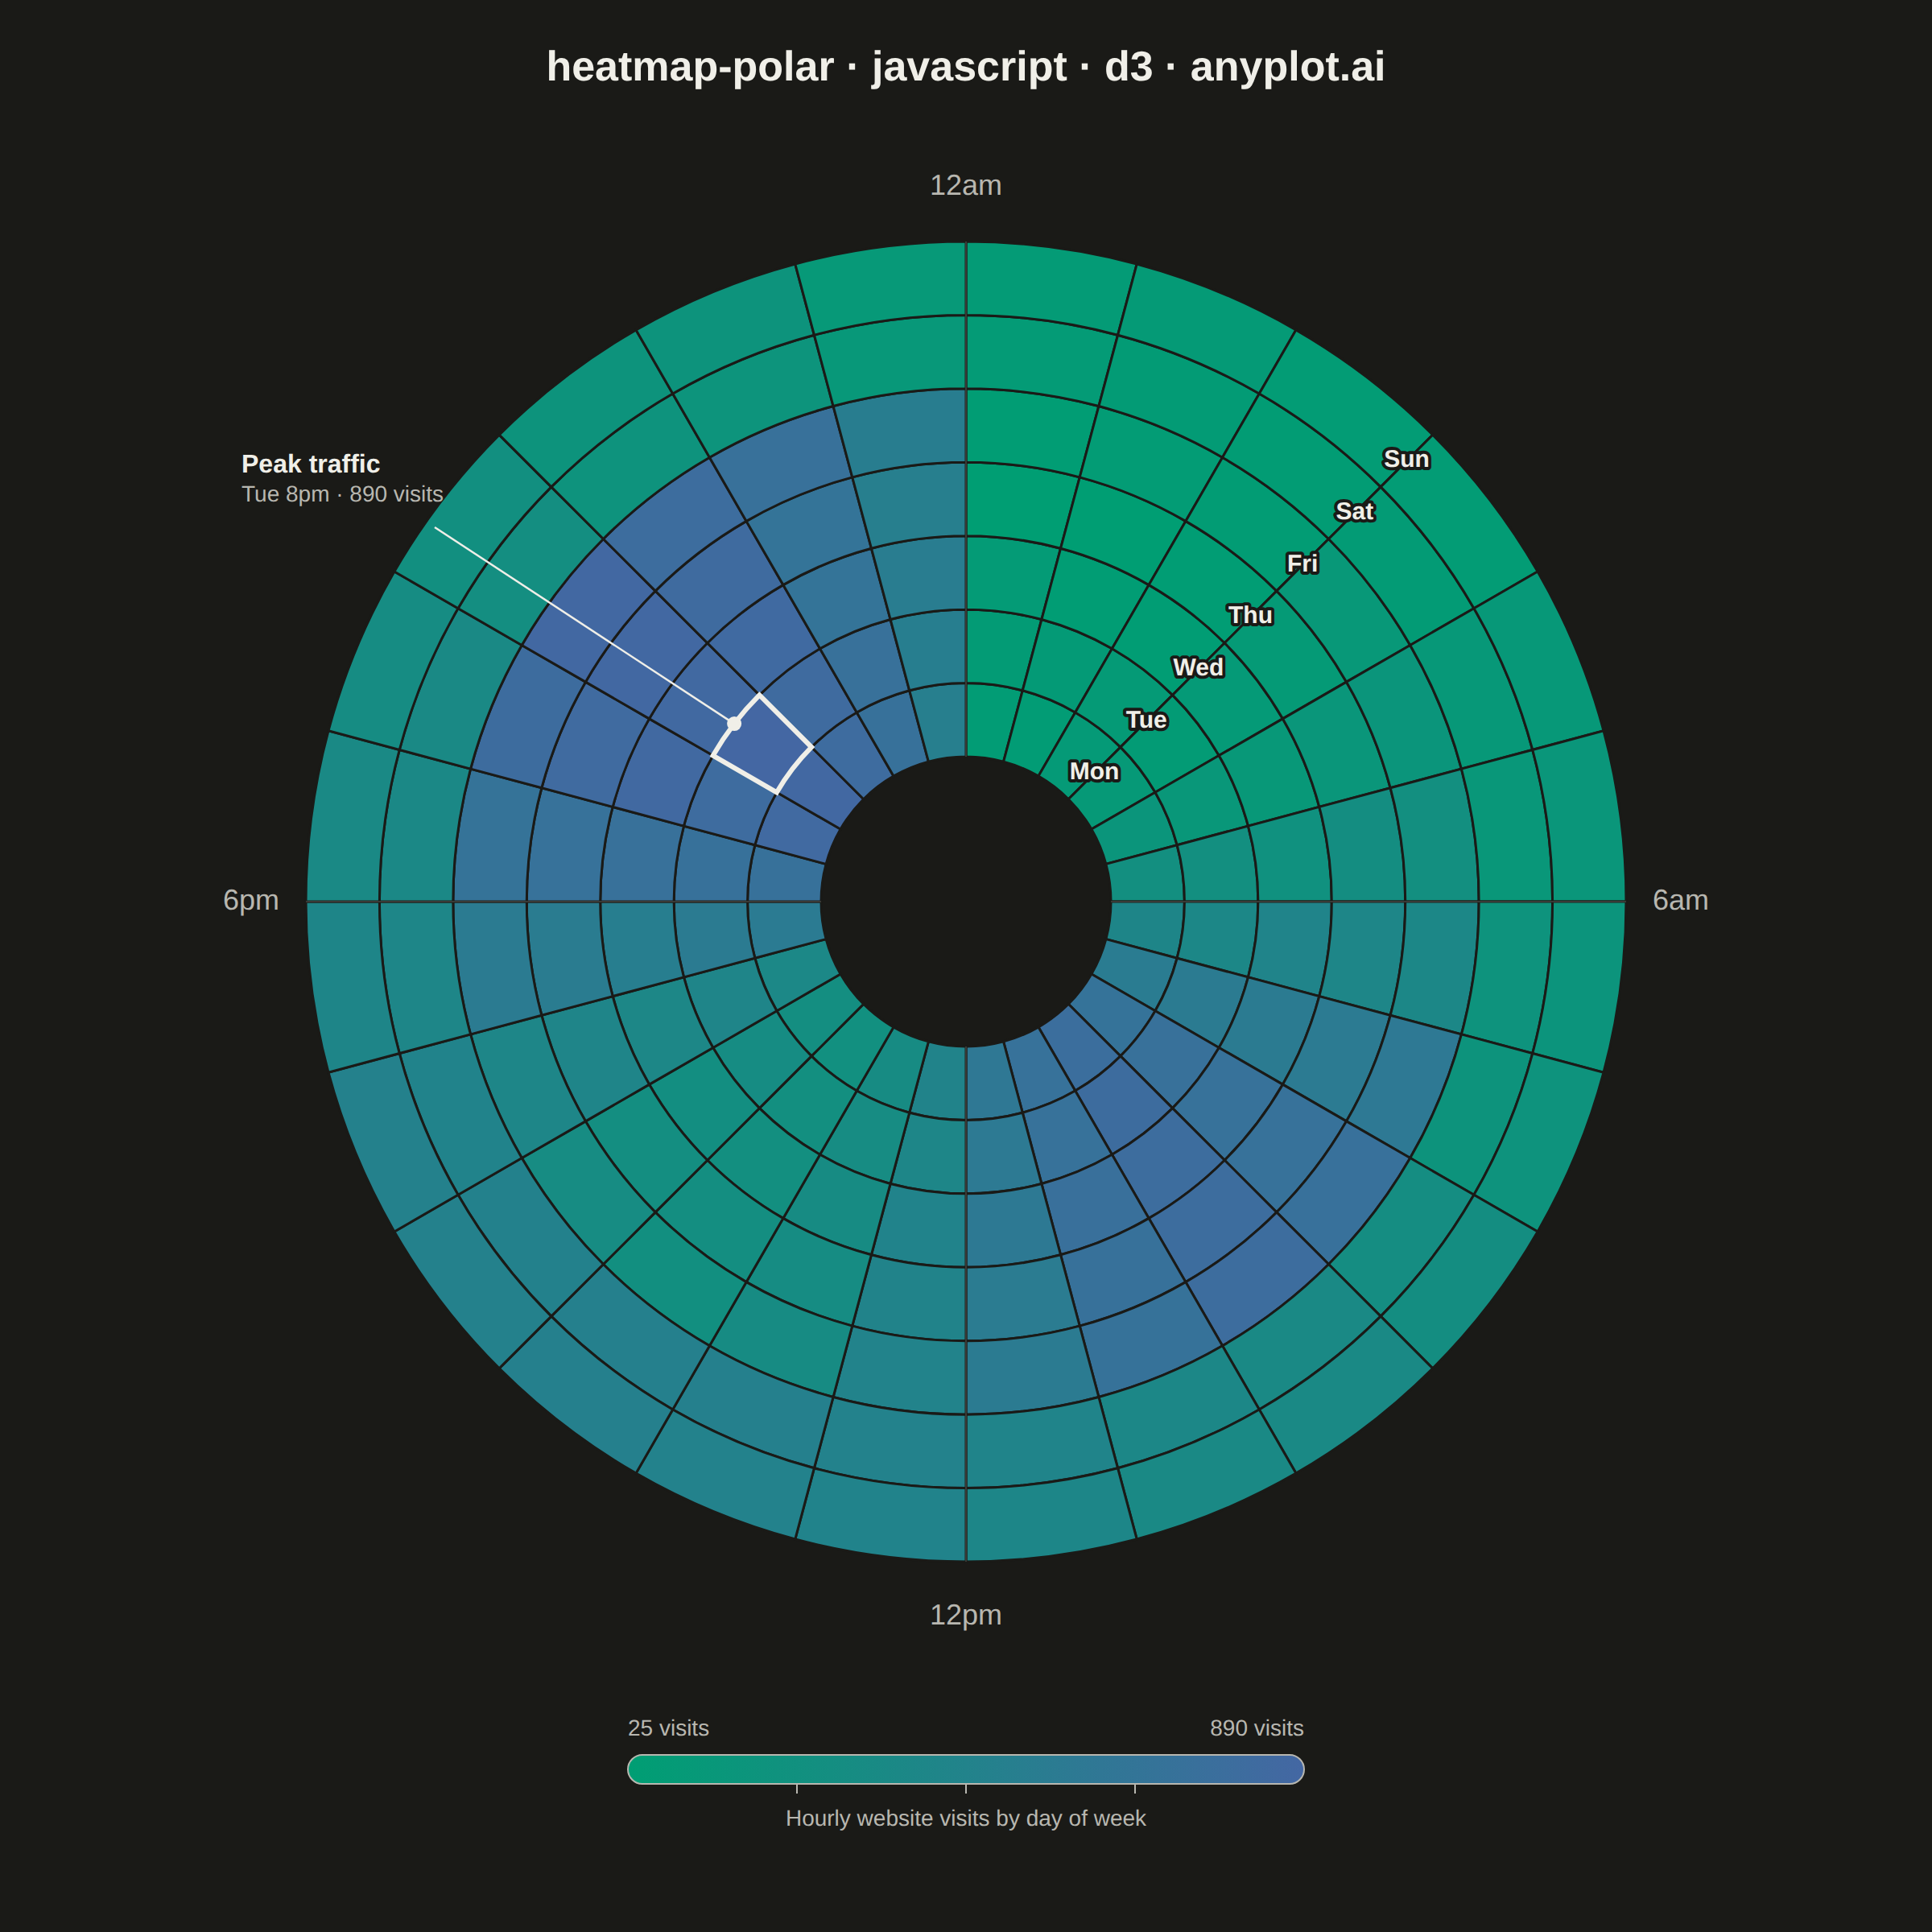
A heatmap wrapped around a circle where the angular axis represents a cyclic variable (e.g., hour of day, month) and the radial axis represents a second categorical or ordinal variable (e.g., day of week, year). Cell color encodes the measured value. This visualization reveals patterns in data with inherent cyclical structure that rectangular heatmaps distort, since the first and last angular bins are visually adjacent rather than separated at opposite ends of a row.
Preview render from the D3.js implementation.