The same plot in 14 other libraries — JavaScript: Chart.js, Apache ECharts, Highcharts, MUI X Charts; Python: Altair, Bokeh, lets-plot, Matplotlib, Plotly, plotnine, Pygal, Seaborn; R: ggplot2; Julia: Makie.jl. Compare all 15 side by side: Polar Heatmap for Cyclic Two-Dimensional Data in Python, R, Julia and JavaScript.
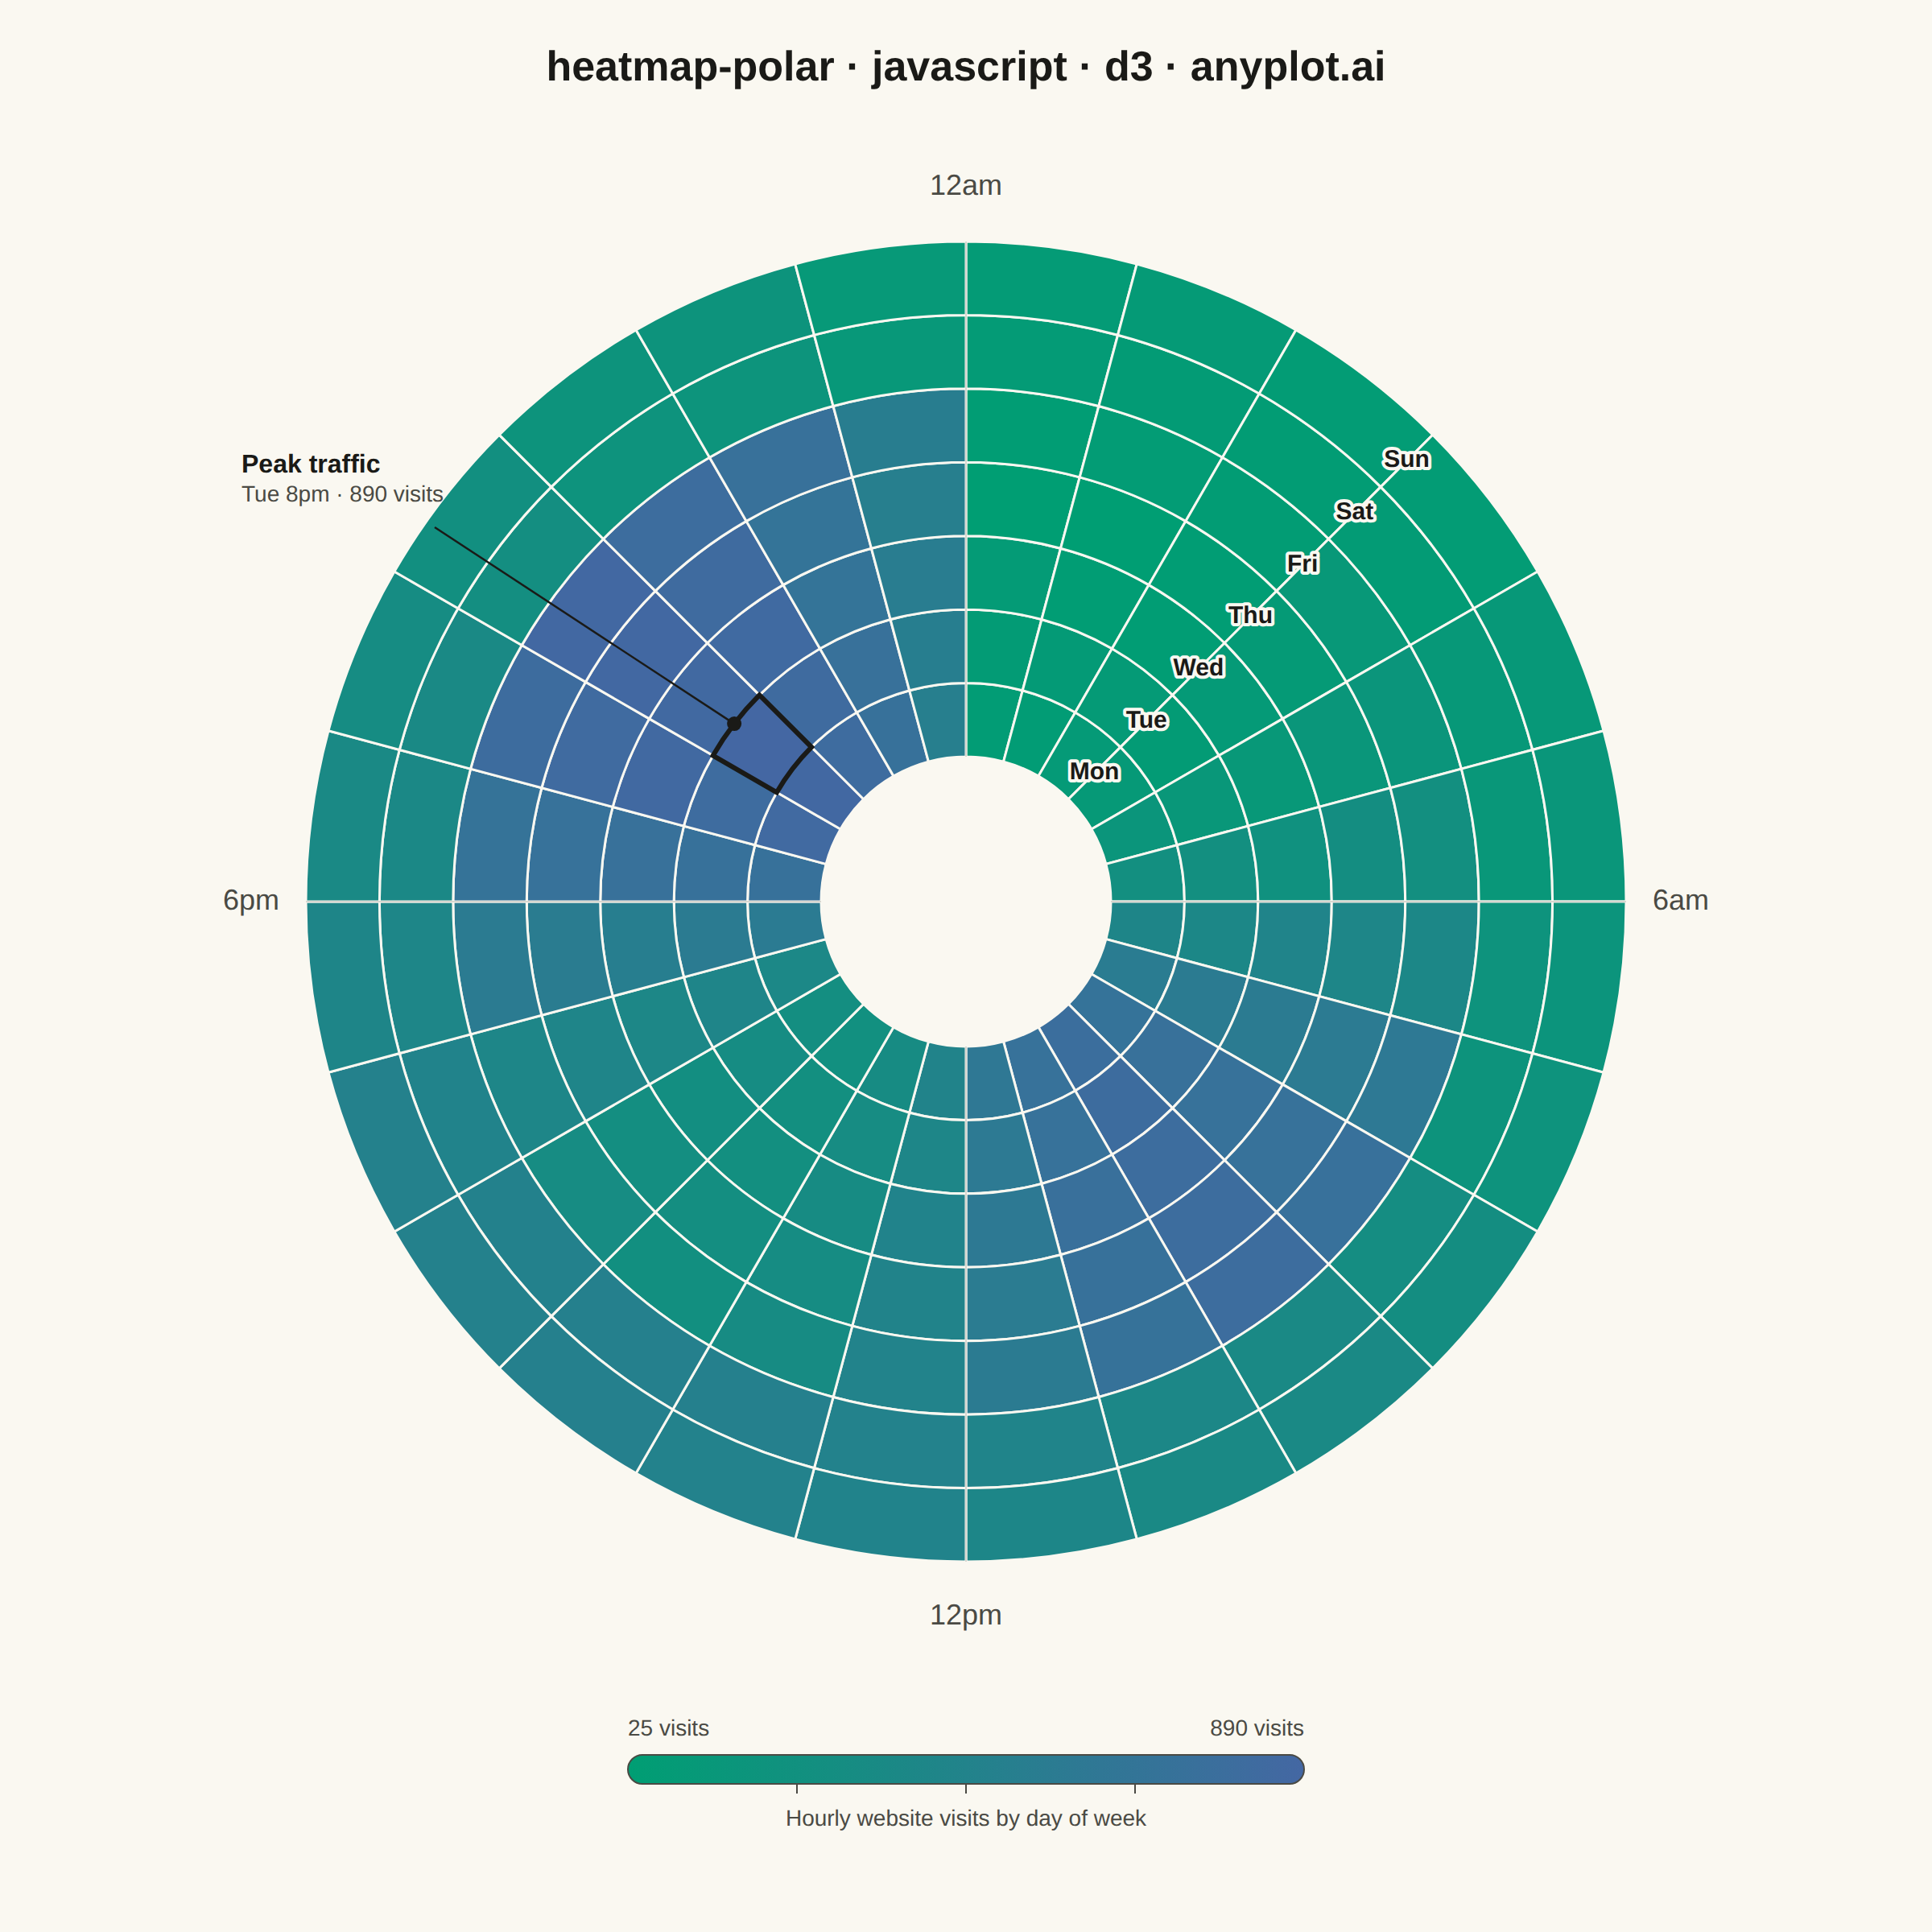
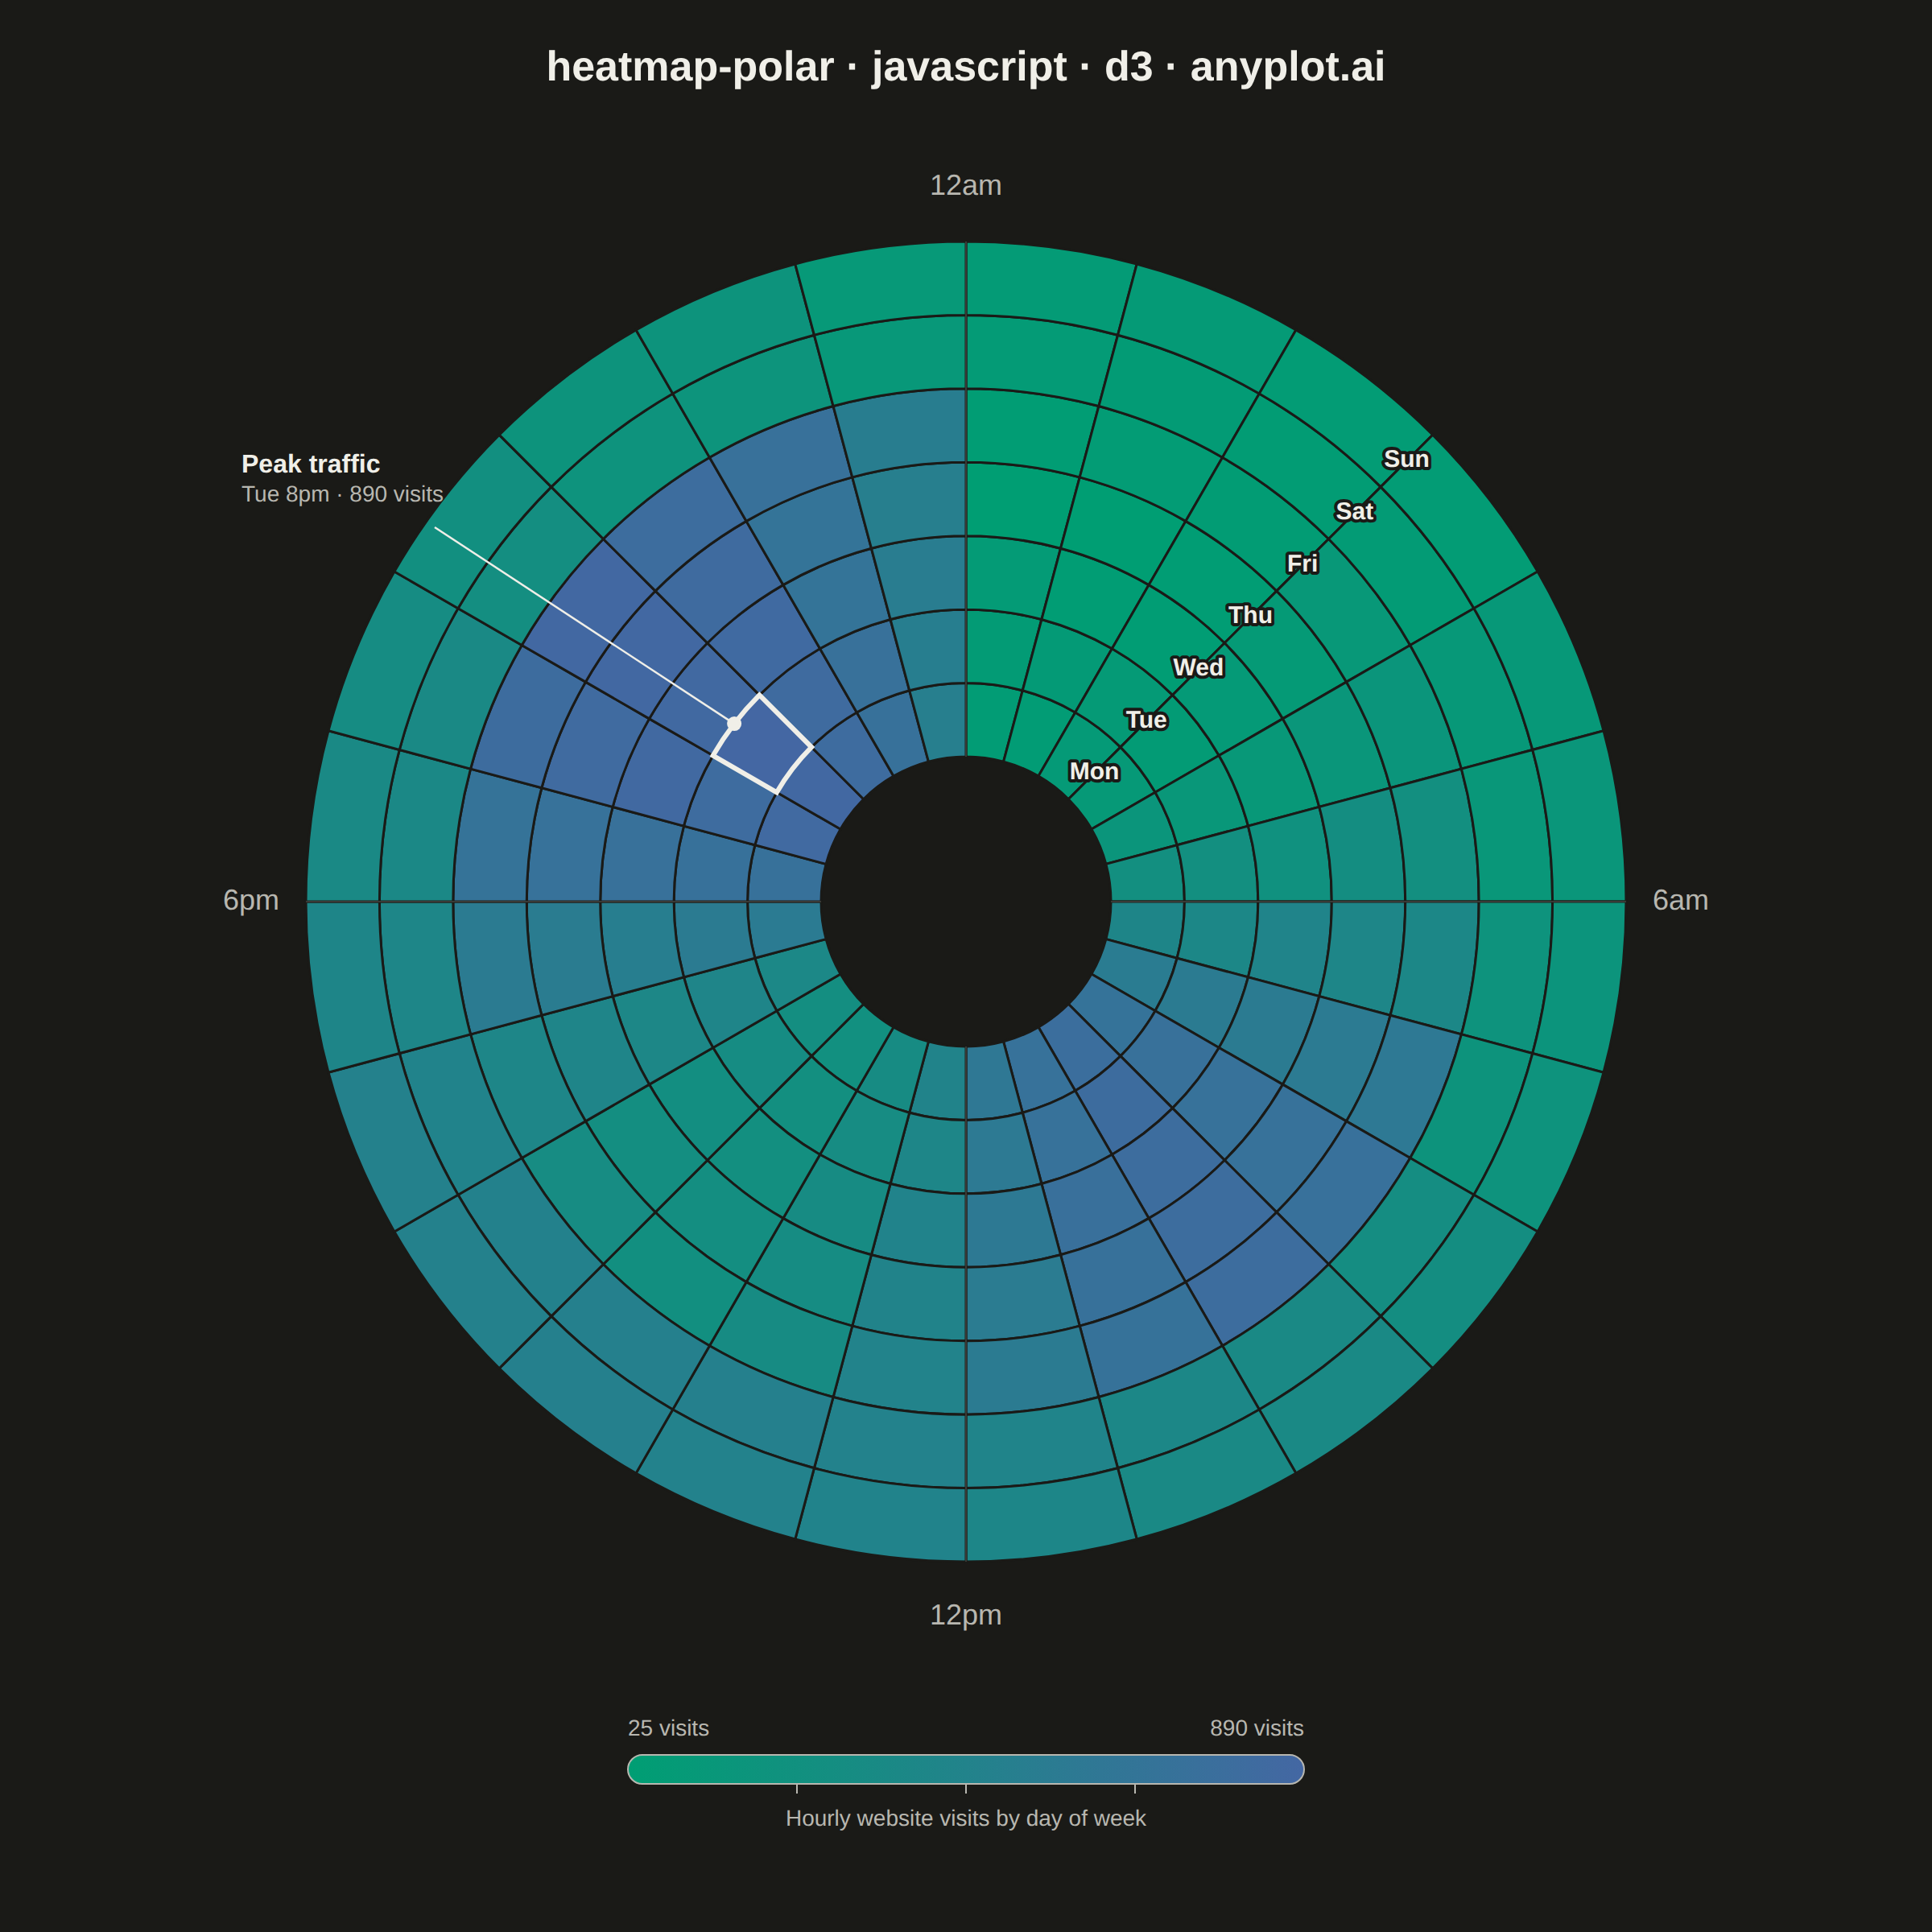
A heatmap wrapped around a circle where the angular axis represents a cyclic variable (e.g., hour of day, month) and the radial axis represents a second categorical or ordinal variable (e.g., day of week, year). Cell color encodes the measured value. This visualization reveals patterns in data with inherent cyclical structure that rectangular heatmaps distort, since the first and last angular bins are visually adjacent rather than separated at opposite ends of a row.
// anyplot.ai
// heatmap-polar: Polar Heatmap for Cyclic Two-Dimensional Data
// Library: d3 7.9.0 | JavaScript 22.23.2
// Quality: 92/100 | Created: 2026-09-05

//# anyplot-orientation: square

const t = window.ANYPLOT_TOKENS;
const { width, height } = window.ANYPLOT_SIZE;

// --- Data (in-memory, deterministic) ----------------------------------------
// Hourly website visits by day of week: hour-of-day is the angular axis
// (0-23, cyclic), day of week is the radial axis (Mon innermost, Sun outermost).
const days = ["Mon", "Tue", "Wed", "Thu", "Fri", "Sat", "Sun"];
const hours = d3.range(24);

const formatHour = (h) => {
  const displayHour = h % 12 === 0 ? 12 : h % 12;
  return `${displayHour}${h < 12 ? "am" : "pm"}`;
};

// Tiny fixed-seed LCG for reproducible jitter — Math.random() is not seedable.
let seed = 42;
function lcg() {
  seed = (seed * 1103515245 + 12345) & 0x7fffffff;
  return seed / 0x7fffffff;
}

function trafficShape(dayIndex, hour) {
  const isWeekend = dayIndex >= 5;
  const morningCommute = Math.exp(-((hour - 9) ** 2) / (2 * 2.5 ** 2));
  const eveningPeak = Math.exp(-((hour - 20) ** 2) / (2 * 3 ** 2));
  const lazyMidday = Math.exp(-((hour - 14) ** 2) / (2 * 5 ** 2));
  return isWeekend ? lazyMidday : morningCommute * 0.9 + eveningPeak;
}

const data = [];
for (let dayIndex = 0; dayIndex < days.length; dayIndex++) {
  const dayLevel = dayIndex >= 5 ? 0.55 : 1;
  for (const hour of hours) {
    const visits = Math.round(trafficShape(dayIndex, hour) * dayLevel * 820 + lcg() * 60 + 20);
    data.push({ dayIndex, hour, visits });
  }
}

const [minVisits, maxVisits] = d3.extent(data, (d) => d.visits);

// --- Scales ------------------------------------------------------------------
const angle = d3.scaleLinear().domain([0, 24]).range([0, 2 * Math.PI]);
const color = d3.scaleSequential(d3.interpolateRgbBasis(t.seq)).domain([minVisits, maxVisits]);

const cx = width / 2;
const cy = height / 2 - 40;
const outerRadius = Math.min(width, height) / 2 - 190;
const innerRadius0 = 90;
const ringWidth = (outerRadius - innerRadius0) / days.length;
const ringInner = (dayIndex) => innerRadius0 + dayIndex * ringWidth;
const ringOuter = (dayIndex) => innerRadius0 + (dayIndex + 1) * ringWidth;

// --- SVG mount -----------------------------------------------------------------
const svg = d3.select("#container").append("svg").attr("width", width).attr("height", height);
const g = svg.append("g").attr("transform", `translate(${cx},${cy})`);

// --- Cells (arc wedges) --------------------------------------------------------
const arc = d3
  .arc()
  .startAngle((d) => angle(d.hour))
  .endAngle((d) => angle(d.hour + 1))
  .innerRadius((d) => ringInner(d.dayIndex))
  .outerRadius((d) => ringOuter(d.dayIndex));

g.selectAll("path.cell")
  .data(data)
  .join("path")
  .attr("class", "cell")
  .attr("d", arc)
  .attr("fill", (d) => color(d.visits))
  .attr("stroke", t.pageBg)
  .attr("stroke-width", 1.5);

// --- Angular axis: labels + spokes at readable hour intervals -----------------
const majorHours = [0, 6, 12, 18];
const hourLabels = { 0: "12am", 6: "6am", 12: "12pm", 18: "6pm" };

g.selectAll("line.spoke")
  .data(majorHours)
  .join("line")
  .attr("class", "spoke")
  .attr("x1", (h) => Math.sin(angle(h)) * innerRadius0)
  .attr("y1", (h) => -Math.cos(angle(h)) * innerRadius0)
  .attr("x2", (h) => Math.sin(angle(h)) * outerRadius)
  .attr("y2", (h) => -Math.cos(angle(h)) * outerRadius)
  .attr("stroke", t.grid)
  .attr("stroke-width", 1);

g.selectAll("text.hour-label")
  .data(majorHours)
  .join("text")
  .attr("class", "hour-label")
  .attr("x", (h) => Math.sin(angle(h)) * (outerRadius + 34))
  .attr("y", (h) => -Math.cos(angle(h)) * (outerRadius + 34))
  .attr("text-anchor", "middle")
  .attr("dominant-baseline", "middle")
  .attr("fill", t.inkSoft)
  .style("font-size", "18px")
  .text((h) => hourLabels[h]);

// --- Radial axis: day labels along an empty 45-degree spoke -------------------
const labelAngle = angle(3);
g.selectAll("text.day-label")
  .data(days)
  .join("text")
  .attr("class", "day-label")
  .attr("x", (d, i) => Math.sin(labelAngle) * (ringInner(i) + ringWidth / 2))
  .attr("y", (d, i) => -Math.cos(labelAngle) * (ringInner(i) + ringWidth / 2))
  .attr("text-anchor", "middle")
  .attr("dominant-baseline", "middle")
  .style("font-size", "15px")
  .style("font-weight", "600")
  .style("paint-order", "stroke")
  .attr("stroke", t.pageBg)
  .attr("stroke-width", 4)
  .attr("stroke-linejoin", "round")
  .attr("fill", t.ink)
  .text((d) => d);

// --- Peak-cell highlight & story annotation ------------------------------------
// Calls out the single highest-traffic cell so the chart states its insight
// (morning-commute/evening-peak pattern) instead of relying on color alone.
const peak = data.reduce((best, d) => (d.visits > best.visits ? d : best), data[0]);
const peakMidAngle = angle(peak.hour + 0.5);
const peakOuterR = ringOuter(peak.dayIndex);
const peakPoint = {
  x: Math.sin(peakMidAngle) * peakOuterR,
  y: -Math.cos(peakMidAngle) * peakOuterR,
};
const peakLabelX = -outerRadius - 40;
const peakLabelY = -outerRadius * 0.65;

g.append("path")
  .attr("d", arc({ hour: peak.hour, dayIndex: peak.dayIndex }))
  .attr("fill", "none")
  .attr("stroke", t.ink)
  .attr("stroke-width", 3);

g.append("line")
  .attr("x1", peakPoint.x)
  .attr("y1", peakPoint.y)
  .attr("x2", peakLabelX + 120)
  .attr("y2", peakLabelY + 34)
  .attr("stroke", t.ink)
  .attr("stroke-width", 1.25);

g.append("circle")
  .attr("cx", peakPoint.x)
  .attr("cy", peakPoint.y)
  .attr("r", 4.5)
  .attr("fill", t.ink);

const peakLabel = g.append("text").attr("text-anchor", "start");
peakLabel
  .append("tspan")
  .attr("x", peakLabelX)
  .attr("y", peakLabelY)
  .style("font-size", "16px")
  .style("font-weight", "700")
  .attr("fill", t.ink)
  .text("Peak traffic");
peakLabel
  .append("tspan")
  .attr("x", peakLabelX)
  .attr("dy", "1.3em")
  .style("font-size", "14px")
  .attr("fill", t.inkSoft)
  .text(`${days[peak.dayIndex]} ${formatHour(peak.hour)} · ${peak.visits} visits`);

// --- Title ---------------------------------------------------------------------
svg
  .append("text")
  .attr("x", width / 2)
  .attr("y", 50)
  .attr("text-anchor", "middle")
  .attr("fill", t.ink)
  .style("font-size", "26px")
  .style("font-weight", "600")
  .text("heatmap-polar · javascript · d3 · anyplot.ai");

// --- Legend: sequential colorbar -------------------------------------------
const legendWidth = 420;
const legendHeight = 18;
const legendX = width / 2 - legendWidth / 2;
const legendY = height - 110;

const gradient = svg
  .append("defs")
  .append("linearGradient")
  .attr("id", "imprint-seq-gradient")
  .attr("x1", "0%")
  .attr("x2", "100%")
  .attr("y1", "0%")
  .attr("y2", "0%");

d3.range(0, 1.01, 0.1).forEach((stop) => {
  gradient
    .append("stop")
    .attr("offset", `${stop * 100}%`)
    .attr("stop-color", color(minVisits + stop * (maxVisits - minVisits)));
});

svg
  .append("rect")
  .attr("x", legendX)
  .attr("y", legendY)
  .attr("width", legendWidth)
  .attr("height", legendHeight)
  .attr("rx", legendHeight / 2)
  .attr("ry", legendHeight / 2)
  .attr("fill", "url(#imprint-seq-gradient)")
  .attr("stroke", t.inkSoft)
  .attr("stroke-width", 1);

// Intermediate tick marks give the colorbar a graduated feel beyond bare min/max
svg
  .selectAll("line.legend-tick")
  .data([0.25, 0.5, 0.75])
  .join("line")
  .attr("class", "legend-tick")
  .attr("x1", (frac) => legendX + frac * legendWidth)
  .attr("x2", (frac) => legendX + frac * legendWidth)
  .attr("y1", legendY + legendHeight)
  .attr("y2", legendY + legendHeight + 6)
  .attr("stroke", t.inkSoft)
  .attr("stroke-width", 1);

svg
  .append("text")
  .attr("x", legendX)
  .attr("y", legendY - 12)
  .attr("text-anchor", "start")
  .attr("fill", t.inkSoft)
  .style("font-size", "14px")
  .text(`${Math.round(minVisits)} visits`);

svg
  .append("text")
  .attr("x", legendX + legendWidth)
  .attr("y", legendY - 12)
  .attr("text-anchor", "end")
  .attr("fill", t.inkSoft)
  .style("font-size", "14px")
  .text(`${Math.round(maxVisits)} visits`);

svg
  .append("text")
  .attr("x", width / 2)
  .attr("y", legendY + legendHeight + 26)
  .attr("text-anchor", "middle")
  .attr("fill", t.inkSoft)
  .style("font-size", "14px")
  .text("Hourly website visits by day of week");
Runnable source as JSON, for any HTTP client: https://api.anyplot.ai/specs/heatmap-polar/d3/code. Any spec id and library id listed in llms-full.txt fit the same URL shape; every URL below is complete and callable.
{
  "spec_id": "heatmap-polar",
  "language": "javascript",
  "library": "d3",
  "page": "https://anyplot.ai/heatmap-polar/javascript/d3",
  "hub": "https://anyplot.ai/heatmap-polar",
  "code_json": "https://api.anyplot.ai/specs/heatmap-polar/d3/code",
  "spec_json": "https://api.anyplot.ai/specs/heatmap-polar",
  "render_light_png": "https://storage.googleapis.com/anyplot-images/plots/heatmap-polar/javascript/d3/plot-light.png",
  "render_dark_png": "https://storage.googleapis.com/anyplot-images/plots/heatmap-polar/javascript/d3/plot-dark.png",
  "interactive_light_html": "https://storage.googleapis.com/anyplot-images/plots/heatmap-polar/javascript/d3/plot-light.html",
  "interactive_dark_html": "https://storage.googleapis.com/anyplot-images/plots/heatmap-polar/javascript/d3/plot-dark.html",
  "quality_score": 92.0,
  "license": "MIT",
  "guide": "https://anyplot.ai/llms.txt"
}
Part of Polar Heatmap for Cyclic Two-Dimensional Data on anyplot.ai.