The same plot in 14 other libraries — Python: Altair, Bokeh, lets-plot, Matplotlib, Plotly, plotnine, Pygal, Seaborn; R: ggplot2; JavaScript: Chart.js, D3.js, Apache ECharts, Highcharts, MUI X Charts. Compare all 15 side by side: Polar Heatmap for Cyclic Two-Dimensional Data in Python, R, Julia and JavaScript.
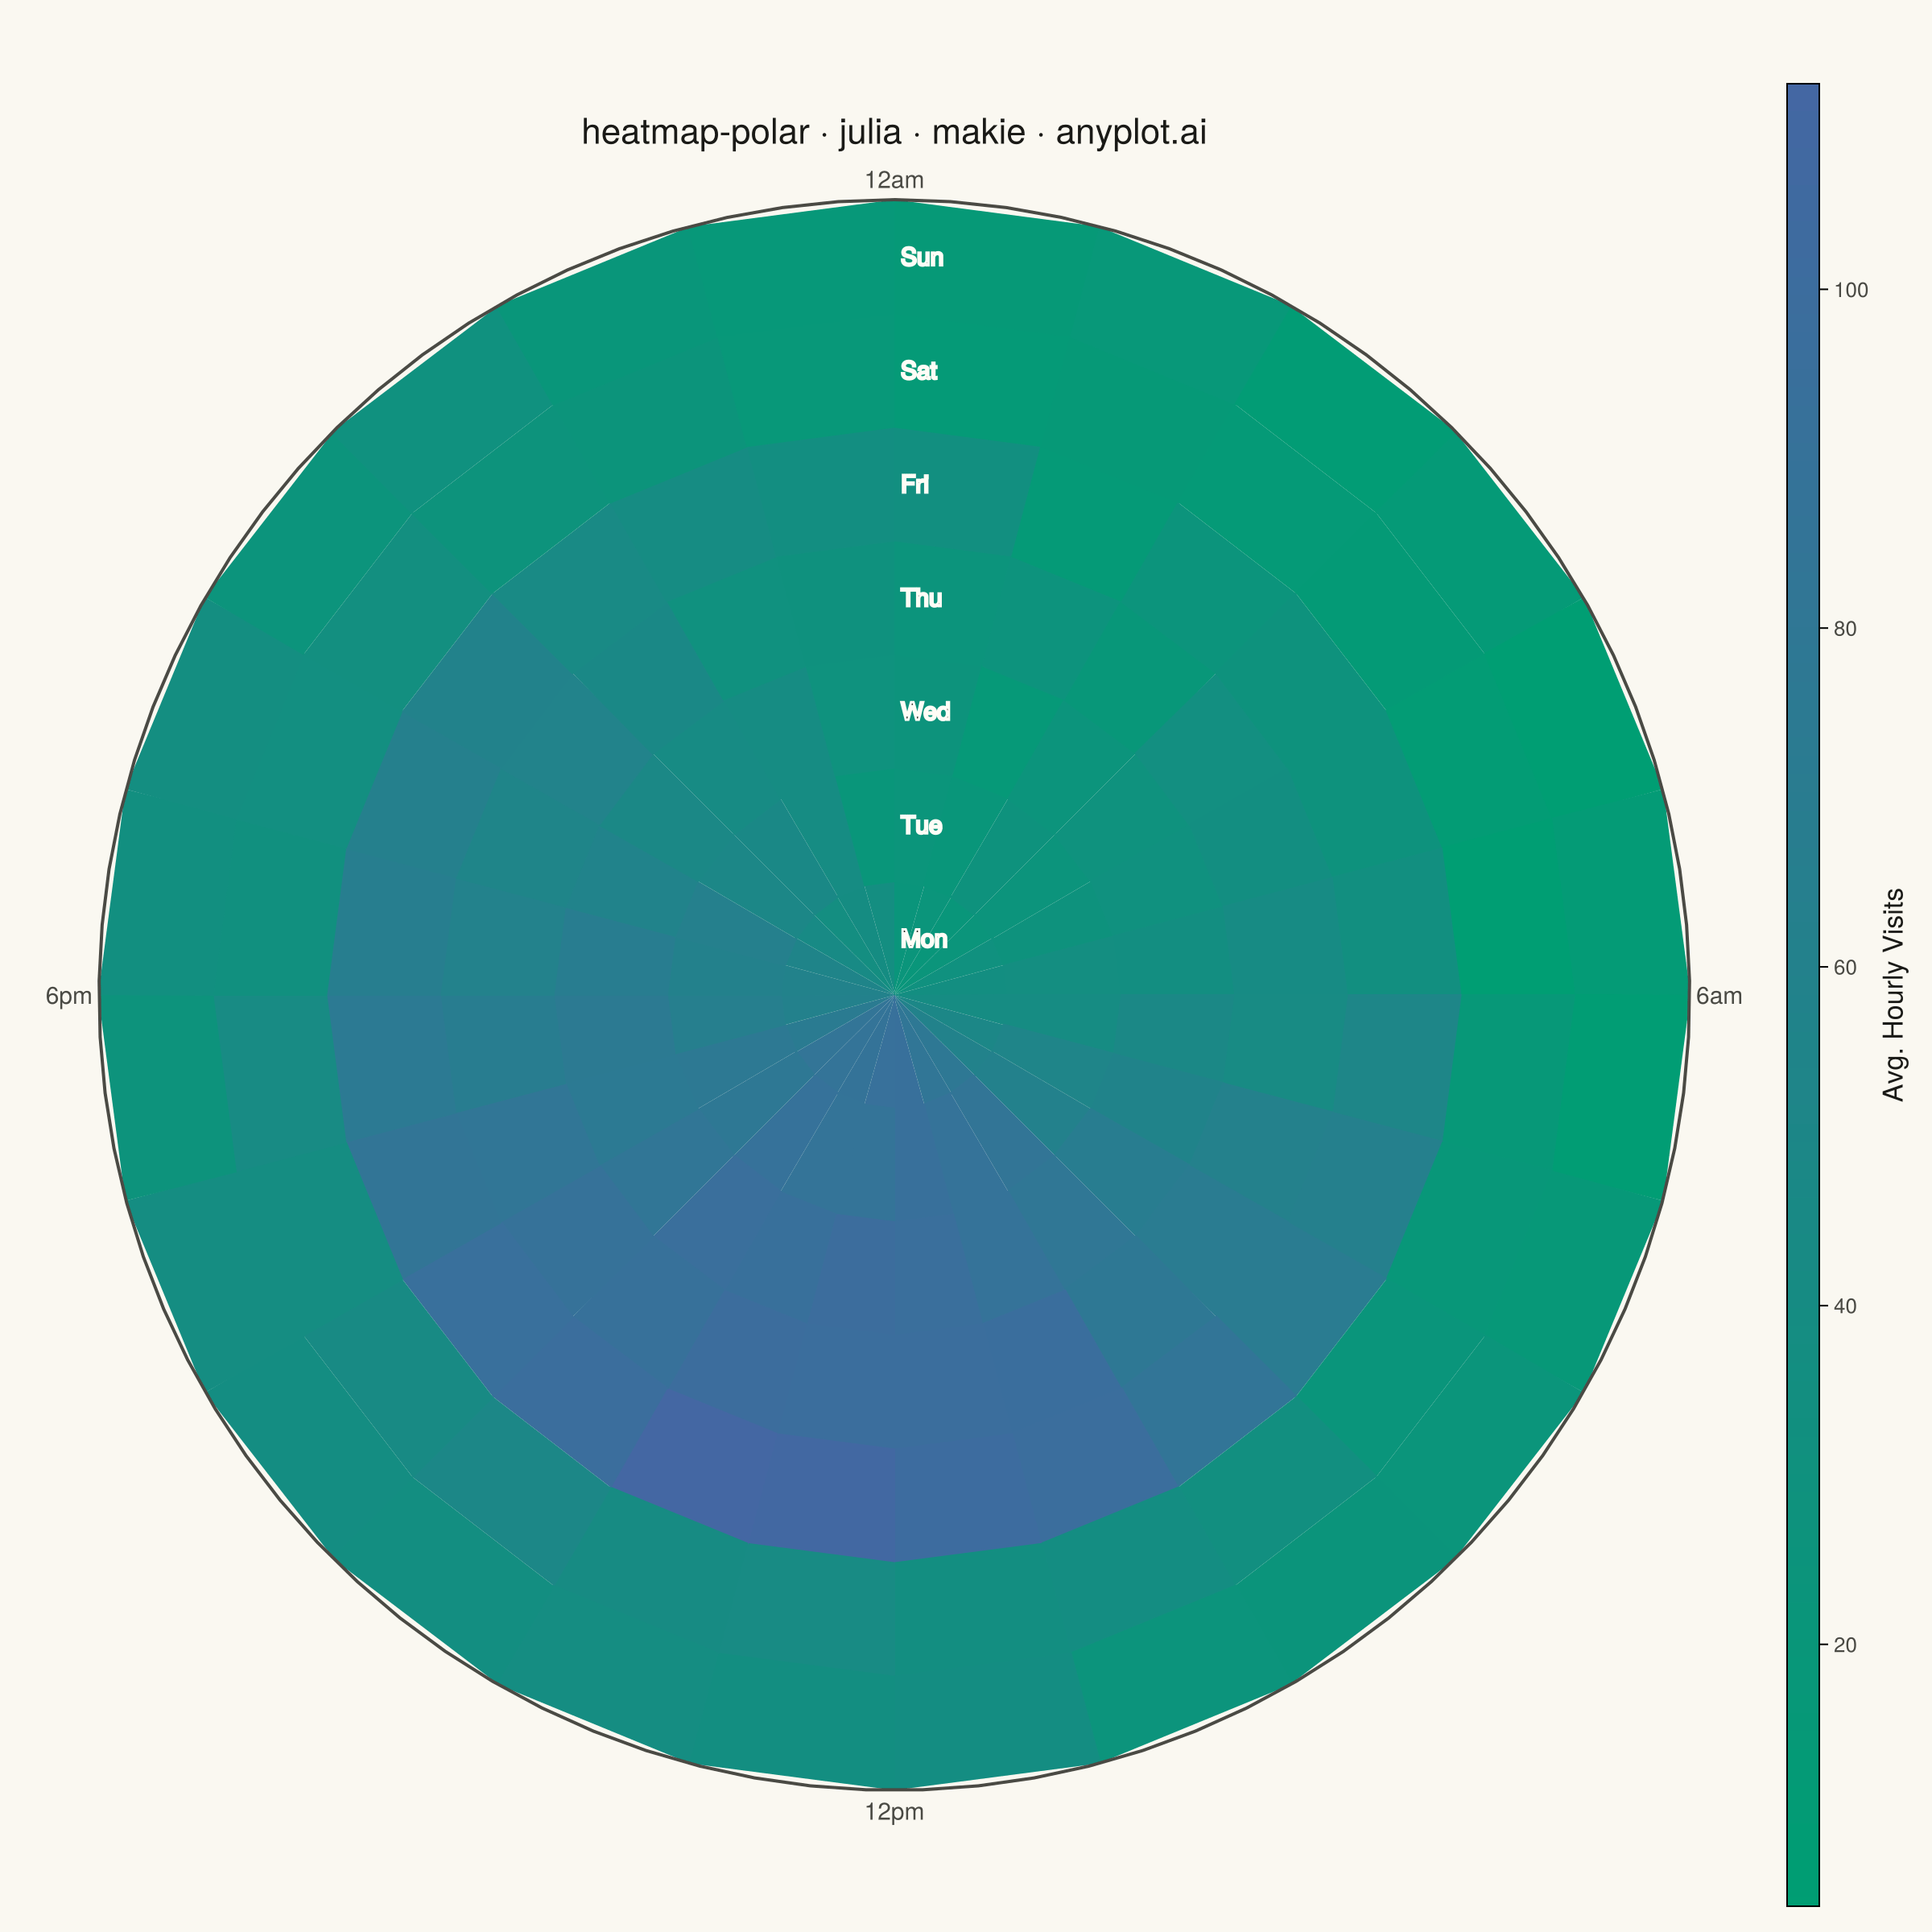
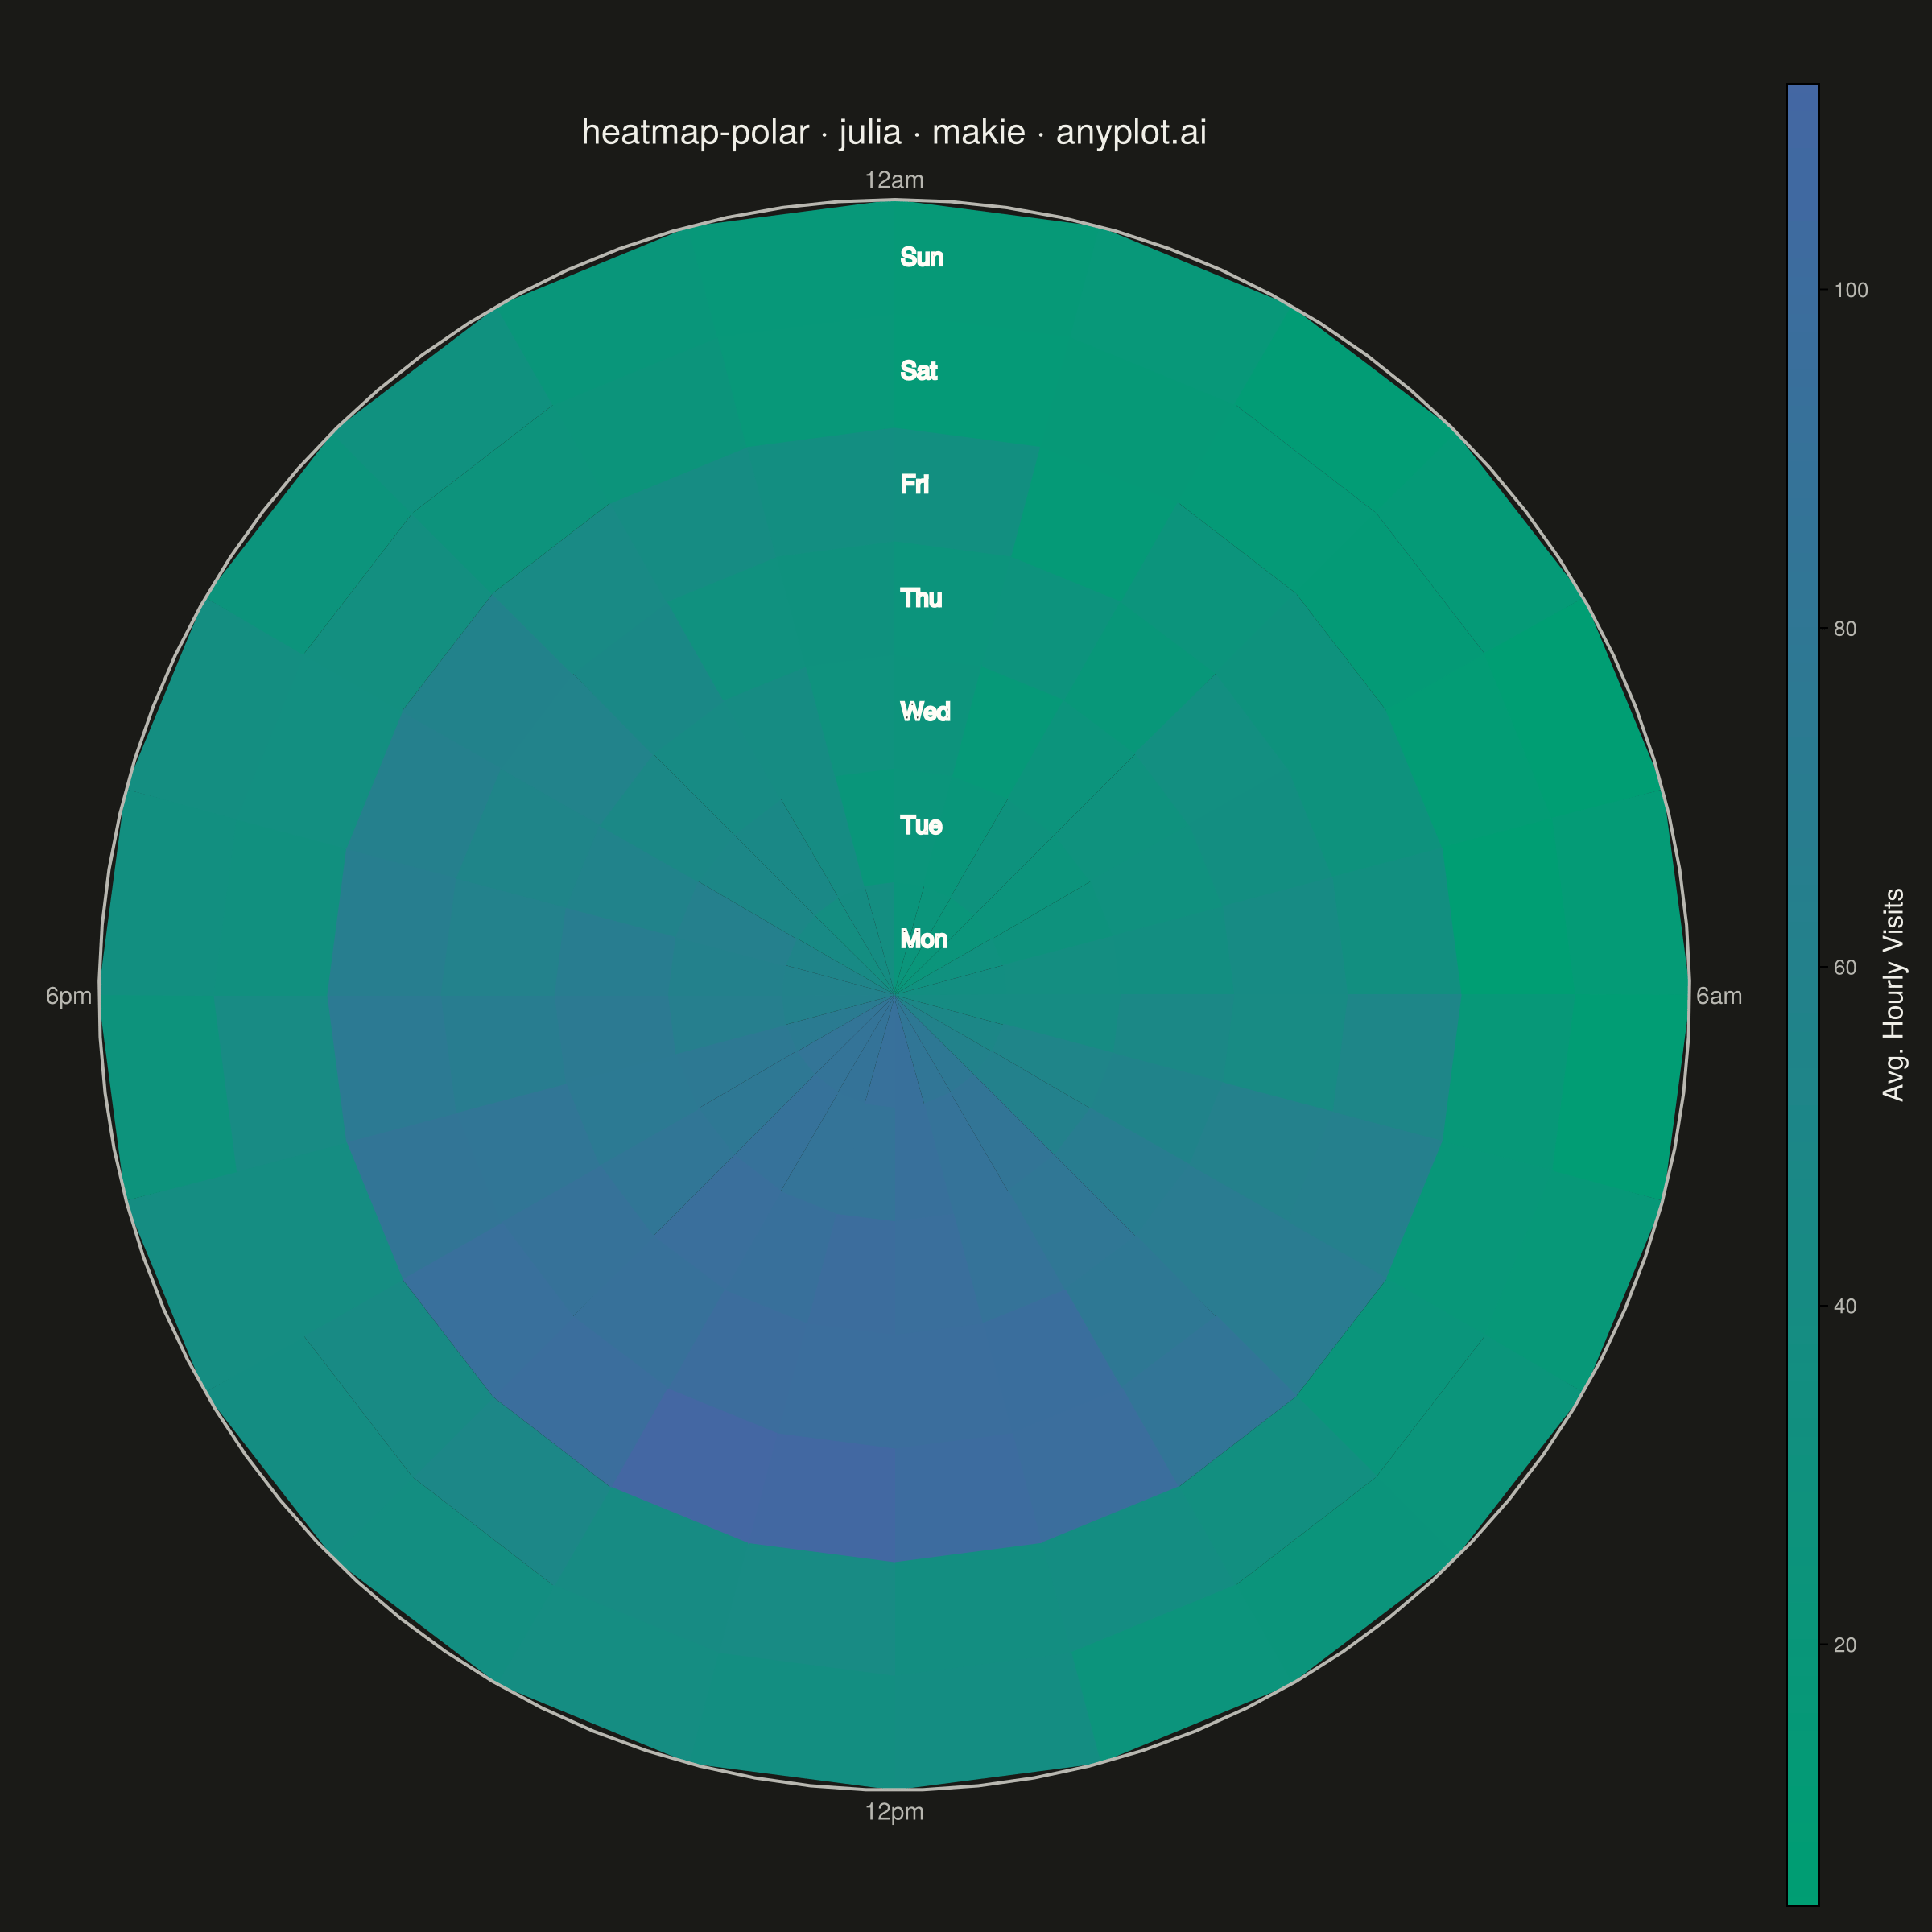
A heatmap wrapped around a circle where the angular axis represents a cyclic variable (e.g., hour of day, month) and the radial axis represents a second categorical or ordinal variable (e.g., day of week, year). Cell color encodes the measured value. This visualization reveals patterns in data with inherent cyclical structure that rectangular heatmaps distort, since the first and last angular bins are visually adjacent rather than separated at opposite ends of a row.
# anyplot.ai
# heatmap-polar: Polar Heatmap for Cyclic Two-Dimensional Data
# Library: makie 0.21.9 | Julia 1.11.9
# Quality: 88/100 | Created: 2026-09-05

using CairoMakie
using Colors
using Random

# Theme tokens (see prompts/default-style-guide.md "Background" + "Theme-adaptive Chrome")
THEME    = get(ENV, "ANYPLOT_THEME", "light")
PAGE_BG  = THEME == "light" ? colorant"#FAF8F1" : colorant"#1A1A17"
INK      = THEME == "light" ? colorant"#1A1A17" : colorant"#F0EFE8"
INK_SOFT = THEME == "light" ? colorant"#4A4A44" : colorant"#B8B7B0"

# The radial (day) tick labels sit on top of the heatmap cells rather than the page
# background, and the heatmap colors are identical across themes — so this pairing is
# fixed rather than theme-flipped, keeping the labels legible on both green and blue cells.
LABEL_ON_DATA        = colorant"#1A1A17"
LABEL_ON_DATA_HALO   = colorant"#FFFDF6"

# Data — hourly web-app traffic by hour of day (angular) and day of week (radial)
Random.seed!(42)

hours = 0:23
days = ["Mon", "Tue", "Wed", "Thu", "Fri", "Sat", "Sun"]

# Weekday: broad mid-morning/mid-afternoon work-hours bump + small evening check-in.
# Weekend: single, later and lower midday-to-evening bump. Circular hour distance keeps
# the pattern continuous across the 11pm/12am wrap.
weekday_pattern = [
    20 + 55 * exp(-(min(abs(h - 10), 24 - abs(h - 10)))^2 / 18) +
         45 * exp(-(min(abs(h - 15), 24 - abs(h - 15)))^2 / 18) +
         18 * exp(-(min(abs(h - 20), 24 - abs(h - 20)))^2 / 8)
    for h in hours
]
weekend_pattern = [
    15 + 60 * exp(-(min(abs(h - 13), 24 - abs(h - 13)))^2 / 32) +
         35 * exp(-(min(abs(h - 20), 24 - abs(h - 20)))^2 / 18)
    for h in hours
]
day_scale = [0.75, 0.90, 1.05, 1.20, 1.35, 0.55, 0.45]

visits = Array{Float64}(undef, length(hours), length(days))
for (d, scale) in enumerate(day_scale)
    pattern = d <= 5 ? weekday_pattern : weekend_pattern
    visits[:, d] = max.(0.0, scale .* pattern .+ 4 .* randn(length(hours)))
end

theta_edges = range(0, 2π, length = length(hours) + 1)
r_edges = 0:length(days)

# Plot — see default-style-guide.md "Visual Sizing Defaults" for the canvas + sizing values
fig = Figure(size = (1200, 1200), fontsize = 14, backgroundcolor = PAGE_BG)

ax = PolarAxis(
    fig[1, 1];
    title = "heatmap-polar · julia · makie · anyplot.ai",
    titlesize = 22,
    titlecolor = INK,
    backgroundcolor = PAGE_BG,
    direction = -1,
    theta_0 = -pi / 2,
    thetaticks = (range(0, 2π, length = 5)[1:4], ["12am", "6am", "12pm", "6pm"]),
    rticks = (0.5:1:(length(days) - 0.5), days),
    rtickangle = π / 8,
    thetaticklabelsize = 15,
    rticklabelsize = 15,
    thetaticklabelcolor = INK_SOFT,
    rticklabelcolor = LABEL_ON_DATA,
    rticklabelstrokewidth = 1.5,
    rticklabelstrokecolor = LABEL_ON_DATA_HALO,
    rgridcolor = (INK, 0.15),
    thetagridcolor = (INK, 0.15),
    spinecolor = INK_SOFT,
)

# Sequential Imprint colormap (brand green -> blue) — visit counts are single-polarity
hm = heatmap!(
    ax, theta_edges, r_edges, visits,
    colormap = [colorant"#009E73", colorant"#4467A3"],
)

# heatmap! has no strokewidth/strokecolor for this (irregular-grid) method, so cell
# borders are drawn as thin overlay lines on top of the data instead: one spoke per
# hour edge, one ring per day edge.
spoke_pts = Point2f[]
for theta in theta_edges[1:end-1]
    push!(spoke_pts, Point2f(theta, 0), Point2f(theta, length(days)), Point2f(NaN, NaN))
end
lines!(ax, spoke_pts, color = (PAGE_BG, 0.4), linewidth = 1)

ring_pts = Point2f[]
arc_theta = range(0, 2π, length = 145)
for r in r_edges
    for theta in arc_theta
        push!(ring_pts, Point2f(theta, r))
    end
    push!(ring_pts, Point2f(NaN, NaN))
end
lines!(ax, ring_pts, color = (PAGE_BG, 0.4), linewidth = 1)

Colorbar(
    fig[1, 2], hm;
    label = "Avg. Hourly Visits",
    labelsize = 17,
    ticklabelsize = 13,
    labelcolor = INK,
    ticklabelcolor = INK_SOFT,
    width = 20,
)
colgap!(fig.layout, 15)

# Save
save("plot-$(THEME).png", fig; px_per_unit = 2)
Runnable source as JSON, for any HTTP client: https://api.anyplot.ai/specs/heatmap-polar/makie/code. Any spec id and library id listed in llms-full.txt fit the same URL shape; every URL below is complete and callable.
{
  "spec_id": "heatmap-polar",
  "language": "julia",
  "library": "makie",
  "page": "https://anyplot.ai/heatmap-polar/julia/makie",
  "hub": "https://anyplot.ai/heatmap-polar",
  "code_json": "https://api.anyplot.ai/specs/heatmap-polar/makie/code",
  "spec_json": "https://api.anyplot.ai/specs/heatmap-polar",
  "render_light_png": "https://storage.googleapis.com/anyplot-images/plots/heatmap-polar/julia/makie/plot-light.png",
  "render_dark_png": "https://storage.googleapis.com/anyplot-images/plots/heatmap-polar/julia/makie/plot-dark.png",
  "quality_score": 88.0,
  "license": "MIT",
  "guide": "https://anyplot.ai/llms.txt"
}
Part of Polar Heatmap for Cyclic Two-Dimensional Data on anyplot.ai.