The same plot in 14 other libraries — JavaScript: Chart.js, D3.js, Apache ECharts, MUI X Charts; Python: Altair, Bokeh, lets-plot, Matplotlib, Plotly, plotnine, Pygal, Seaborn; R: ggplot2; Julia: Makie.jl. Compare all 15 side by side: Polar Heatmap for Cyclic Two-Dimensional Data in Python, R, Julia and JavaScript.
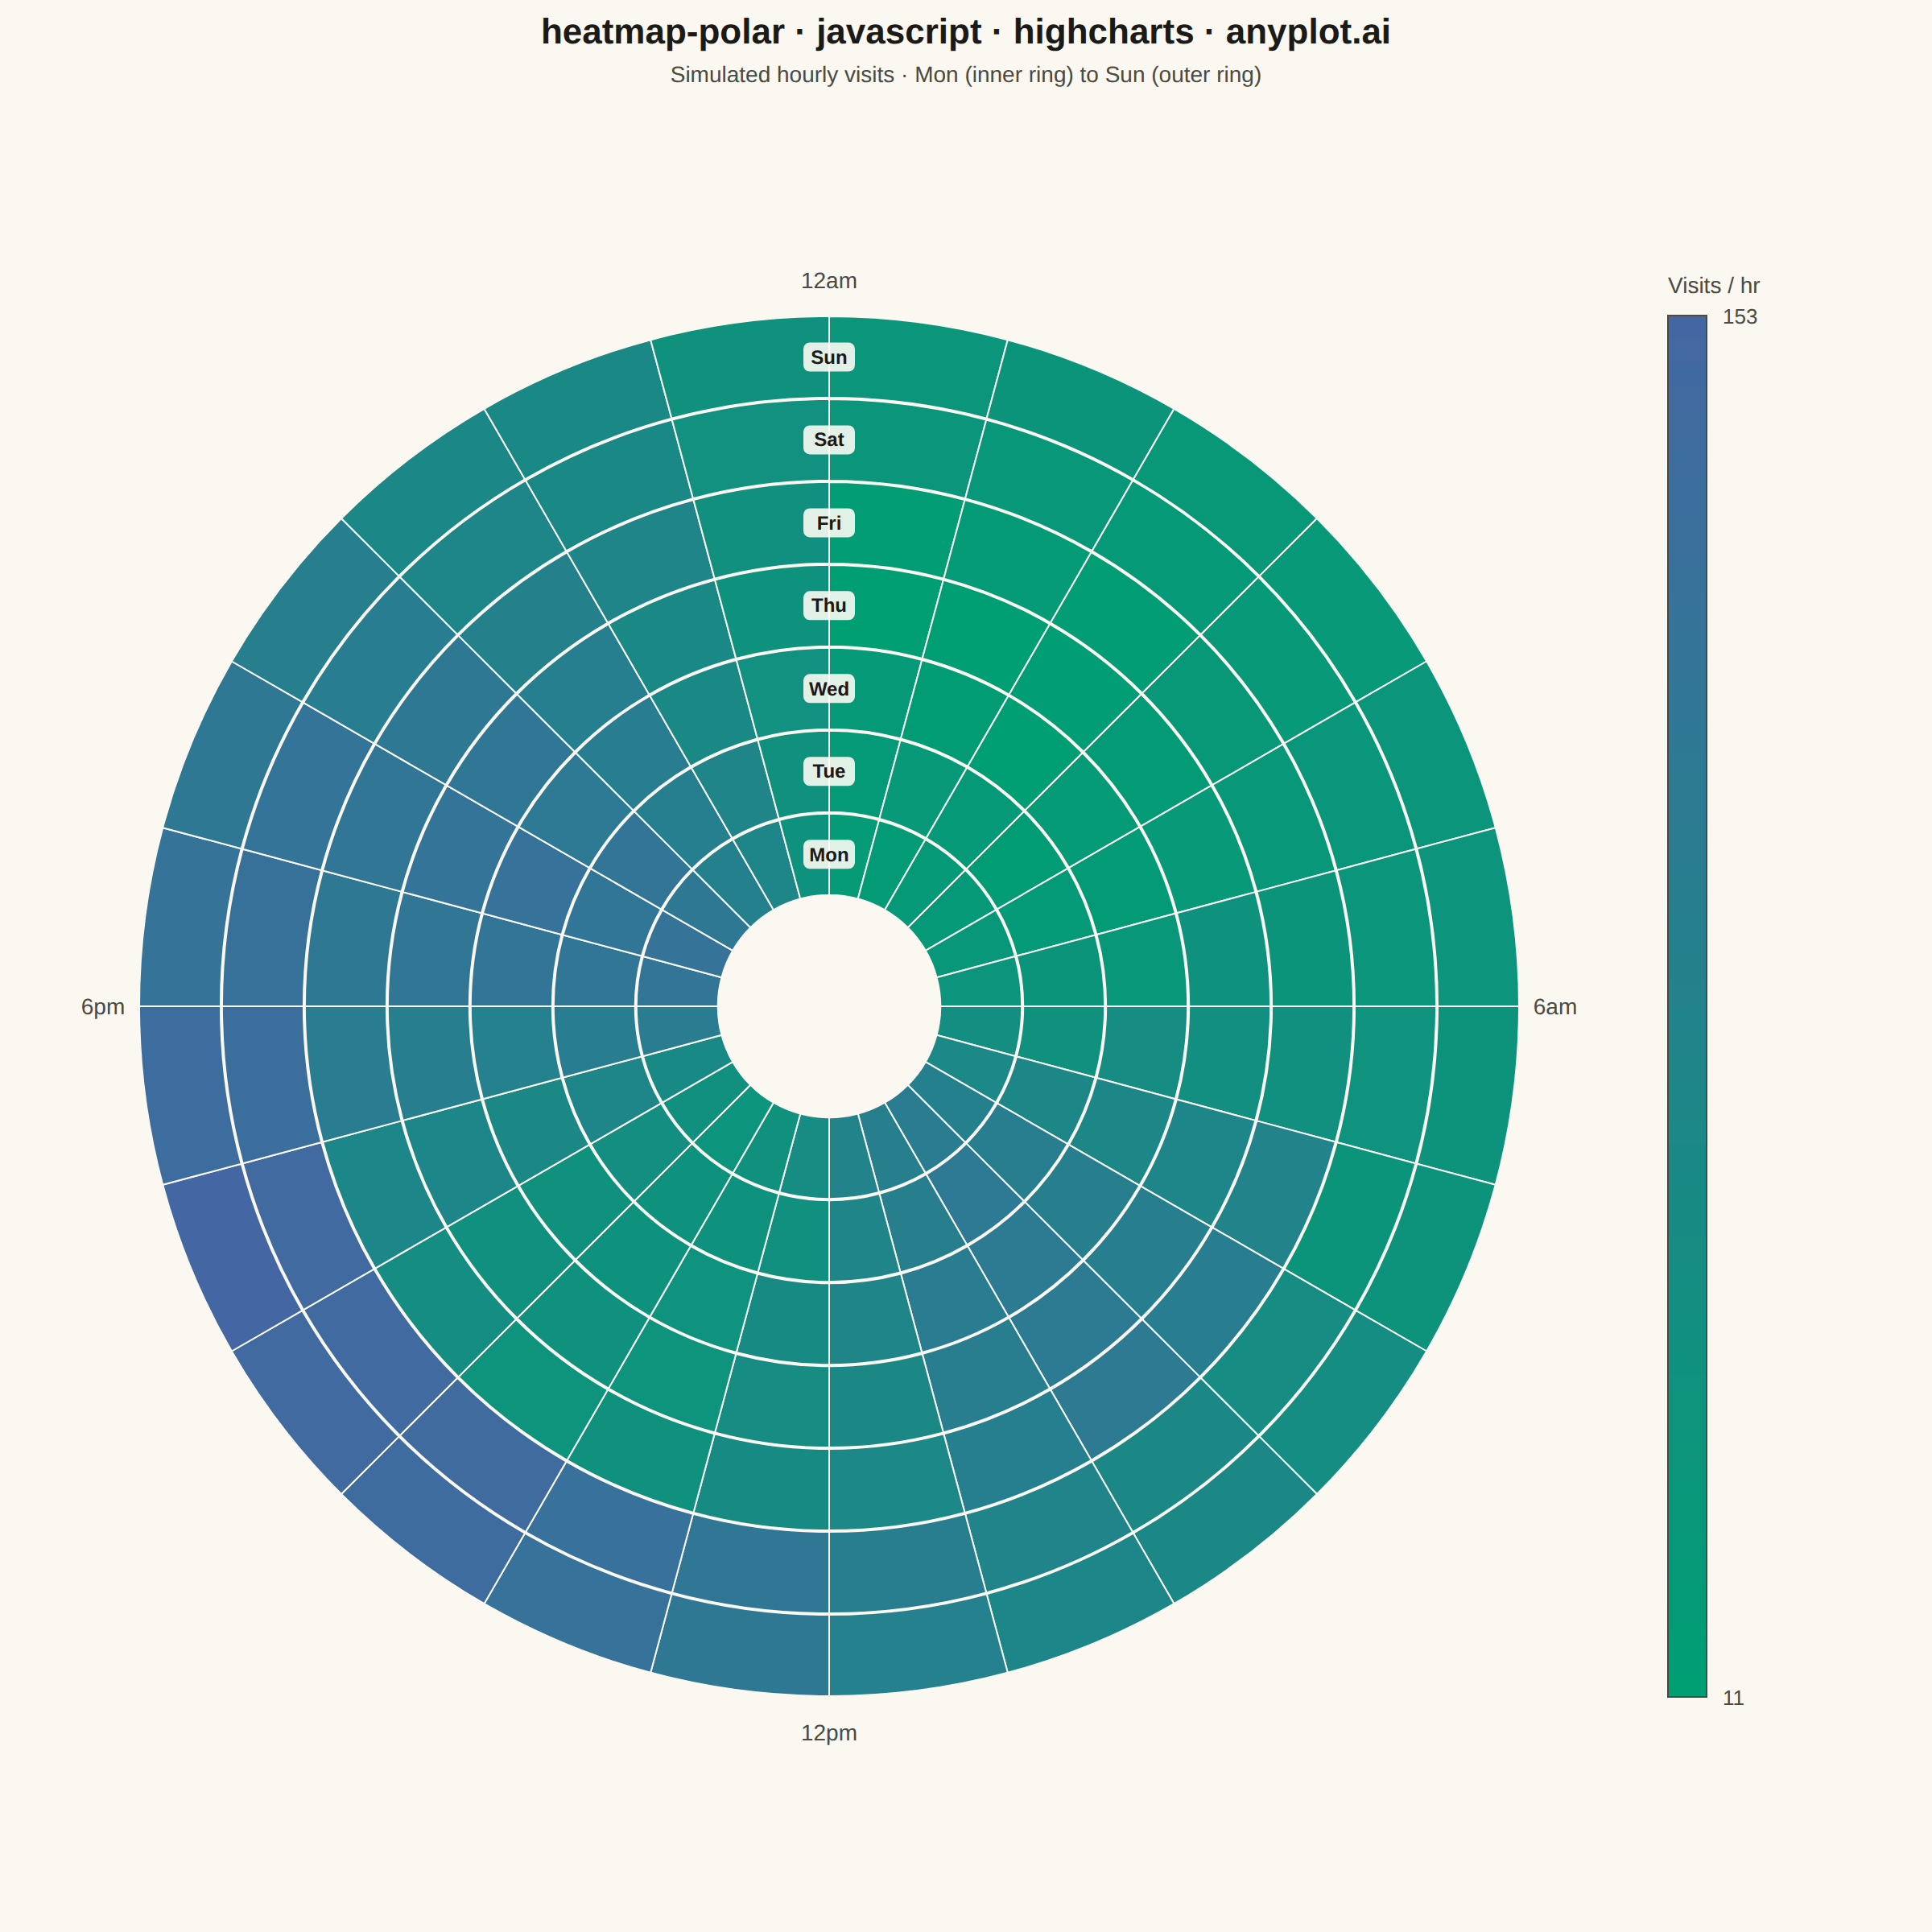
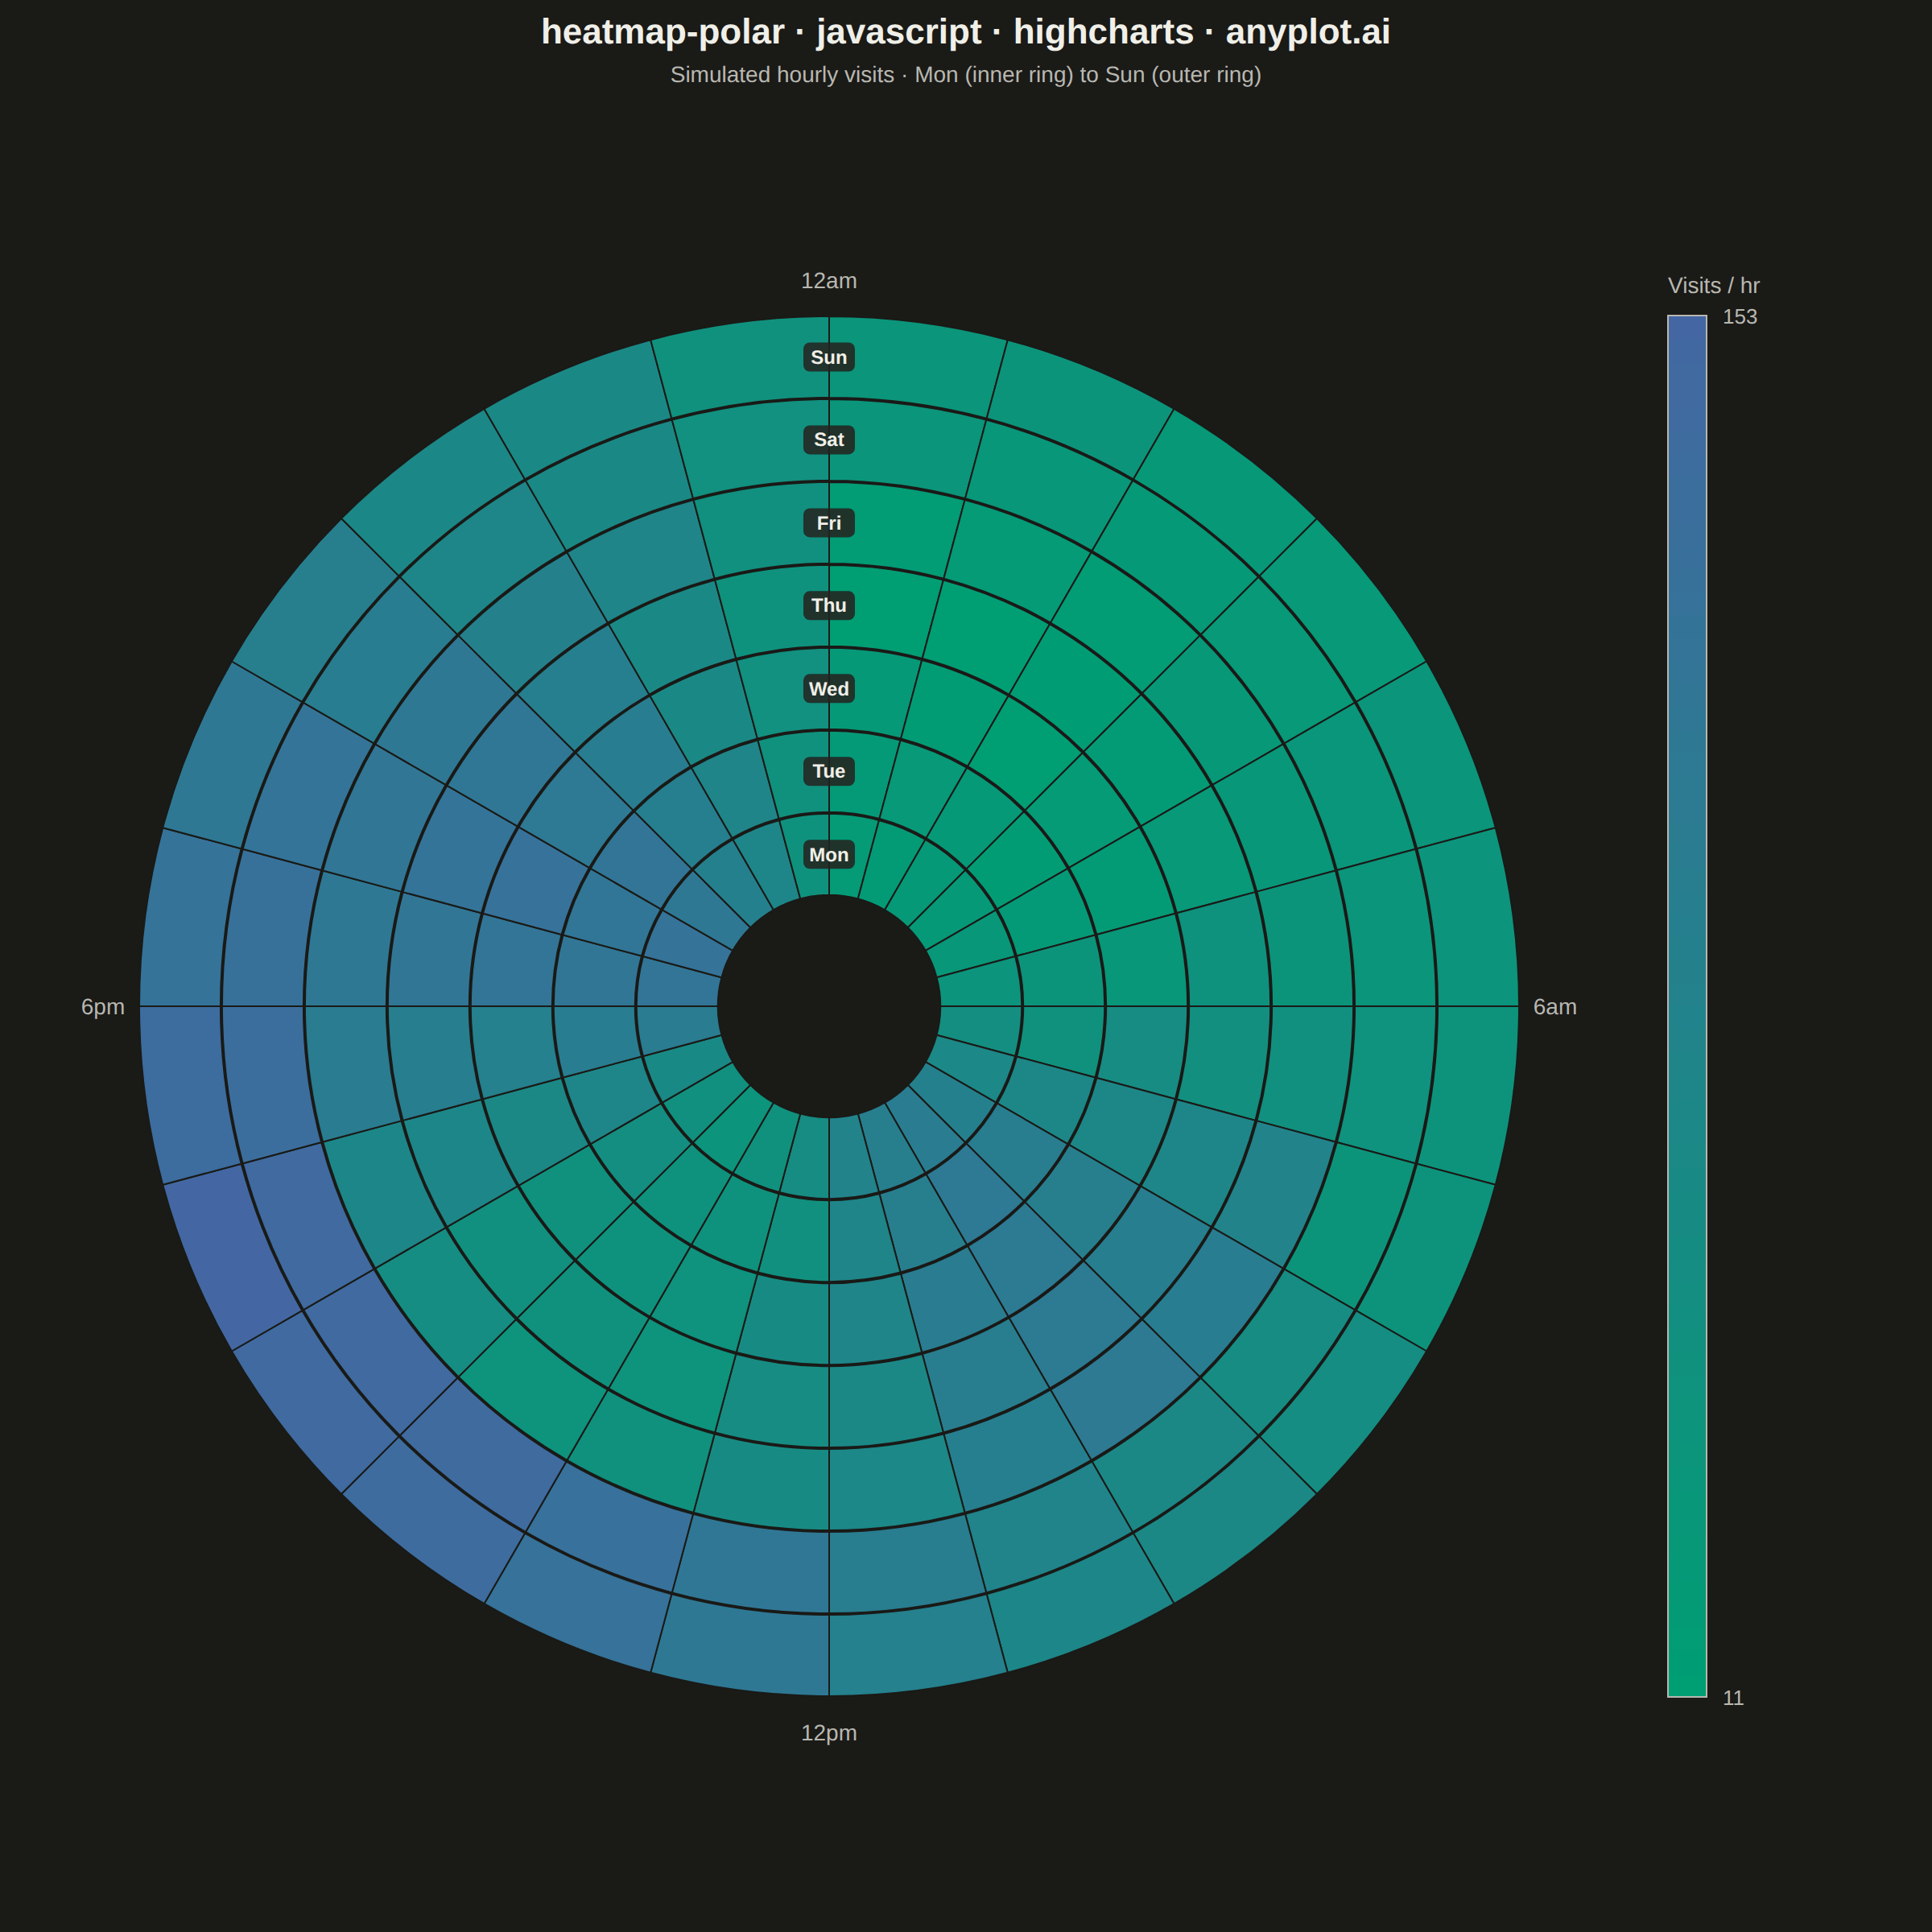
A heatmap wrapped around a circle where the angular axis represents a cyclic variable (e.g., hour of day, month) and the radial axis represents a second categorical or ordinal variable (e.g., day of week, year). Cell color encodes the measured value. This visualization reveals patterns in data with inherent cyclical structure that rectangular heatmaps distort, since the first and last angular bins are visually adjacent rather than separated at opposite ends of a row.
// anyplot.ai
// heatmap-polar: Polar Heatmap for Cyclic Two-Dimensional Data
// Library: highcharts 12.6.0 | JavaScript 22.23.2
// Quality: 90/100 | Created: 2026-09-05
//# anyplot-orientation: square

const t = window.ANYPLOT_TOKENS;

// --- Data: simulated hourly website visits, angular = hour of day, radial = --
// day of week. Deterministic LCG so light/dark renders match exactly.
let seed = 42;
function rand() {
  seed = (seed * 1103515245 + 12345) & 0x7fffffff;
  return seed / 0x7fffffff;
}

const DAYS = ['Mon', 'Tue', 'Wed', 'Thu', 'Fri', 'Sat', 'Sun'];
const N_RADIAL = DAYS.length;
const N_ANGULAR = 24;

// Weekdays show the commute bimodal (~9am, ~7pm); weekends shift to a single
// broad, later, generally busier afternoon/evening peak.
function baseline(day, hour) {
  const isWeekend = day >= 5;
  if (!isWeekend) {
    const morning = 85 * Math.exp(-((hour - 9) ** 2) / (2 * 2.2 ** 2));
    const evening = 100 * Math.exp(-((hour - 19) ** 2) / (2 * 2.6 ** 2));
    return 18 + morning + evening;
  }
  const afternoon = 120 * Math.exp(-((hour - 15.5) ** 2) / (2 * 4 ** 2));
  return 30 + afternoon;
}

const matrix = [];
for (let day = 0; day < N_RADIAL; day++) {
  const row = [];
  for (let hour = 0; hour < N_ANGULAR; hour++) {
    const noise = (rand() - 0.5) * 14;
    row.push(Math.max(4, Math.round(baseline(day, hour) + noise)));
  }
  matrix.push(row);
}

let VAL_MIN = Infinity;
let VAL_MAX = -Infinity;
matrix.forEach((row) =>
  row.forEach((v) => {
    if (v < VAL_MIN) VAL_MIN = v;
    if (v > VAL_MAX) VAL_MAX = v;
  })
);

// --- Color: imprint_seq — visit counts are single-polarity ------------------
function hexToRgb(hex) {
  return [parseInt(hex.slice(1, 3), 16), parseInt(hex.slice(3, 5), 16), parseInt(hex.slice(5, 7), 16)];
}
function lerp(a, b, f) {
  return a + (b - a) * f;
}
function rgbToCss([r, g, b]) {
  return `rgb(${Math.round(r)},${Math.round(g)},${Math.round(b)})`;
}
const SEQ_LO = hexToRgb(t.seq[0]);
const SEQ_HI = hexToRgb(t.seq[1]);
function valueFill(v) {
  const frac = (v - VAL_MIN) / (VAL_MAX - VAL_MIN);
  return rgbToCss([lerp(SEQ_LO[0], SEQ_HI[0], frac), lerp(SEQ_LO[1], SEQ_HI[1], frac), lerp(SEQ_LO[2], SEQ_HI[2], frac)]);
}

// --- Title (scaled off the 67-char baseline; this title sits well under it) -
const TITLE_TEXT = 'heatmap-polar · javascript · highcharts · anyplot.ai';
const TITLE_FS = Math.max(Math.round(22 * Math.min(1, 67 / TITLE_TEXT.length)), 14);

// --- Fixed chart geometry (square canvas, harness-guaranteed 1200x1200) -----
// Right margin holds the colorbar; the wheel itself sits inside plotLeft/Top
// + plotWidth/Height, which we compute directly rather than trusting an
// auto-margin (title/subtitle height is already folded into the top value).
const SIZE = window.ANYPLOT_SIZE;
const CHART_MARGIN = [120, 210, 70, 40]; // [top, right, bottom, left]
const plotLeft = CHART_MARGIN[3];
const plotTop = CHART_MARGIN[0];
const plotWidth = SIZE.width - CHART_MARGIN[1] - CHART_MARGIN[3];
const plotHeight = SIZE.height - CHART_MARGIN[0] - CHART_MARGIN[2];
const cx = plotLeft + plotWidth / 2;
const cy = plotTop + plotHeight / 2;
const OUTER_R = Math.min(plotWidth, plotHeight) / 2 - 46; // clearance for hour labels
const INNER_R = OUTER_R * 0.16; // small hub hole avoids degenerate center wedges
const RING_THICKNESS = (OUTER_R - INNER_R) / N_RADIAL;
const ANGLE_STEP = (2 * Math.PI) / N_ANGULAR;
const ANGLE0 = -Math.PI / 2; // hour 0 (12am) at the top; angle grows clockwise
function hourAngle(hour) {
  return ANGLE0 + hour * ANGLE_STEP;
}
const CELL_MARKER_R = Math.max(Math.min(RING_THICKNESS, OUTER_R * ANGLE_STEP) / 2 - 1, 3);

// --- Draw: wedge cells + hour/day axis labels + colorbar, all via the core --
// renderer — the loaded bundle has neither the polar-chart module
// (highcharts-more) nor the heatmap module, so the wheel itself is hand-drawn
// while a matched invisible scatter layer (below) recovers native tooltips.
const drawn = [];
function clearDrawn() {
  drawn.forEach((el) => {
    try {
      el.destroy();
    } catch (_err) {
      // already removed
    }
  });
  drawn.length = 0;
}

function drawAll() {
  const chart = this;
  clearDrawn();
  const r = chart.renderer;

  // Heatmap wedges: rings outward = day of week, sectors clockwise = hour.
  for (let day = 0; day < N_RADIAL; day++) {
    const r0 = INNER_R + day * RING_THICKNESS;
    const r1 = r0 + RING_THICKNESS;
    for (let hour = 0; hour < N_ANGULAR; hour++) {
      drawn.push(
        r
          .arc(cx, cy, r1 - 0.5, r0 + 0.5, hourAngle(hour), hourAngle(hour + 1))
          .attr({ fill: valueFill(matrix[day][hour]), stroke: t.pageBg, 'stroke-width': 1 })
          .add()
      );
    }
  }

  // Angular axis: hour-of-day labels at readable intervals, outside the wheel.
  [
    [0, '12am'],
    [6, '6am'],
    [12, '12pm'],
    [18, '6pm'],
  ].forEach(([hour, label]) => {
    const a = hourAngle(hour);
    drawn.push(
      r
        .text(label, cx + (OUTER_R + 22) * Math.cos(a), cy + (OUTER_R + 22) * Math.sin(a) + 5)
        .attr({ align: 'center' })
        .css({ color: t.inkSoft, fontSize: '14px' })
        .add()
    );
  });

  // Radial axis: day-of-week ring labels along the 12am spoke, each on a
  // soft halo so they stay legible over the wedge color beneath them.
  DAYS.forEach((day, i) => {
    const ly = cy - (INNER_R + (i + 0.5) * RING_THICKNESS);
    drawn.push(r.rect(cx - 16, ly - 9, 32, 18, 4).attr({ fill: t.elevatedBg, opacity: 0.88 }).add());
    drawn.push(
      r
        .text(day, cx, ly + 4)
        .attr({ align: 'center' })
        .css({ color: t.ink, fontSize: '12px', fontWeight: '600' })
        .add()
    );
  });

  // Sequential colorbar.
  const barLeft = plotLeft + plotWidth + 46;
  const barTop = cy - OUTER_R;
  const barWidth = 24;
  const barHeight = OUTER_R * 2;
  const segments = 60;
  const segH = barHeight / segments;
  for (let i = 0; i < segments; i++) {
    const value = VAL_MIN + ((segments - 1 - i) / (segments - 1)) * (VAL_MAX - VAL_MIN);
    drawn.push(r.rect(barLeft, barTop + i * segH, barWidth, segH + 0.5).attr({ fill: valueFill(value) }).add());
  }
  drawn.push(r.rect(barLeft, barTop, barWidth, barHeight).attr({ fill: 'none', stroke: t.inkSoft, 'stroke-width': 1 }).add());
  [
    [VAL_MAX, 0],
    [VAL_MIN, 1],
  ].forEach(([value, frac]) => {
    drawn.push(
      r
        .text(Math.round(value).toString(), barLeft + barWidth + 10, barTop + frac * barHeight + 5)
        .attr({ align: 'left' })
        .css({ color: t.inkSoft, fontSize: '13px' })
        .add()
    );
  });
  drawn.push(
    r
      .text('Visits / hr', barLeft, barTop - 14)
      .attr({ align: 'left' })
      .css({ color: t.inkSoft, fontSize: '14px', fontWeight: '500' })
      .add()
  );
}

// Invisible scatter layer aligned to each wedge centroid so hovering exposes
// a native Highcharts tooltip over the hand-drawn wheel.
const cellPoints = [];
for (let day = 0; day < N_RADIAL; day++) {
  const rMid = INNER_R + (day + 0.5) * RING_THICKNESS;
  for (let hour = 0; hour < N_ANGULAR; hour++) {
    const aMid = hourAngle(hour + 0.5);
    cellPoints.push({
      x: rMid * Math.cos(aMid),
      y: rMid * Math.sin(aMid),
      value: matrix[day][hour],
      day: DAYS[day],
      hour,
    });
  }
}

Highcharts.chart('container', {
  chart: {
    backgroundColor: 'transparent',
    animation: false,
    style: { fontFamily: 'inherit' },
    margin: CHART_MARGIN,
    events: { load: drawAll, redraw: drawAll },
  },
  credits: { enabled: false },
  title: { text: TITLE_TEXT, style: { color: t.ink, fontSize: TITLE_FS + 'px', fontWeight: '600' } },
  subtitle: {
    text: 'Simulated hourly visits · Mon (inner ring) to Sun (outer ring)',
    style: { color: t.inkSoft, fontSize: '14px' },
  },
  xAxis: { visible: false, min: -plotWidth / 2, max: plotWidth / 2 },
  yAxis: { visible: false, min: -plotHeight / 2, max: plotHeight / 2, reversed: true },
  legend: { enabled: false },
  tooltip: {
    enabled: true,
    backgroundColor: t.elevatedBg,
    borderColor: t.inkSoft,
    borderRadius: 6,
    style: { color: t.ink, fontSize: '13px' },
    formatter: function () {
      const p = this.point;
      const hourLabel = `${p.hour % 12 === 0 ? 12 : p.hour % 12}${p.hour < 12 ? 'am' : 'pm'}`;
      return `<b>${p.day}</b>, ${hourLabel}<br/>${p.value} visits`;
    },
  },
  plotOptions: {
    series: { animation: false },
    scatter: {
      enableMouseTracking: true,
      stickyTracking: false,
      marker: {
        enabled: true,
        symbol: 'circle',
        radius: CELL_MARKER_R,
        fillColor: 'rgba(0,0,0,0.001)',
        lineWidth: 0,
        states: { hover: { enabled: false } },
      },
    },
  },
  series: [{ type: 'scatter', name: 'Visits', data: cellPoints }],
});
Runnable source as JSON, for any HTTP client: https://api.anyplot.ai/specs/heatmap-polar/highcharts/code. Any spec id and library id listed in llms-full.txt fit the same URL shape; every URL below is complete and callable.
{
  "spec_id": "heatmap-polar",
  "language": "javascript",
  "library": "highcharts",
  "page": "https://anyplot.ai/heatmap-polar/javascript/highcharts",
  "hub": "https://anyplot.ai/heatmap-polar",
  "code_json": "https://api.anyplot.ai/specs/heatmap-polar/highcharts/code",
  "spec_json": "https://api.anyplot.ai/specs/heatmap-polar",
  "render_light_png": "https://storage.googleapis.com/anyplot-images/plots/heatmap-polar/javascript/highcharts/plot-light.png",
  "render_dark_png": "https://storage.googleapis.com/anyplot-images/plots/heatmap-polar/javascript/highcharts/plot-dark.png",
  "interactive_light_html": "https://storage.googleapis.com/anyplot-images/plots/heatmap-polar/javascript/highcharts/plot-light.html",
  "interactive_dark_html": "https://storage.googleapis.com/anyplot-images/plots/heatmap-polar/javascript/highcharts/plot-dark.html",
  "quality_score": 90.0,
  "license": "MIT",
  "guide": "https://anyplot.ai/llms.txt"
}
Part of Polar Heatmap for Cyclic Two-Dimensional Data on anyplot.ai.