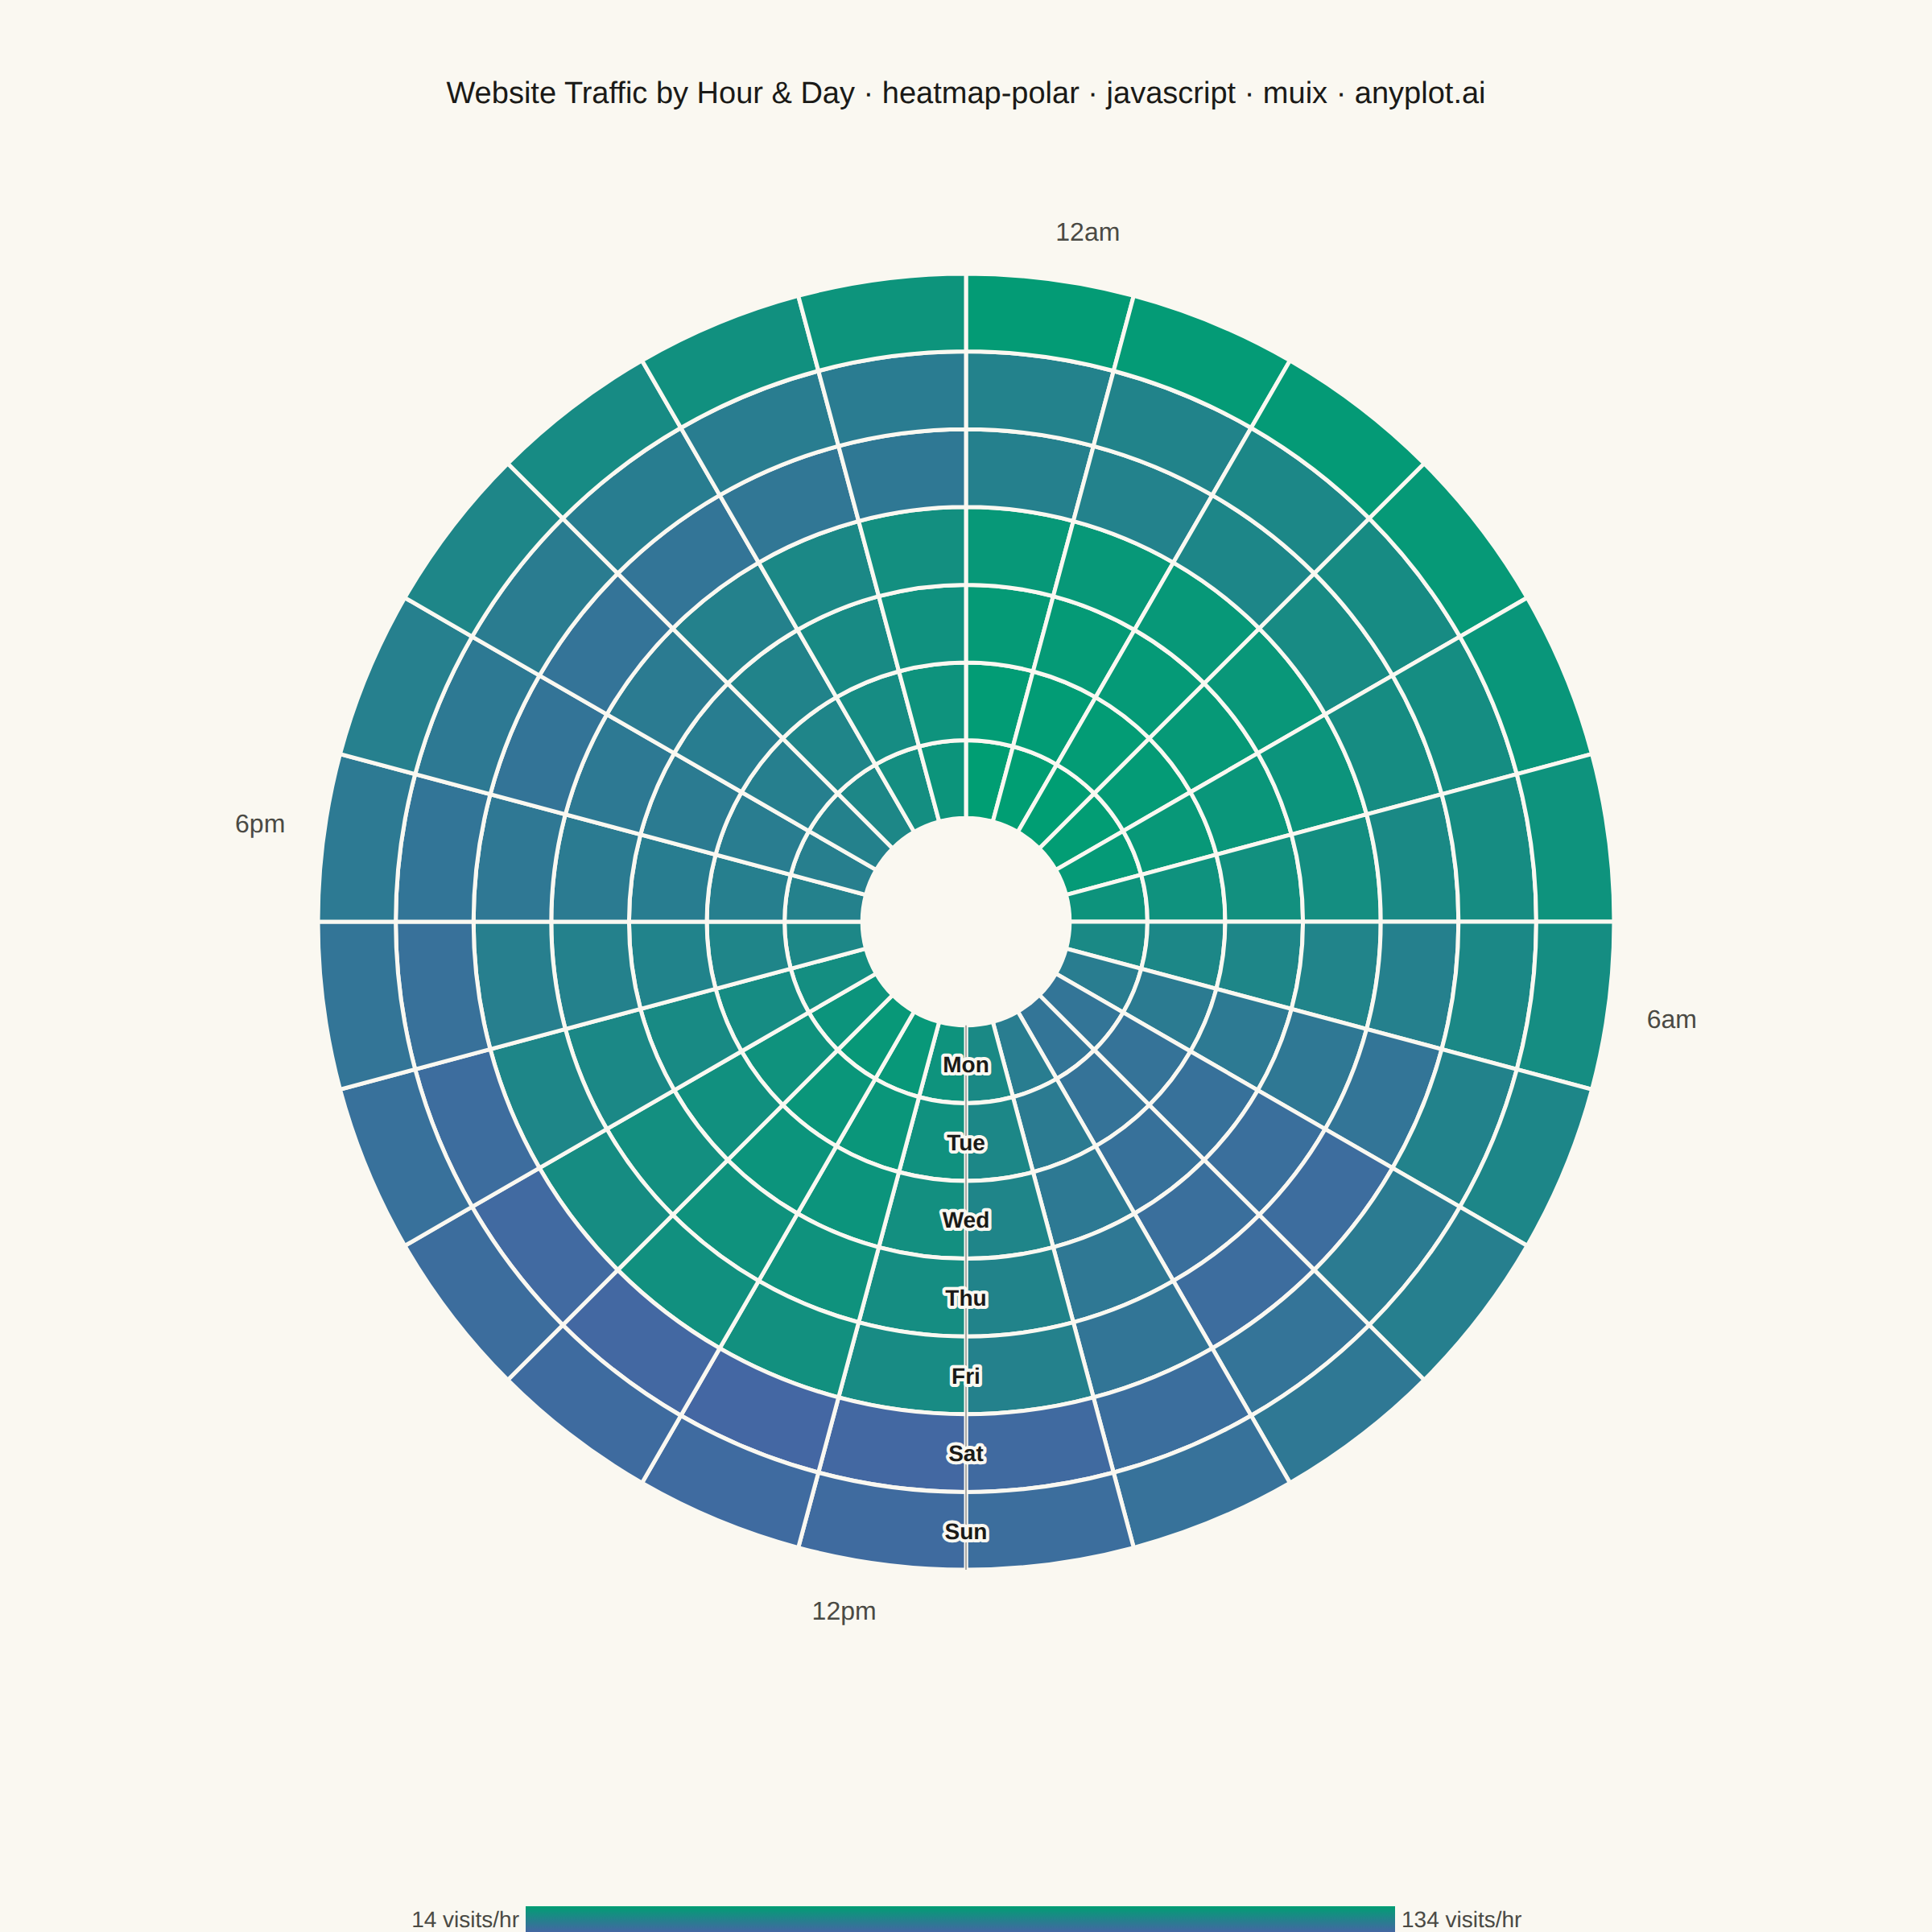
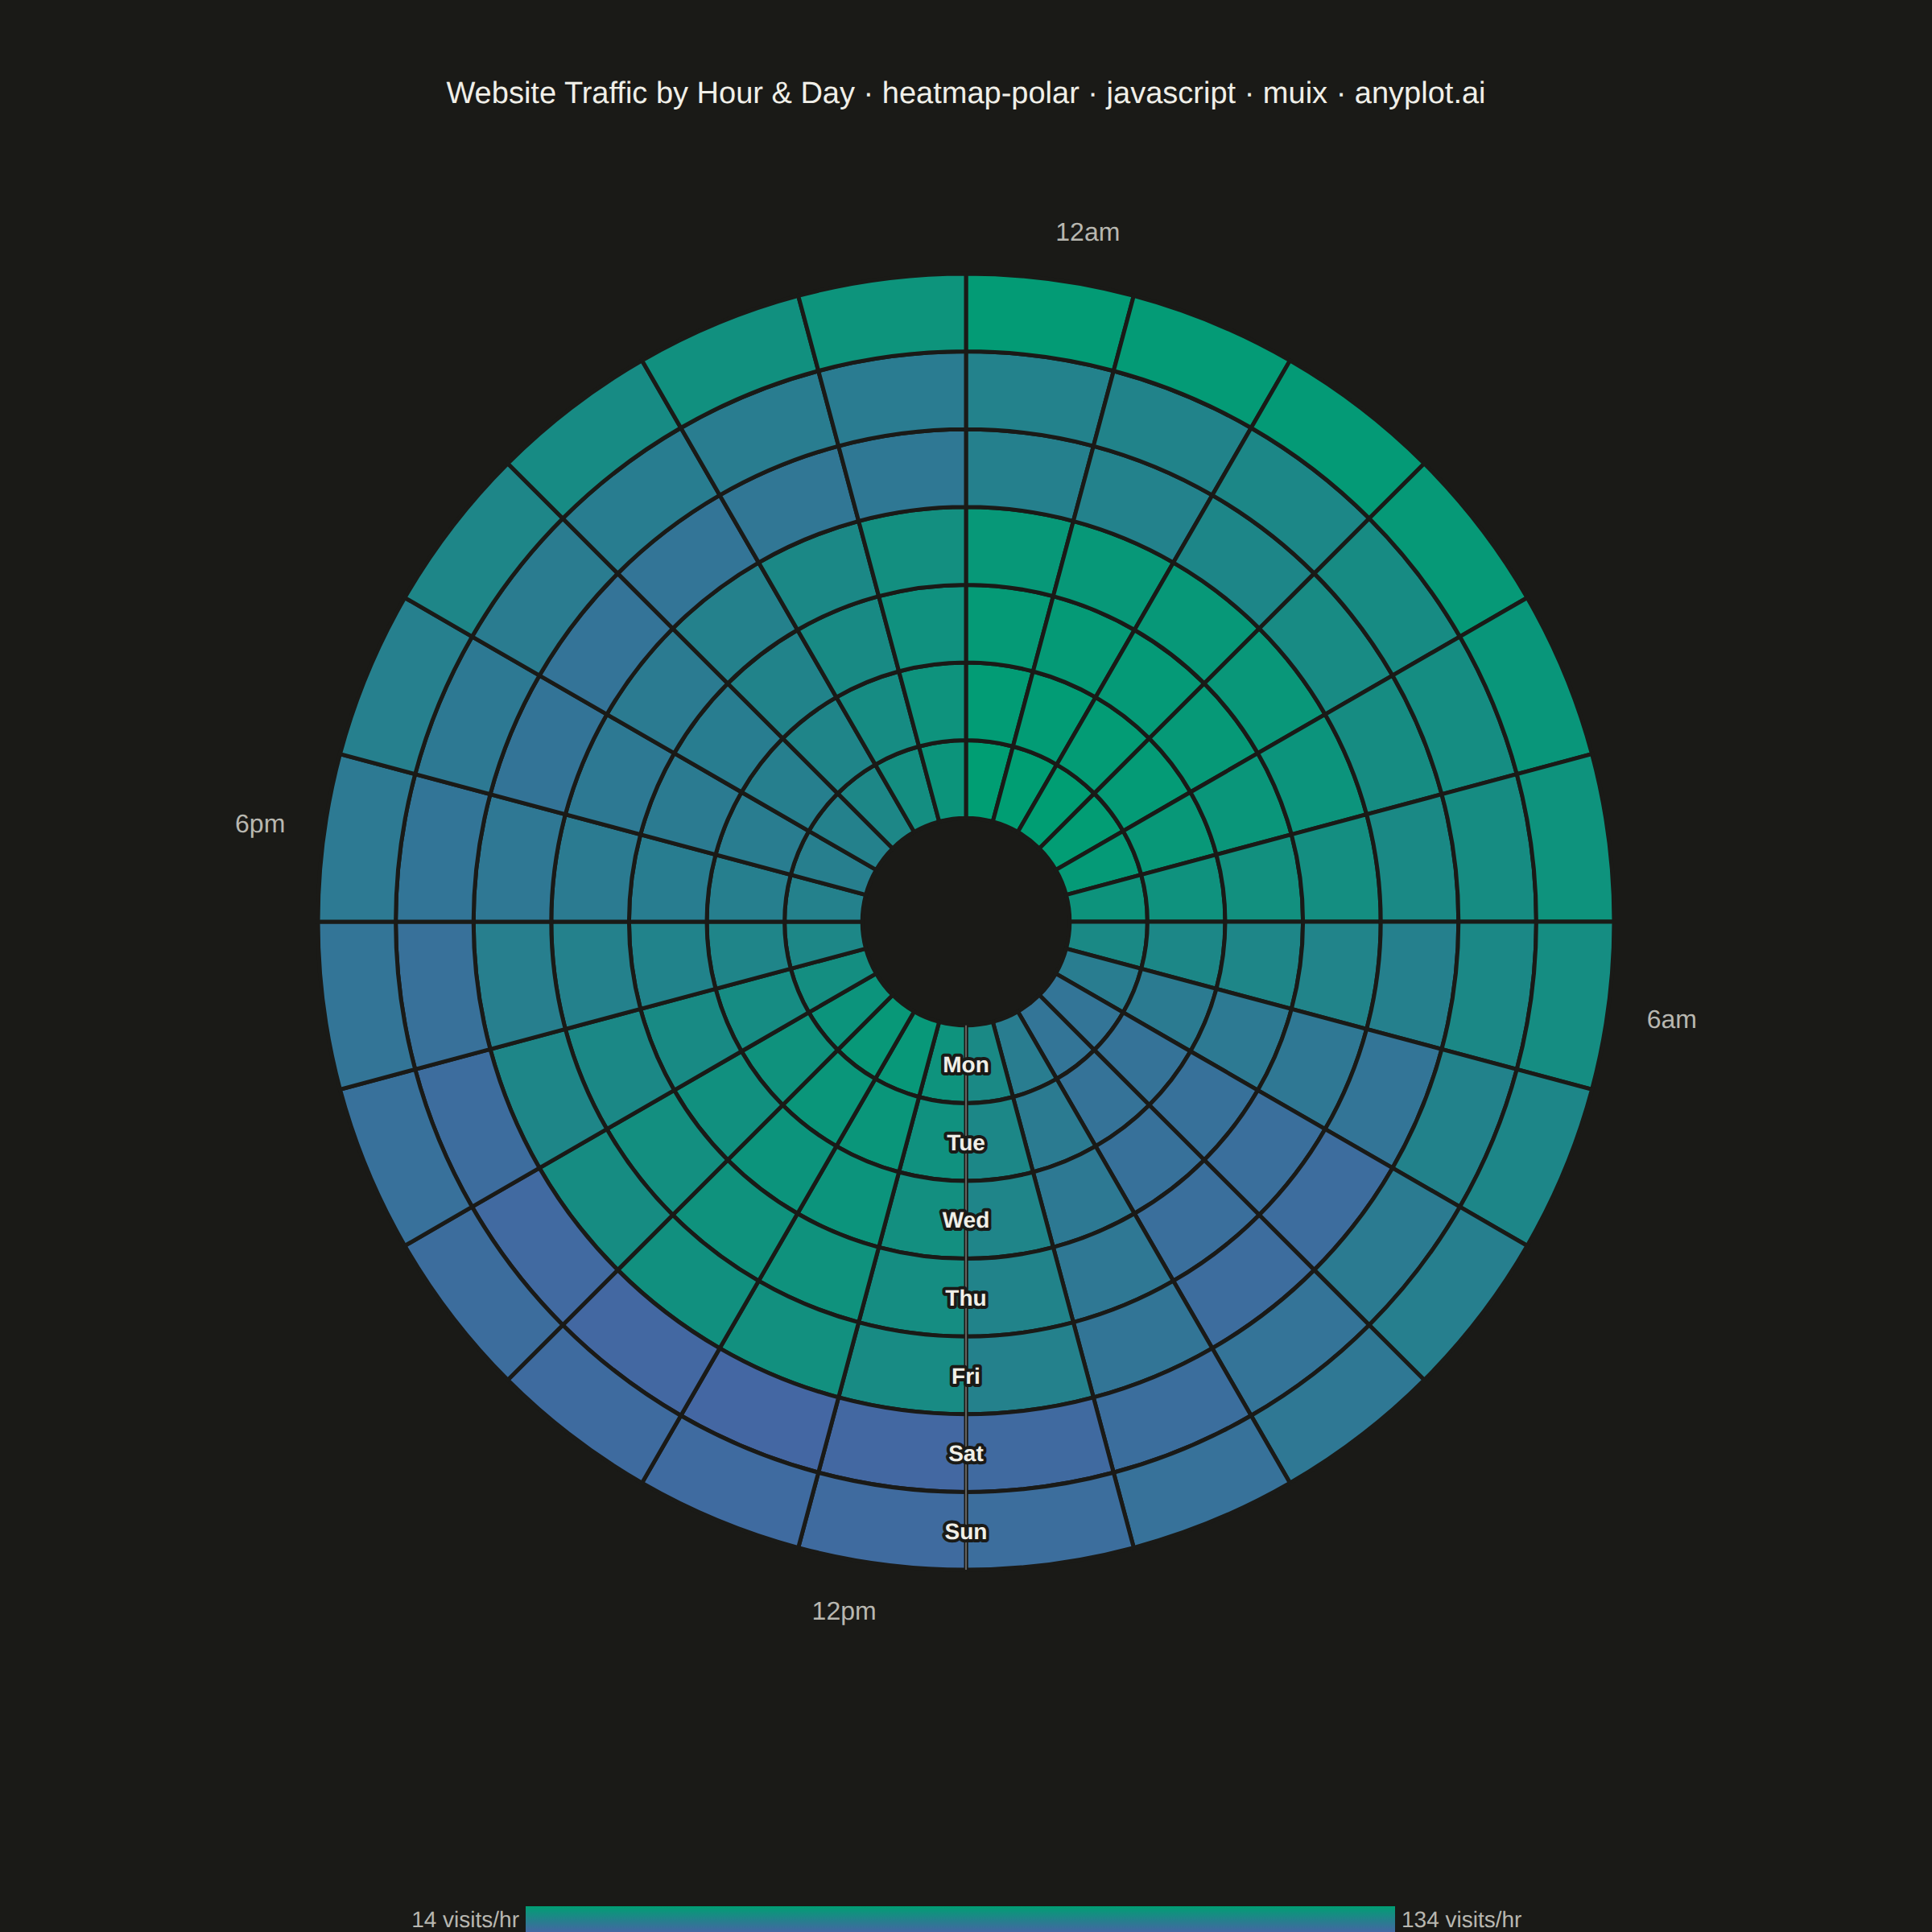
The same plot in 14 other libraries — JavaScript: Chart.js, D3.js, Apache ECharts, Highcharts; Python: Altair, Bokeh, lets-plot, Matplotlib, Plotly, plotnine, Pygal, Seaborn; R: ggplot2; Julia: Makie.jl. Compare all 15 side by side: Polar Heatmap for Cyclic Two-Dimensional Data in Python, R, Julia and JavaScript.
A heatmap wrapped around a circle where the angular axis represents a cyclic variable (e.g., hour of day, month) and the radial axis represents a second categorical or ordinal variable (e.g., day of week, year). Cell color encodes the measured value. This visualization reveals patterns in data with inherent cyclical structure that rectangular heatmaps distort, since the first and last angular bins are visually adjacent rather than separated at opposite ends of a row.
// anyplot.ai
// heatmap-polar: Polar Heatmap for Cyclic Two-Dimensional Data
// Library: muix 7.29.1 | JavaScript 22.23.2
// Quality: 89/100 | Created: 2026-09-05
//# anyplot-orientation: square
// anyplot.ai
// heatmap-polar: Polar Heatmap for Cyclic Two-Dimensional Data
// Library: MUI X Charts | React | Node 22
// License: @mui/x-charts — MIT (community). Pro/Premium are out of scope.
// Quality: pending | Created: 2026-09-05

import { ChartContainer } from "@mui/x-charts/ChartContainer";
import { useDrawingArea } from "@mui/x-charts/hooks";
import { ContinuousColorLegend } from "@mui/x-charts/ChartsLegend";

// @mui/x-charts 7.x community has neither a polar coordinate system nor a
// Heatmap component (Heatmap ships only in the paid @mui/x-charts-pro), so the
// polar grid is composed directly on MUI X's own surface: ChartContainer draws
// the sized <svg> + drawing area, useDrawingArea() gives the plot rect the
// wedges are mapped onto, and a zAxis continuous colorMap feeds the same
// ContinuousColorLegend component ScatterChart heatmaps use elsewhere in this
// catalog — a real gradient legend, not a drawn stand-in.

const t = window.ANYPLOT_TOKENS;
const size = window.ANYPLOT_SIZE;

// --- Data (in-memory, deterministic) — hourly website visits by day of week ---
const DAYS = ["Mon", "Tue", "Wed", "Thu", "Fri", "Sat", "Sun"];
const HOURS = 24;

function gauss(x, mu, sigma) {
  const d = x - mu;
  return Math.exp(-(d * d) / (2 * sigma * sigma));
}

// Distance around the 24h clock face, so a peak near midnight (hour 23 vs.
// hour 0) is treated as adjacent rather than 23 hours apart.
function cyclicDist(hour, center) {
  const d = Math.abs(hour - center);
  return Math.min(d, HOURS - d);
}

function visits(dayIdx, hour) {
  const isWeekend = dayIdx >= 5; // Sat, Sun
  const isNightlifeDay = dayIdx === 4 || dayIdx === 5; // Fri, Sat late-night crowd
  // Baseline traffic climbs through the work week toward the weekend, then
  // eases off Sunday -- a realistic trend that also sharpens the ring-to-ring
  // (radial) contrast at a fixed hour, since each day now carries a distinct
  // floor on top of its hourly shape.
  const base = [14, 18, 22, 26, 31, 27, 19][dayIdx];
  const morning = isWeekend ? 55 * gauss(hour, 10, 3.2) : 92 * gauss(hour, 8.5, 2.1);
  const evening = isWeekend ? 85 * gauss(hour, 15.5, 4.2) : 68 * gauss(hour, 19, 2.6);
  // Peaks exactly at midnight — the case a rectangular heatmap would split
  // across its first/last column instead of showing as one continuous band.
  const nightlife = isNightlifeDay ? 48 * gauss(cyclicDist(hour, 0), 0, 2.4) : 0;
  return base + morning + evening + nightlife;
}

const cells = [];
let minValue = Infinity;
let maxValue = -Infinity;
for (let day = 0; day < DAYS.length; day += 1) {
  for (let hour = 0; hour < HOURS; hour += 1) {
    const value = visits(day, hour);
    cells.push({ day, hour, value });
    minValue = Math.min(minValue, value);
    maxValue = Math.max(maxValue, value);
  }
}
const MIN_LABEL = `${Math.round(minValue)} visits/hr`;
const MAX_LABEL = `${Math.round(maxValue)} visits/hr`;

// --- Sequential Imprint color scale (imprint_seq: brand green -> blue) --------
function mixHex(hexA, hexB, ratio) {
  const a = parseInt(hexA.slice(1), 16);
  const b = parseInt(hexB.slice(1), 16);
  const channel = (shift) => {
    const av = (a >> shift) & 255;
    const bv = (b >> shift) & 255;
    return Math.round(av + (bv - av) * ratio);
  };
  return `#${[16, 8, 0].map((shift) => channel(shift).toString(16).padStart(2, "0")).join("")}`;
}
function seqColor(frac) {
  return mixHex(t.seq[0], t.seq[1], Math.max(0, Math.min(1, frac)));
}

// --- Title (fontsize scaled to the 67-char mandated-title baseline) ----------
const TITLE = "Website Traffic by Hour & Day · heatmap-polar · javascript · muix · anyplot.ai";
const TITLE_FONT_SIZE = Math.max(15, Math.round(22 * Math.min(1, 67 / TITLE.length)));

// Angular axis tiles the full 360 degrees with no gap -- hour 23 and hour 0
// are adjacent wedges, preserving the cyclic-continuity guarantee the spec
// calls out as the reason to use a polar layout over a rectangular one.
const START_ANGLE = 0;
const ANGLE_PER_HOUR = 360 / HOURS;
const RING_HOLE_RATIO = 0.16;
const LABEL_PAD = 40;
// Day-of-week labels run along a single radial spoke at the bottom (the
// noon boundary) rather than inside an angular gap, so they never interrupt
// the continuous wrap around midnight. A text halo (paint-order: stroke)
// keeps them legible over whichever wedge color they land on.
const DAY_LABEL_ANGLE = 180;

// --- Polar heatmap layer: rendered as children inside MUI X's ChartsSurface ---
function PolarHeatmapLayer() {
  const area = useDrawingArea();
  const cx = area.left + area.width / 2;
  const cy = area.top + area.height / 2;
  const outerR = Math.min(area.width, area.height) / 2 - LABEL_PAD;
  const innerR = outerR * RING_HOLE_RATIO;
  const ringThickness = (outerR - innerR) / DAYS.length;

  // angle 0 = straight up (12am), increasing clockwise — matches a clock face.
  const polarPoint = (angleDeg, r) => {
    const rad = (angleDeg * Math.PI) / 180;
    return [cx + r * Math.sin(rad), cy - r * Math.cos(rad)];
  };

  const wedgePath = (r0, r1, a0, a1) => {
    const [x0, y0] = polarPoint(a0, r1);
    const [x1, y1] = polarPoint(a1, r1);
    const [x2, y2] = polarPoint(a1, r0);
    const [x3, y3] = polarPoint(a0, r0);
    return `M ${x0} ${y0} A ${r1} ${r1} 0 0 1 ${x1} ${y1} L ${x2} ${y2} A ${r0} ${r0} 0 0 0 ${x3} ${y3} Z`;
  };

  const hourMarks = [
    { hour: 0, label: "12am" },
    { hour: 6, label: "6am" },
    { hour: 12, label: "12pm" },
    { hour: 18, label: "6pm" },
  ];

  return (
    <g>
      {cells.map((cell) => {
        const r0 = innerR + cell.day * ringThickness;
        const r1 = r0 + ringThickness;
        const a0 = START_ANGLE + cell.hour * ANGLE_PER_HOUR;
        const a1 = a0 + ANGLE_PER_HOUR;
        const frac = (cell.value - minValue) / (maxValue - minValue);
        return (
          <path
            key={`${cell.day}-${cell.hour}`}
            d={wedgePath(r0, r1, a0, a1)}
            fill={seqColor(frac)}
            stroke={t.pageBg}
            strokeWidth={2.5}
          />
        );
      })}

      {hourMarks.map(({ hour, label }) => {
        const angle = START_ANGLE + (hour + 0.5) * ANGLE_PER_HOUR;
        const [lx, ly] = polarPoint(angle, outerR + 24);
        const dx = lx - cx;
        const dy = ly - cy;
        const anchor = dx > 8 ? "start" : dx < -8 ? "end" : "middle";
        const baseline = dy > 8 ? "hanging" : dy < -8 ? "auto" : "central";
        return (
          <text
            key={`hour-${hour}`}
            x={lx}
            y={ly}
            fill={t.inkSoft}
            fontSize={16}
            textAnchor={anchor}
            dominantBaseline={baseline}
          >
            {label}
          </text>
        );
      })}

      <line
        x1={polarPoint(DAY_LABEL_ANGLE, innerR)[0]}
        y1={polarPoint(DAY_LABEL_ANGLE, innerR)[1]}
        x2={polarPoint(DAY_LABEL_ANGLE, outerR)[0]}
        y2={polarPoint(DAY_LABEL_ANGLE, outerR)[1]}
        stroke={t.ink}
        strokeWidth={1}
        strokeOpacity={0.35}
      />
      {DAYS.map((day, i) => {
        const r = innerR + (i + 0.5) * ringThickness;
        const [lx, ly] = polarPoint(DAY_LABEL_ANGLE, r);
        return (
          <text
            key={`day-${day}`}
            x={lx}
            y={ly}
            fill={t.ink}
            fontSize={14}
            fontWeight={700}
            textAnchor="middle"
            dominantBaseline="central"
            stroke={t.pageBg}
            strokeWidth={4}
            strokeLinejoin="round"
            paintOrder="stroke"
          >
            {day}
          </text>
        );
      })}
    </g>
  );
}

function Title() {
  return (
    <text x={size.width / 2} y={64} fill={t.ink} fontSize={TITLE_FONT_SIZE} fontWeight={500} textAnchor="middle">
      {TITLE}
    </text>
  );
}

// --- Chart (default-exported component — the harness mounts it) --------------
export default function Chart() {
  return (
    <ChartContainer
      width={size.width}
      height={size.height}
      series={[]}
      zAxis={[
        {
          id: "visits",
          min: minValue,
          max: maxValue,
          colorMap: { type: "continuous", min: minValue, max: maxValue, color: seqColor },
        },
      ]}
      margin={{ top: 130, bottom: 185, left: 70, right: 70 }}
      skipAnimation
    >
      <Title />
      <PolarHeatmapLayer />
      <ContinuousColorLegend
        axisId="visits"
        axisDirection="z"
        position={{ horizontal: "middle", vertical: "bottom" }}
        length="45%"
        thickness={16}
        minLabel={MIN_LABEL}
        maxLabel={MAX_LABEL}
        labelStyle={{ fontSize: 14, fill: t.inkSoft, fontFamily: "inherit" }}
      />
    </ChartContainer>
  );
}
Runnable source as JSON, for any HTTP client: https://api.anyplot.ai/specs/heatmap-polar/muix/code. Any spec id and library id listed in llms-full.txt fit the same URL shape; every URL below is complete and callable.
{
  "spec_id": "heatmap-polar",
  "language": "javascript",
  "library": "muix",
  "page": "https://anyplot.ai/heatmap-polar/javascript/muix",
  "hub": "https://anyplot.ai/heatmap-polar",
  "code_json": "https://api.anyplot.ai/specs/heatmap-polar/muix/code",
  "spec_json": "https://api.anyplot.ai/specs/heatmap-polar",
  "render_light_png": "https://storage.googleapis.com/anyplot-images/plots/heatmap-polar/javascript/muix/plot-light.png",
  "render_dark_png": "https://storage.googleapis.com/anyplot-images/plots/heatmap-polar/javascript/muix/plot-dark.png",
  "interactive_light_html": "https://storage.googleapis.com/anyplot-images/plots/heatmap-polar/javascript/muix/plot-light.html",
  "interactive_dark_html": "https://storage.googleapis.com/anyplot-images/plots/heatmap-polar/javascript/muix/plot-dark.html",
  "quality_score": 89.0,
  "license": "MIT",
  "guide": "https://anyplot.ai/llms.txt"
}
Part of Polar Heatmap for Cyclic Two-Dimensional Data on anyplot.ai.