The same plot in 14 other libraries — JavaScript: D3.js, Apache ECharts, Highcharts, MUI X Charts; Python: Altair, Bokeh, lets-plot, Matplotlib, Plotly, plotnine, Pygal, Seaborn; R: ggplot2; Julia: Makie.jl. Compare all 15 side by side: Polar Heatmap for Cyclic Two-Dimensional Data in Python, R, Julia and JavaScript.
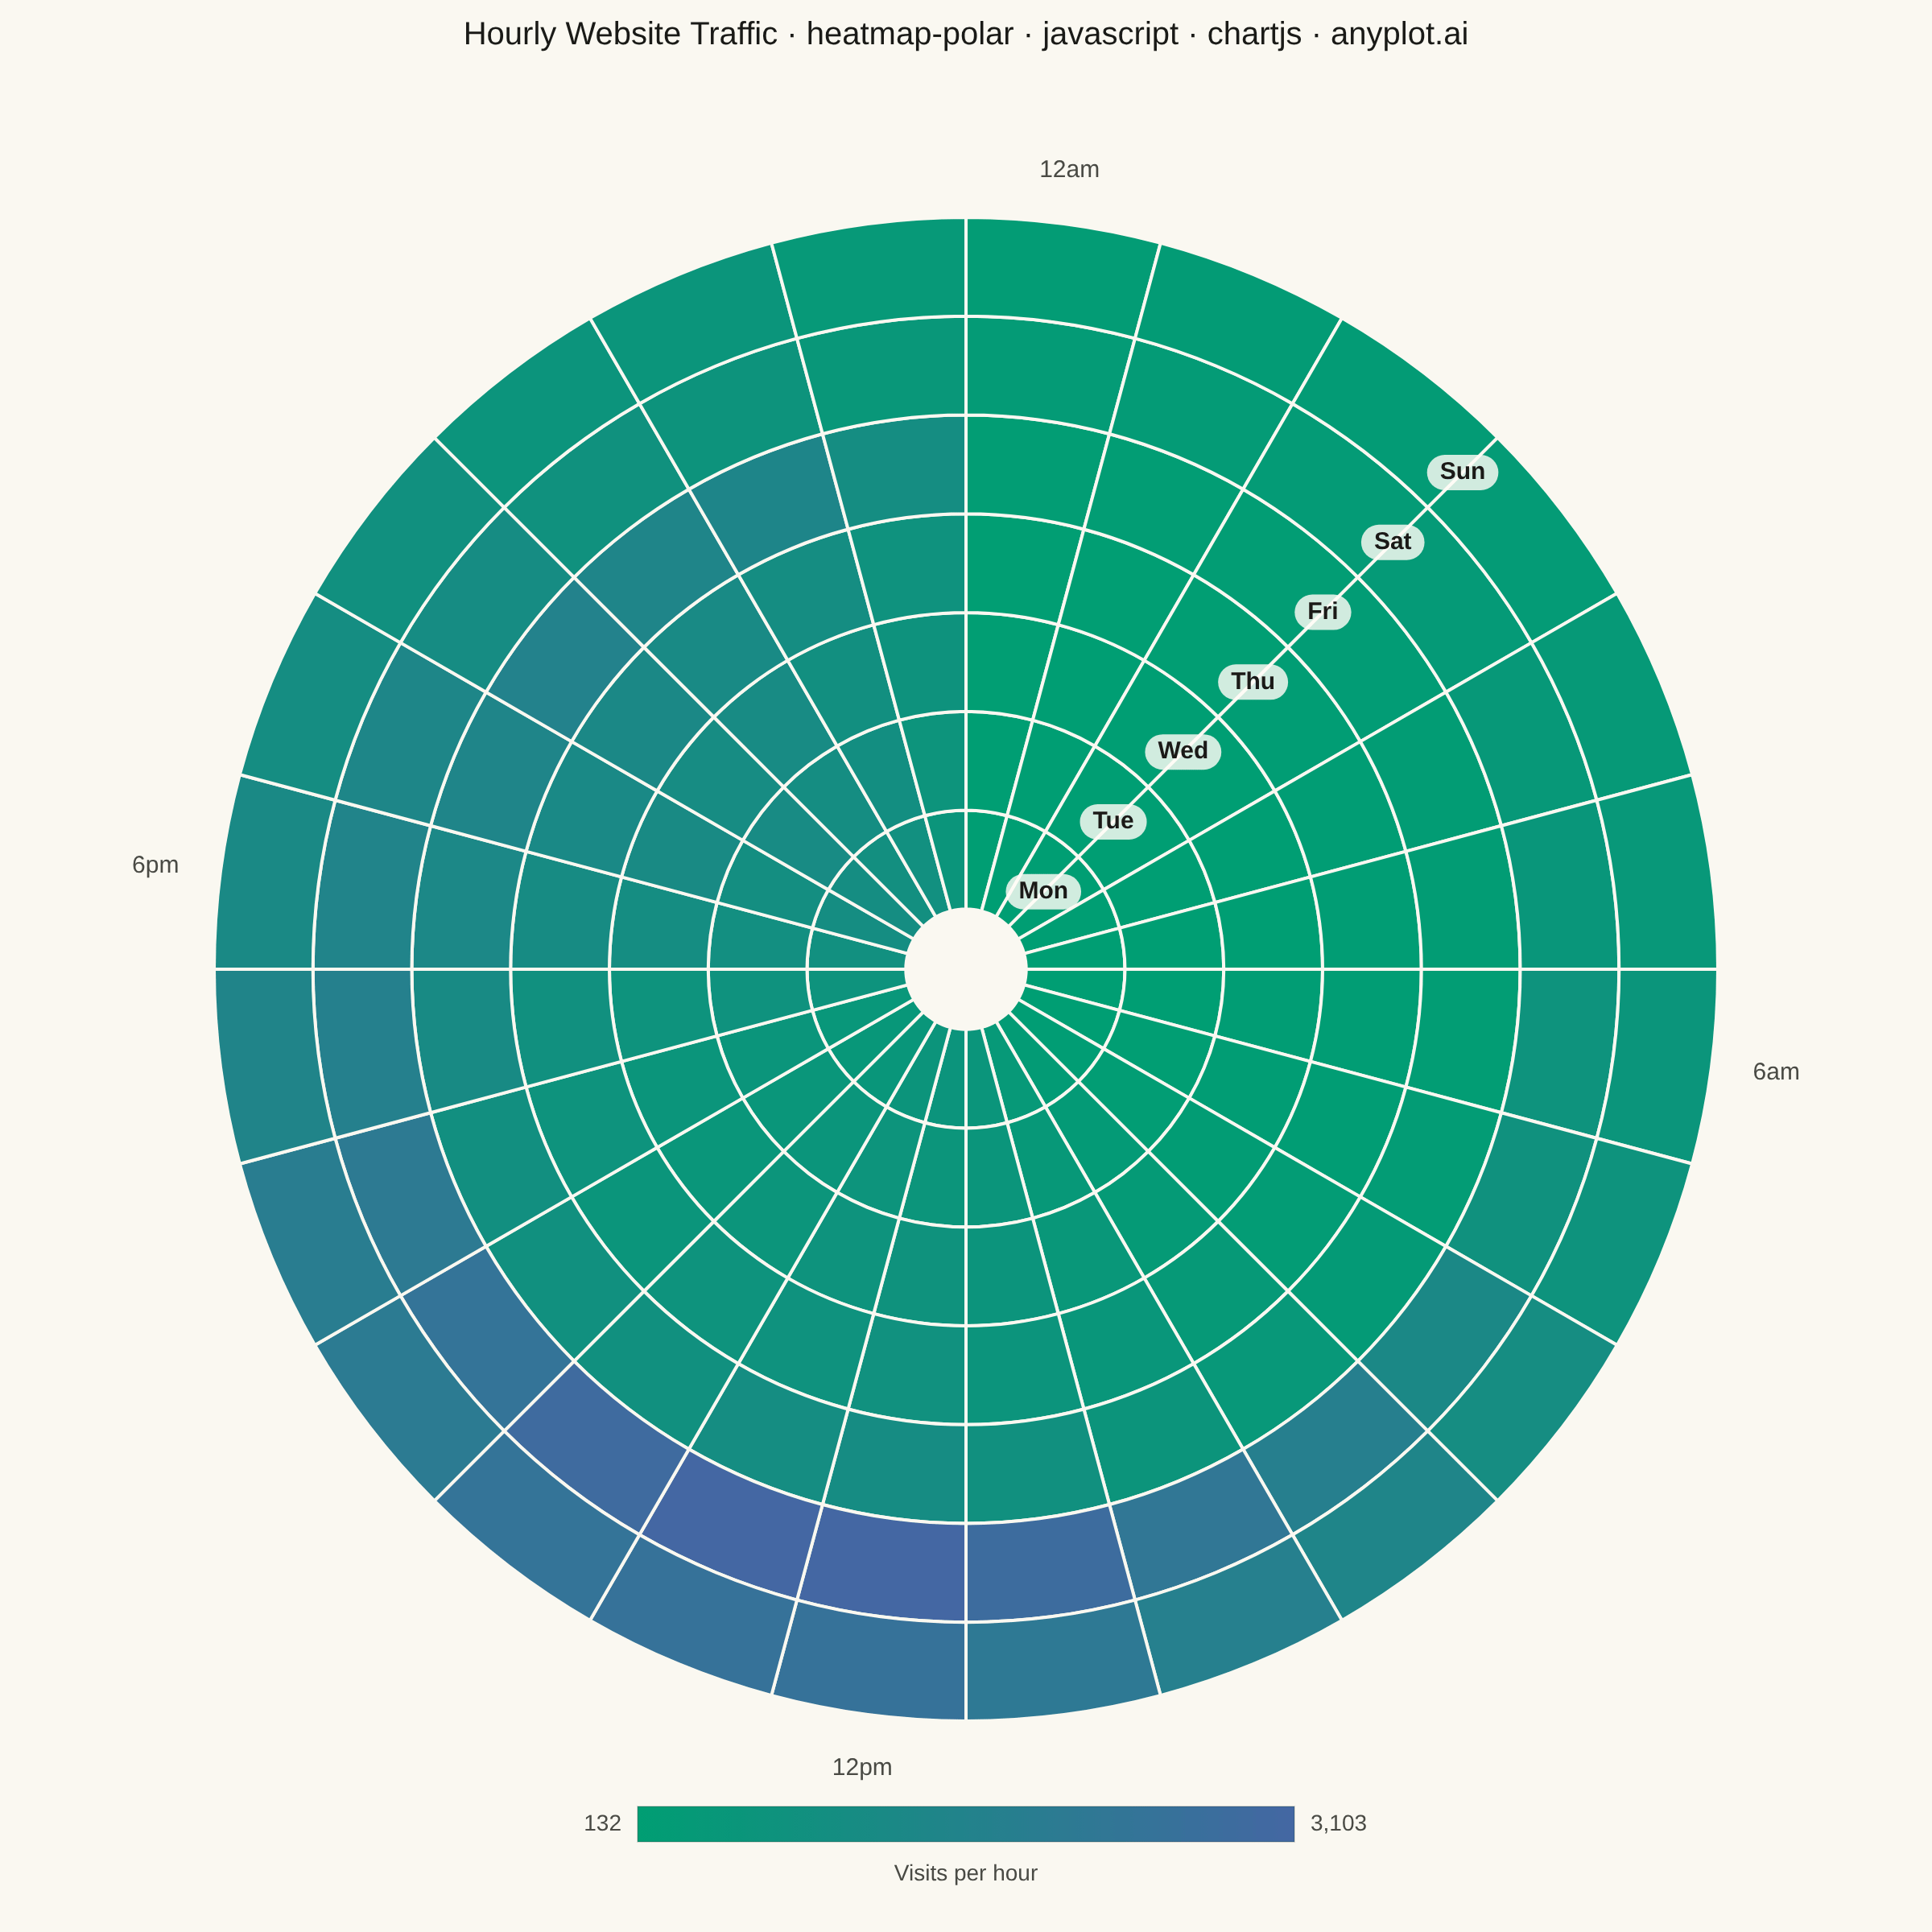
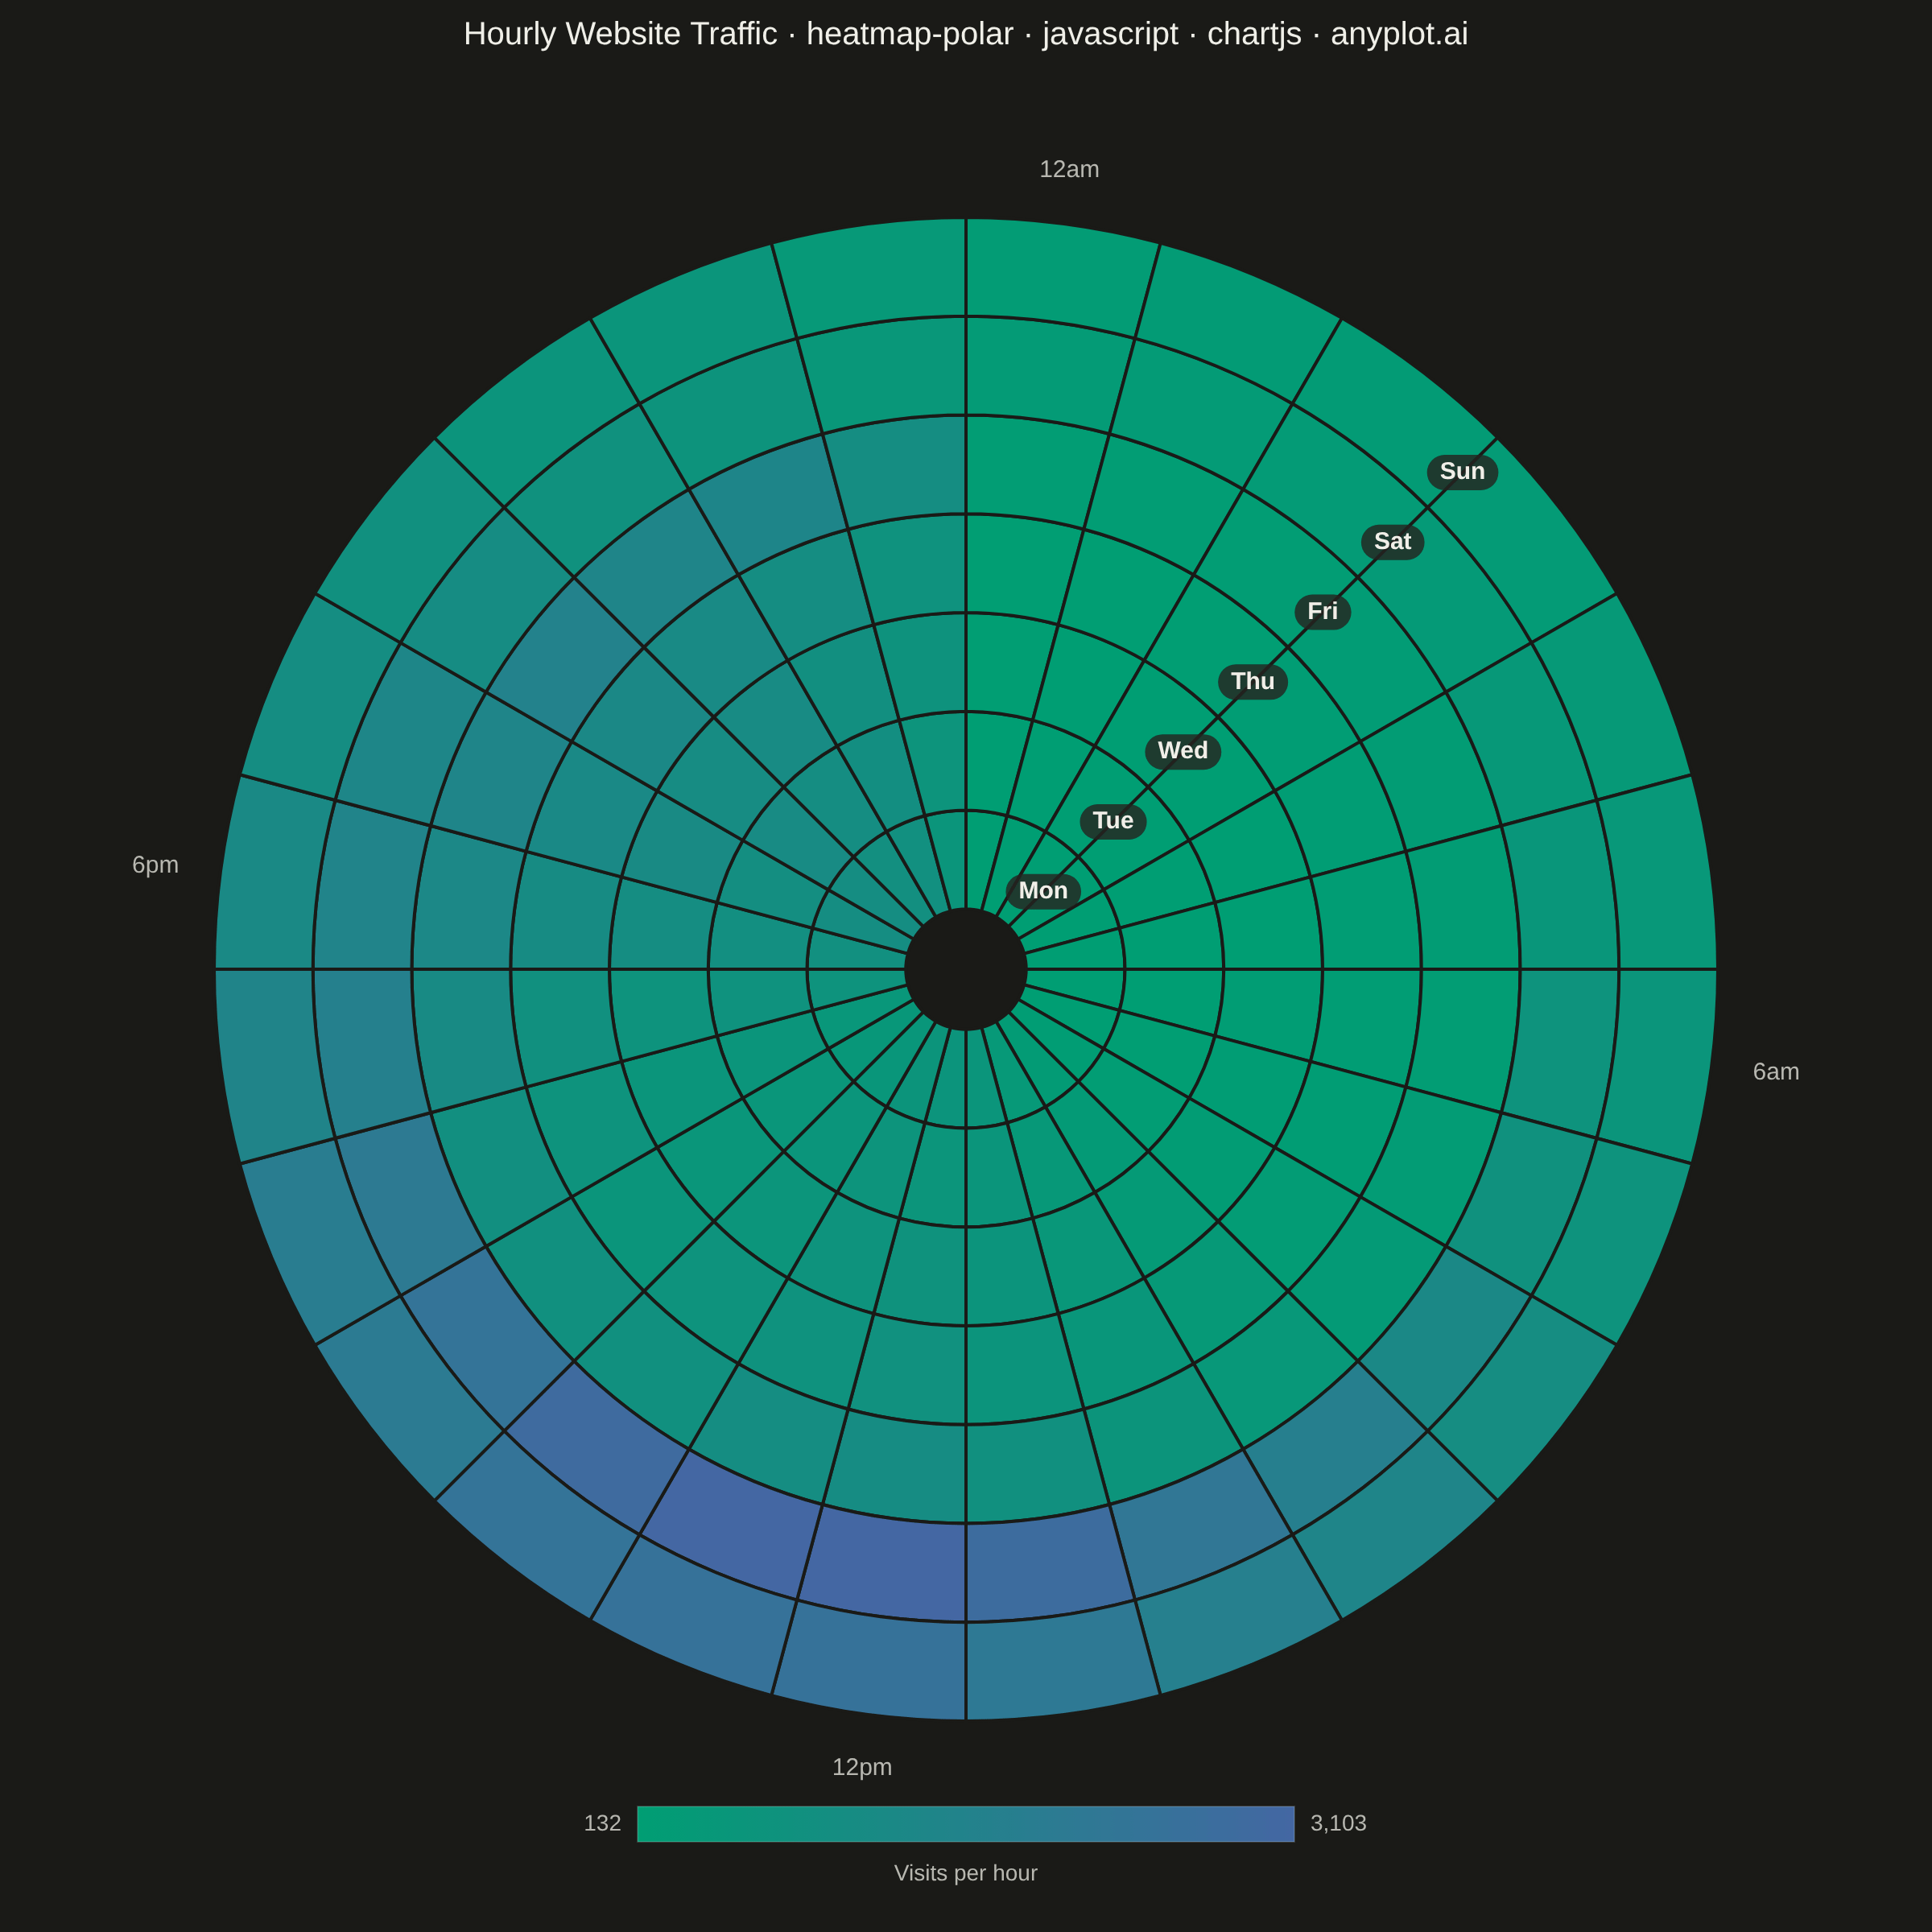
A heatmap wrapped around a circle where the angular axis represents a cyclic variable (e.g., hour of day, month) and the radial axis represents a second categorical or ordinal variable (e.g., day of week, year). Cell color encodes the measured value. This visualization reveals patterns in data with inherent cyclical structure that rectangular heatmaps distort, since the first and last angular bins are visually adjacent rather than separated at opposite ends of a row.
// anyplot.ai
// heatmap-polar: Polar Heatmap for Cyclic Two-Dimensional Data
// Library: chartjs 4.4.7 | JavaScript 22.23.2
// Quality: 92/100 | Created: 2026-09-05
//# anyplot-orientation: square

const t = window.ANYPLOT_TOKENS;

// --- Data (in-memory, deterministic) ----------------------------------------
// Hourly e-commerce site traffic across the 7 days of the week (radial rings,
// Monday innermost) and 24 hours of the day (angular position, midnight at
// the top, running clockwise so the angular axis reads like a 24h clock).
const dayLabels = ["Mon", "Tue", "Wed", "Thu", "Fri", "Sat", "Sun"];
const hourLabels = Array.from({ length: 24 }, (_, hour) =>
  hour === 0 ? "12am" : hour < 12 ? `${hour}am` : hour === 12 ? "12pm" : `${hour - 12}pm`
);

// Small fixed-seed LCG — the browser has no seeded RNG.
let seed = 42;
const rand = () => {
  seed = (seed * 1103515245 + 12345) & 0x7fffffff;
  return seed / 0x7fffffff;
};

const gaussian = (x, mu, sigma) => Math.exp(-((x - mu) ** 2) / (2 * sigma * sigma));

// Weekends skew toward leisure browsing (higher overall, broader afternoon
// peak); weekdays peak after office hours.
const dayWeight = { Mon: 0.75, Tue: 0.8, Wed: 0.85, Thu: 0.95, Fri: 1.2, Sat: 1.6, Sun: 1.35 };
const baseVisits = 2200;

const visitsByDayHour = dayLabels.map((day) => {
  const isWeekend = day === "Sat" || day === "Sun";
  return hourLabels.map((_, hour) => {
    const eveningPeak = gaussian(hour, isWeekend ? 14 : 20, isWeekend ? 4.5 : 3);
    const lunchPeak = gaussian(hour, 12, 2);
    const nightFloor = 0.08;
    const intensity = nightFloor + 0.55 * eveningPeak + 0.3 * lunchPeak;
    const noise = 1 + (rand() - 0.5) * 0.16;
    return Math.round(baseVisits * dayWeight[day] * intensity * noise);
  });
});

const allValues = visitsByDayHour.flat();
const valueMin = Math.min(...allValues);
const valueMax = Math.max(...allValues);

// --- Color mapping: imprint_seq (single-polarity continuous) ---------------
const hexToRgb = (hex) => [1, 3, 5].map((i) => parseInt(hex.slice(i, i + 2), 16));
const [seqLo, seqHi] = t.seq.map(hexToRgb);
const valueToColor = (value) => {
  const f = (value - valueMin) / (valueMax - valueMin || 1);
  const [r, g, b] = seqLo.map((c, i) => Math.round(c + (seqHi[i] - c) * f));
  return `rgb(${r}, ${g}, ${b})`;
};

// --- Mount -------------------------------------------------------------------
const canvas = document.createElement("canvas");
document.getElementById("container").appendChild(canvas);

// --- Rings -------------------------------------------------------------------
// Chart.js stacks doughnut datasets with dataset[0] as the OUTERMOST ring, so
// the render order is reversed relative to dayLabels — Monday (the spec's
// first radial category) must be the LAST dataset to land innermost.
const renderOrder = [...dayLabels].reverse();
const datasets = renderOrder.map((day) => {
  const row = visitsByDayHour[dayLabels.indexOf(day)];
  const colors = row.map(valueToColor);
  return {
    label: day,
    data: hourLabels.map(() => 1), // equal angular width per hour — color alone carries the value
    backgroundColor: colors,
    hoverBackgroundColor: colors,
    borderColor: t.pageBg,
    hoverBorderColor: t.pageBg,
    borderWidth: 2,
  };
});

const title = "Hourly Website Traffic · heatmap-polar · javascript · chartjs · anyplot.ai";
// Title fontsize scaled from the 67-char baseline (default 22px): round(22 × 67/74) = 20
const titleFontSize = 20;

// --- Chrome plugin: angular hour ticks, radial day-ring labels, colorbar ----
const radialHeatmapChrome = {
  id: "radialHeatmapChrome",
  afterDraw(chart) {
    const { ctx } = chart;
    const outerArcs = chart.getDatasetMeta(0).data; // outermost ring (Sun)
    if (!outerArcs.length) return;
    const cx = outerArcs[0].x;
    const cy = outerArcs[0].y;
    const outerRadius = outerArcs[0].outerRadius;

    ctx.save();

    // Angular tick labels at the 4 cardinal hours (12am/6am/12pm/6pm)
    ctx.font = "500 15px -apple-system, BlinkMacSystemFont, sans-serif";
    ctx.fillStyle = t.inkSoft;
    [0, 6, 12, 18].forEach((hourIdx) => {
      const arc = outerArcs[hourIdx];
      const mid = (arc.startAngle + arc.endAngle) / 2;
      const lx = cx + (outerRadius + 26) * Math.cos(mid);
      const ly = cy + (outerRadius + 26) * Math.sin(mid);
      ctx.textAlign = Math.cos(mid) > 0.3 ? "left" : Math.cos(mid) < -0.3 ? "right" : "center";
      ctx.textBaseline = Math.sin(mid) > 0.3 ? "top" : Math.sin(mid) < -0.3 ? "bottom" : "middle";
      ctx.fillText(hourLabels[hourIdx], lx, ly);
    });

    // Radial ring labels (day names), placed on a spoke between the 12am and
    // 6am ticks so they never collide with the angular labels above.
    const spokeAngle = -Math.PI / 4;
    ctx.font = "600 15px -apple-system, BlinkMacSystemFont, sans-serif";
    renderOrder.forEach((day, ringIdx) => {
      const arc = chart.getDatasetMeta(ringIdx).data[0];
      const midRadius = (arc.innerRadius + arc.outerRadius) / 2;
      const lx = cx + midRadius * Math.cos(spokeAngle);
      const ly = cy + midRadius * Math.sin(spokeAngle);
      const textWidth = ctx.measureText(day).width;

      ctx.globalAlpha = 0.82;
      ctx.fillStyle = t.elevatedBg;
      ctx.beginPath();
      ctx.roundRect(lx - textWidth / 2 - 8, ly - 11, textWidth + 16, 22, 11);
      ctx.fill();
      ctx.globalAlpha = 1;

      ctx.fillStyle = t.ink;
      ctx.textAlign = "center";
      ctx.textBaseline = "middle";
      ctx.fillText(day, lx, ly);
    });

    // Colorbar legend (imprint_seq) in the bottom margin reserved by layout.padding
    const barWidth = chart.width * 0.34;
    const barHeight = 22;
    const barX = chart.width / 2 - barWidth / 2;
    const barY = chart.height - 78;
    const gradient = ctx.createLinearGradient(barX, 0, barX + barWidth, 0);
    gradient.addColorStop(0, t.seq[0]);
    gradient.addColorStop(1, t.seq[1]);
    ctx.fillStyle = gradient;
    ctx.fillRect(barX, barY, barWidth, barHeight);
    ctx.strokeStyle = t.grid;
    ctx.lineWidth = 1;
    ctx.strokeRect(barX, barY, barWidth, barHeight);

    ctx.font = "500 14px -apple-system, BlinkMacSystemFont, sans-serif";
    ctx.fillStyle = t.inkSoft;
    ctx.textBaseline = "middle";
    ctx.textAlign = "right";
    ctx.fillText(valueMin.toLocaleString(), barX - 10, barY + barHeight / 2);
    ctx.textAlign = "left";
    ctx.fillText(valueMax.toLocaleString(), barX + barWidth + 10, barY + barHeight / 2);
    ctx.textAlign = "center";
    ctx.fillText("Visits per hour", barX + barWidth / 2, barY + barHeight + 20);

    ctx.restore();
  },
};

// --- Chart -------------------------------------------------------------------
new Chart(canvas, {
  type: "doughnut",
  data: { labels: hourLabels, datasets },
  options: {
    responsive: true,
    maintainAspectRatio: false,
    animation: false,
    cutout: "8%",
    layout: { padding: { top: 10, bottom: 130 } },
    plugins: {
      legend: { display: false },
      title: {
        display: true,
        text: title,
        color: t.ink,
        font: { size: titleFontSize, weight: "500" },
        // Generous bottom padding keeps the 12am tick label (drawn just
        // outside the outer radius) clear of the title text above it.
        padding: { bottom: 100 },
      },
      tooltip: {
        callbacks: {
          title: (items) => {
            const day = renderOrder[items[0].datasetIndex];
            return `${day} · ${hourLabels[items[0].dataIndex]}`;
          },
          label: (item) => {
            const day = renderOrder[item.datasetIndex];
            const value = visitsByDayHour[dayLabels.indexOf(day)][item.dataIndex];
            return `${value.toLocaleString()} visits`;
          },
        },
      },
    },
  },
  plugins: [radialHeatmapChrome],
});
Runnable source as JSON, for any HTTP client: https://api.anyplot.ai/specs/heatmap-polar/chartjs/code. Any spec id and library id listed in llms-full.txt fit the same URL shape; every URL below is complete and callable.
{
  "spec_id": "heatmap-polar",
  "language": "javascript",
  "library": "chartjs",
  "page": "https://anyplot.ai/heatmap-polar/javascript/chartjs",
  "hub": "https://anyplot.ai/heatmap-polar",
  "code_json": "https://api.anyplot.ai/specs/heatmap-polar/chartjs/code",
  "spec_json": "https://api.anyplot.ai/specs/heatmap-polar",
  "render_light_png": "https://storage.googleapis.com/anyplot-images/plots/heatmap-polar/javascript/chartjs/plot-light.png",
  "render_dark_png": "https://storage.googleapis.com/anyplot-images/plots/heatmap-polar/javascript/chartjs/plot-dark.png",
  "interactive_light_html": "https://storage.googleapis.com/anyplot-images/plots/heatmap-polar/javascript/chartjs/plot-light.html",
  "interactive_dark_html": "https://storage.googleapis.com/anyplot-images/plots/heatmap-polar/javascript/chartjs/plot-dark.html",
  "quality_score": 92.0,
  "license": "MIT",
  "guide": "https://anyplot.ai/llms.txt"
}
Part of Polar Heatmap for Cyclic Two-Dimensional Data on anyplot.ai.