The same plot in 14 other libraries — JavaScript: Chart.js, D3.js, Highcharts, MUI X Charts; Python: Altair, Bokeh, lets-plot, Matplotlib, Plotly, plotnine, Pygal, Seaborn; R: ggplot2; Julia: Makie.jl. Compare all 15 side by side: Polar Heatmap for Cyclic Two-Dimensional Data in Python, R, Julia and JavaScript.
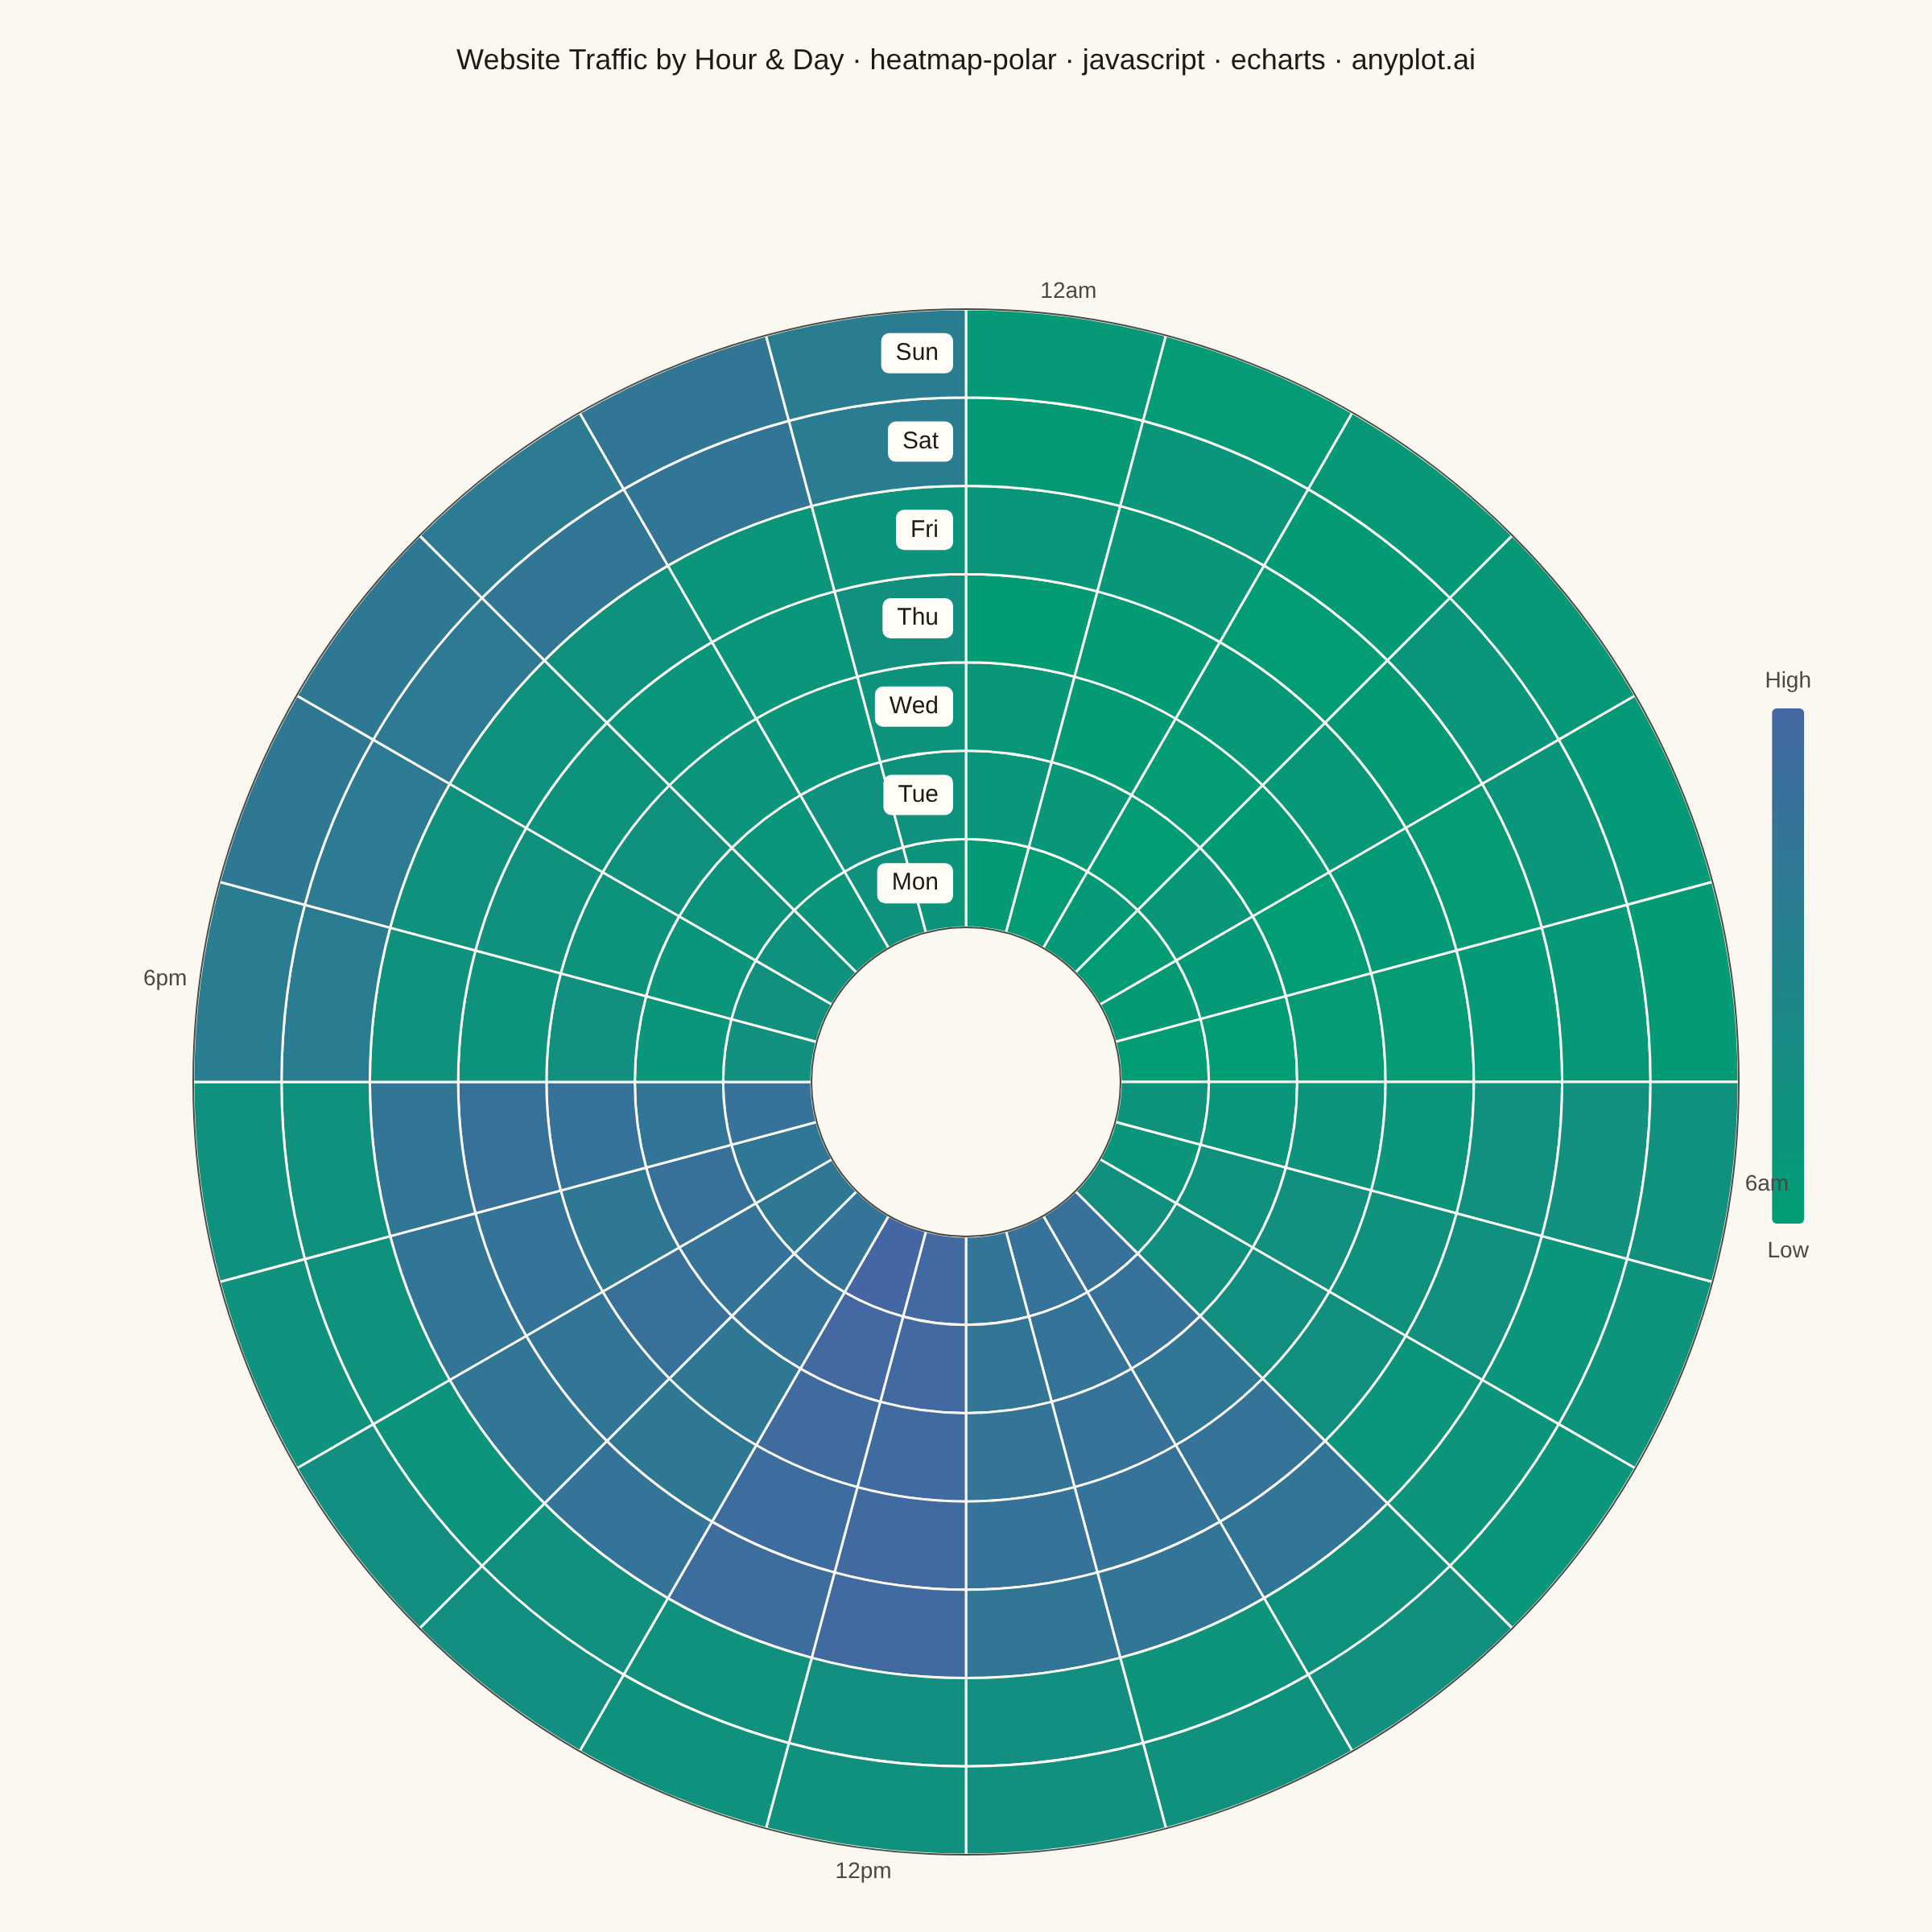
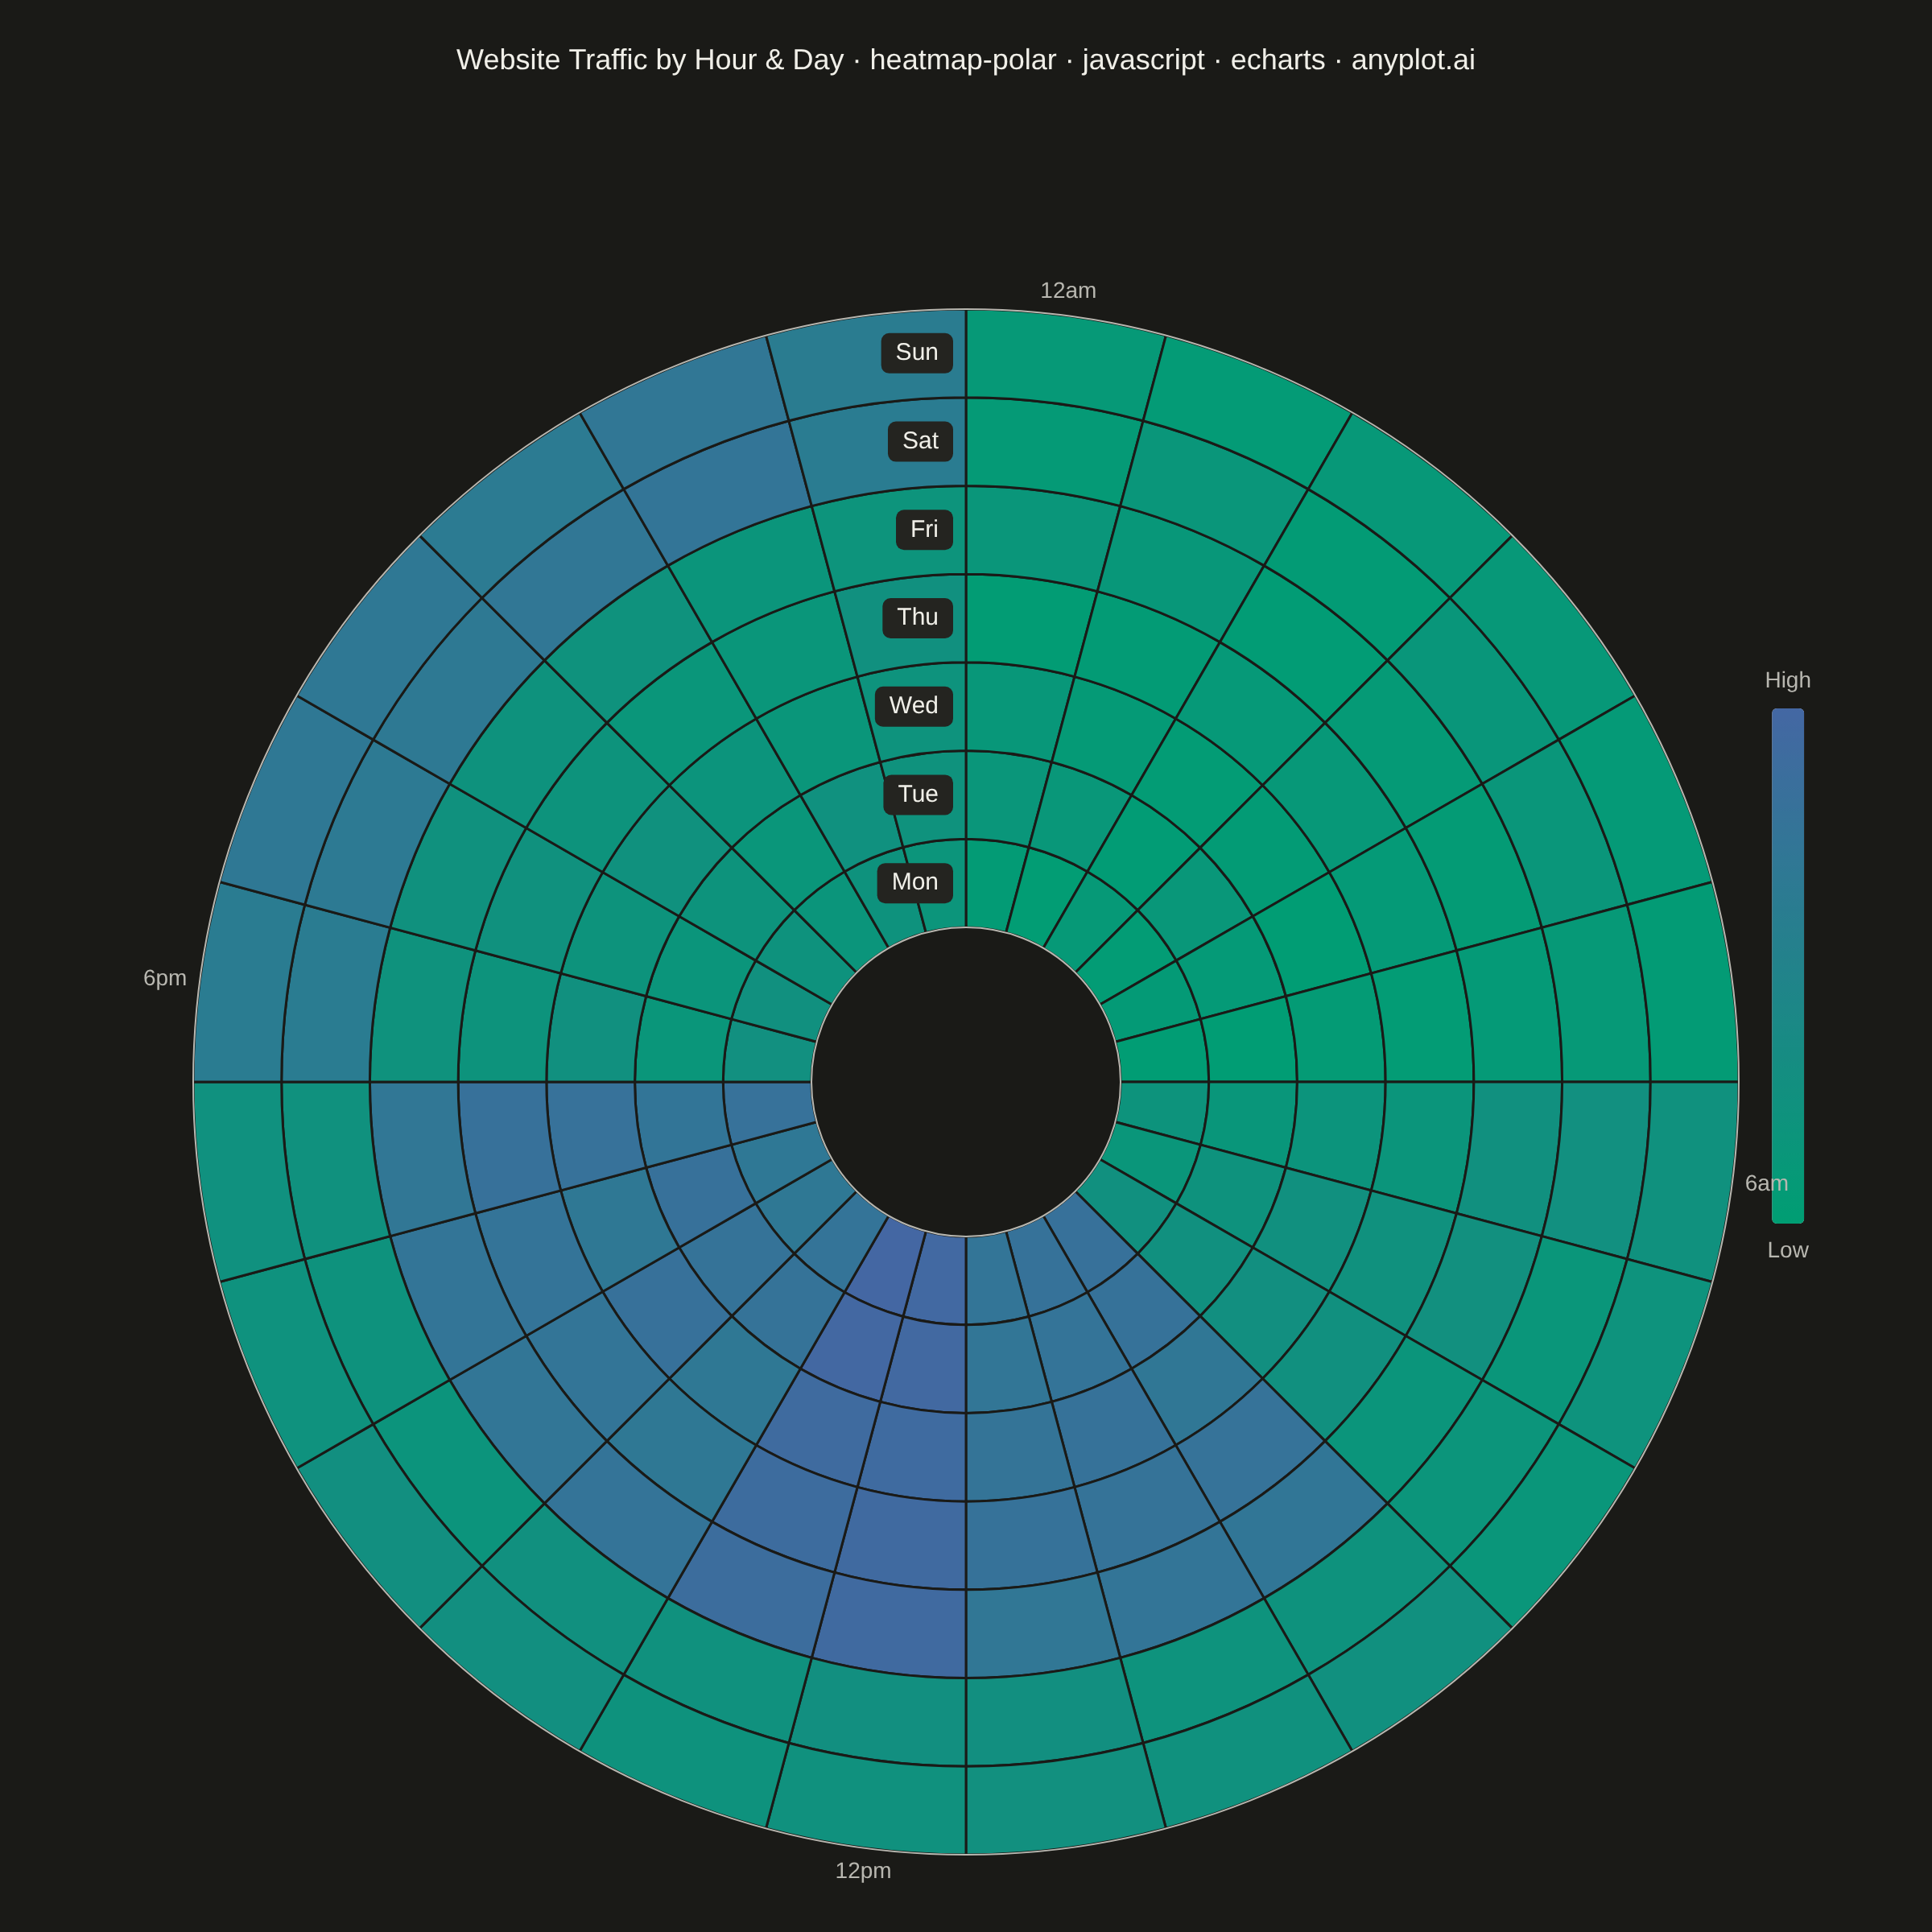
A heatmap wrapped around a circle where the angular axis represents a cyclic variable (e.g., hour of day, month) and the radial axis represents a second categorical or ordinal variable (e.g., day of week, year). Cell color encodes the measured value. This visualization reveals patterns in data with inherent cyclical structure that rectangular heatmaps distort, since the first and last angular bins are visually adjacent rather than separated at opposite ends of a row.
// anyplot.ai
// heatmap-polar: Polar Heatmap for Cyclic Two-Dimensional Data
// Library: echarts 6.1.0 | JavaScript 22.23.2
// Quality: 81/100 | Created: 2026-09-05

//# anyplot-orientation: square
const t = window.ANYPLOT_TOKENS;

// --- Data (in-memory, deterministic) ----------------------------------------
// Website visits by hour of day (angular, 24 bins, wraps continuously) and day
// of week (radial, 7 rings — Mon innermost). Native ECharts `heatmap` series
// only supports cartesian2d/calendar/matrix coordinate systems, so the polar
// cells are drawn with a `custom` series whose renderItem builds a `sector`
// shape from the polar coordinate system's own angle/radius mapping — the
// documented ECharts mechanism for chart types the built-in series don't cover.
const days = ["Mon", "Tue", "Wed", "Thu", "Fri", "Sat", "Sun"];
const hours = Array.from({ length: 24 }, (_, h) => h);

let seed = 42;
function rand() {
  seed = (seed * 1664525 + 1013904223) % 4294967296;
  return seed / 4294967296;
}

const cells = [];
let maxVisits = 0;
days.forEach((day, dayIdx) => {
  const isWeekend = dayIdx >= 5;
  hours.forEach((hour, hourIdx) => {
    const businessBump = !isWeekend && hour >= 9 && hour <= 17 ? 400 : 0;
    const lunchBump = !isWeekend && (hour === 12 || hour === 13) ? 150 : 0;
    const eveningBump = isWeekend && hour >= 18 && hour <= 23 ? 350 : 0;
    const overnightDip = hour <= 5 ? -90 : 0;
    const base = 150 + businessBump + lunchBump + eveningBump + overnightDip;
    const visits = Math.max(15, Math.round(base + rand() * 100 - 50));
    maxVisits = Math.max(maxVisits, visits);
    // [radiusIndex, angleIndex, value] — matches the polar coord order (radius, angle)
    // used by the polar custom-series API (see renderItem below).
    cells.push([dayIdx, hourIdx, visits]);
  });
});

// --- Custom-series renderItem: one annular sector per (day, hour) cell ------
function renderItem(params, api) {
  const radiusIdx = api.value(0);
  const angleIdx = api.value(1);
  const point = api.coord([radiusIdx, angleIdx]); // [x, y, radius, angleRad]
  const size = api.size([1, 1], [radiusIdx, angleIdx]); // [radiusBand, angleBandRad]
  // zrender's `sector` shape sweeps its angle in the opposite rotational
  // direction from the polar coordinate system's own angle convention (the
  // one that places the angleAxis tick labels), so the raw coordinate-system
  // angle must be negated here or every cell renders mirrored across the
  // horizontal axis relative to its labeled hour.
  const angle = -point[3];
  return {
    type: "sector",
    shape: {
      cx: params.coordSys.cx,
      cy: params.coordSys.cy,
      r0: point[2] - size[0] / 2,
      r: point[2] + size[0] / 2,
      startAngle: angle - size[1] / 2,
      endAngle: angle + size[1] / 2,
    },
    style: api.style({
      fill: api.visual("color"),
      stroke: t.pageBg,
      lineWidth: 1.5,
    }),
  };
}

// --- Init ---------------------------------------------------------------
const chart = echarts.init(document.getElementById("container"));

const title = "Website Traffic by Hour & Day · heatmap-polar · javascript · echarts · anyplot.ai";

chart.setOption({
  animation: false,
  backgroundColor: "transparent",
  title: {
    text: title,
    left: "center",
    top: 24,
    textStyle: { color: t.ink, fontSize: 18, fontWeight: 500 },
  },
  polar: { center: ["50%", "56%"], radius: ["16%", "80%"] },
  angleAxis: {
    type: "category",
    data: hours.map(String),
    polarIndex: 0,
    startAngle: 90,
    clockwise: true,
    z: 10,
    axisLabel: {
      color: t.inkSoft,
      fontSize: 14,
      formatter: (value) => {
        const hour = Number(value);
        if (hour === 0) return "12am";
        if (hour === 6) return "6am";
        if (hour === 12) return "12pm";
        if (hour === 18) return "6pm";
        return "";
      },
    },
    axisLine: { lineStyle: { color: t.inkSoft } },
    axisTick: { show: false },
    splitLine: { show: false },
  },
  // z:10 lifts the axis group above the custom sector series — the radius axis
  // sits inside the fully-covered ring (its own polar coordinate slot), so
  // without a higher z its day labels would be painted first and hidden
  // beneath the opaque cells. The elevated-bg label chip keeps them legible
  // against whichever cell color ends up underneath.
  radiusAxis: {
    type: "category",
    data: days,
    polarIndex: 0,
    z: 10,
    axisLabel: {
      color: t.ink,
      fontSize: 15,
      fontWeight: 500,
      backgroundColor: t.elevatedBg,
      padding: [5, 9],
      borderRadius: 5,
    },
    axisLine: { show: false },
    axisTick: { show: false },
    splitLine: { show: false },
  },
  visualMap: {
    type: "continuous",
    dimension: 2,
    min: 0,
    max: maxVisits,
    right: 60,
    top: "middle",
    itemHeight: 320,
    orient: "vertical",
    text: ["High", "Low"],
    textStyle: { color: t.inkSoft, fontSize: 14 },
    inRange: { color: t.seq },
  },
  series: [
    {
      type: "custom",
      coordinateSystem: "polar",
      data: cells,
      renderItem,
    },
  ],
});

chart.on("finished", () => {
  window.__anyplotReady = true;
});
Runnable source as JSON, for any HTTP client: https://api.anyplot.ai/specs/heatmap-polar/echarts/code. Any spec id and library id listed in llms-full.txt fit the same URL shape; every URL below is complete and callable.
{
  "spec_id": "heatmap-polar",
  "language": "javascript",
  "library": "echarts",
  "page": "https://anyplot.ai/heatmap-polar/javascript/echarts",
  "hub": "https://anyplot.ai/heatmap-polar",
  "code_json": "https://api.anyplot.ai/specs/heatmap-polar/echarts/code",
  "spec_json": "https://api.anyplot.ai/specs/heatmap-polar",
  "render_light_png": "https://storage.googleapis.com/anyplot-images/plots/heatmap-polar/javascript/echarts/plot-light.png",
  "render_dark_png": "https://storage.googleapis.com/anyplot-images/plots/heatmap-polar/javascript/echarts/plot-dark.png",
  "interactive_light_html": "https://storage.googleapis.com/anyplot-images/plots/heatmap-polar/javascript/echarts/plot-light.html",
  "interactive_dark_html": "https://storage.googleapis.com/anyplot-images/plots/heatmap-polar/javascript/echarts/plot-dark.html",
  "quality_score": 81.0,
  "license": "MIT",
  "guide": "https://anyplot.ai/llms.txt"
}
Part of Polar Heatmap for Cyclic Two-Dimensional Data on anyplot.ai.