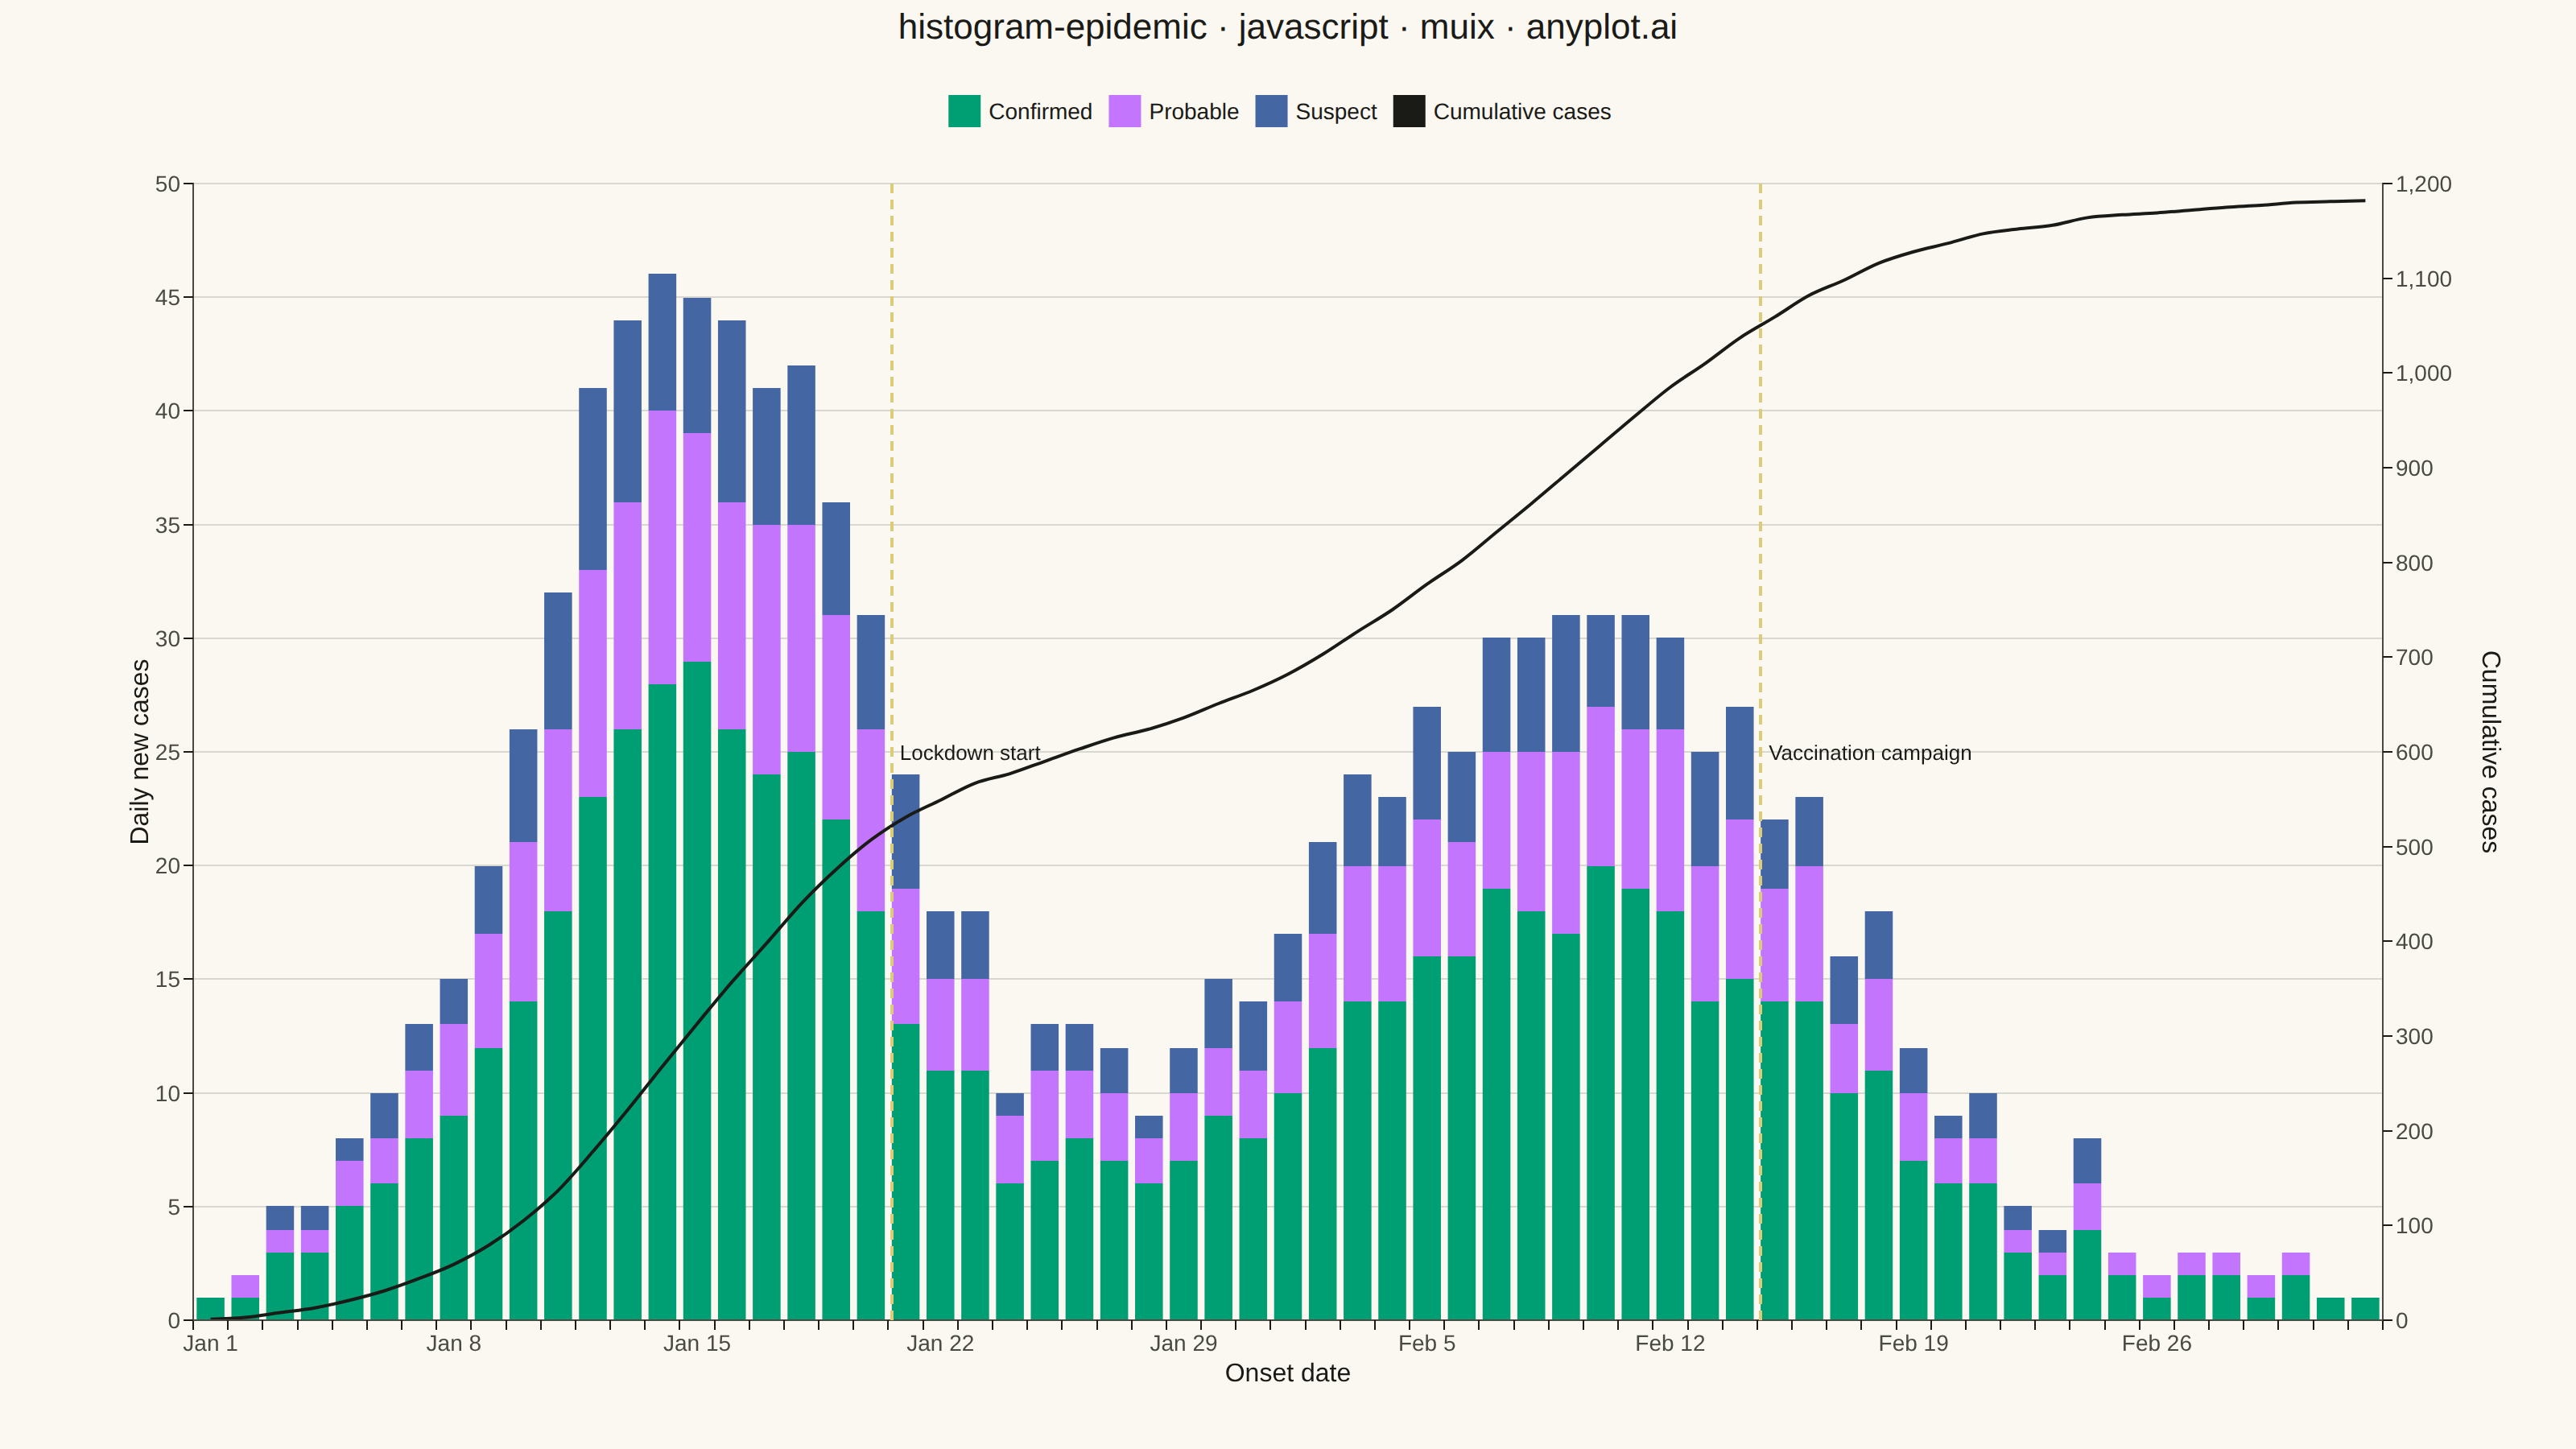
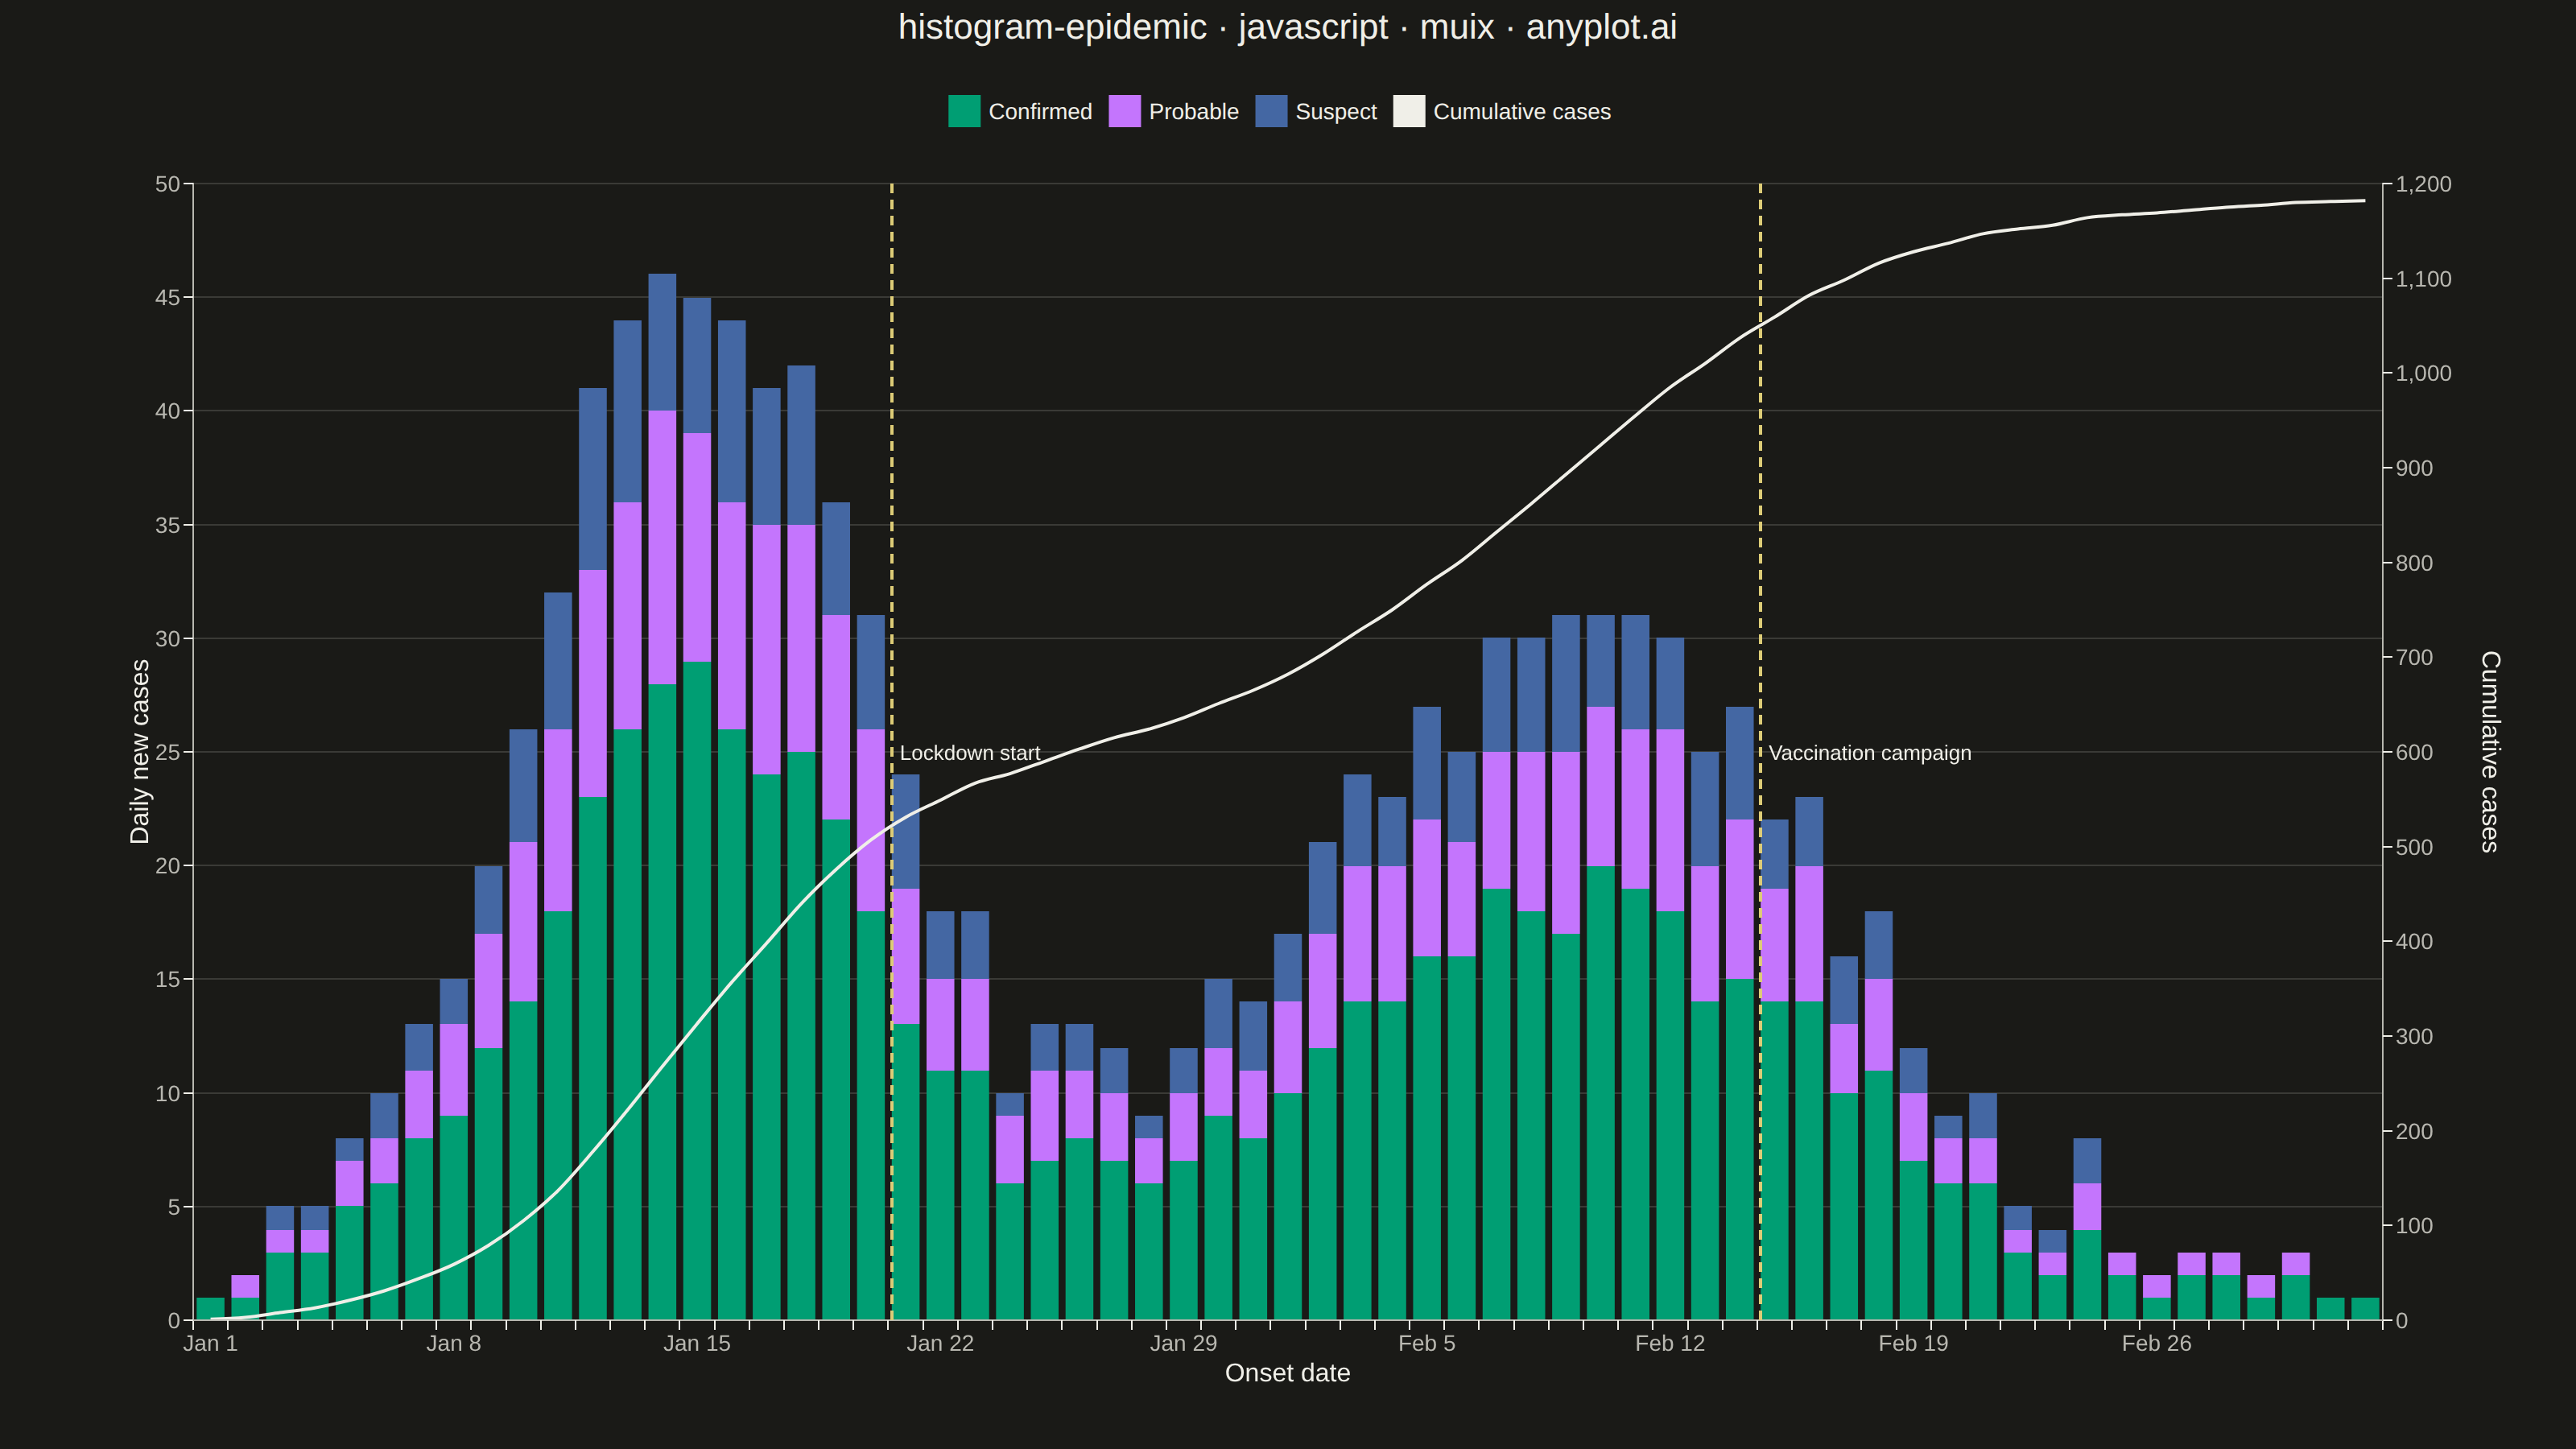
An epidemic curve (epi curve) is a histogram showing the number of new disease cases over time, plotted by date of symptom onset. The shape of the curve reveals the outbreak pattern: a sharp peak indicates a point source, successive waves suggest propagated transmission, and a plateau indicates continuous exposure. It is fundamental to epidemiological investigation and public health surveillance.
Preview render from the MUI X Charts implementation.