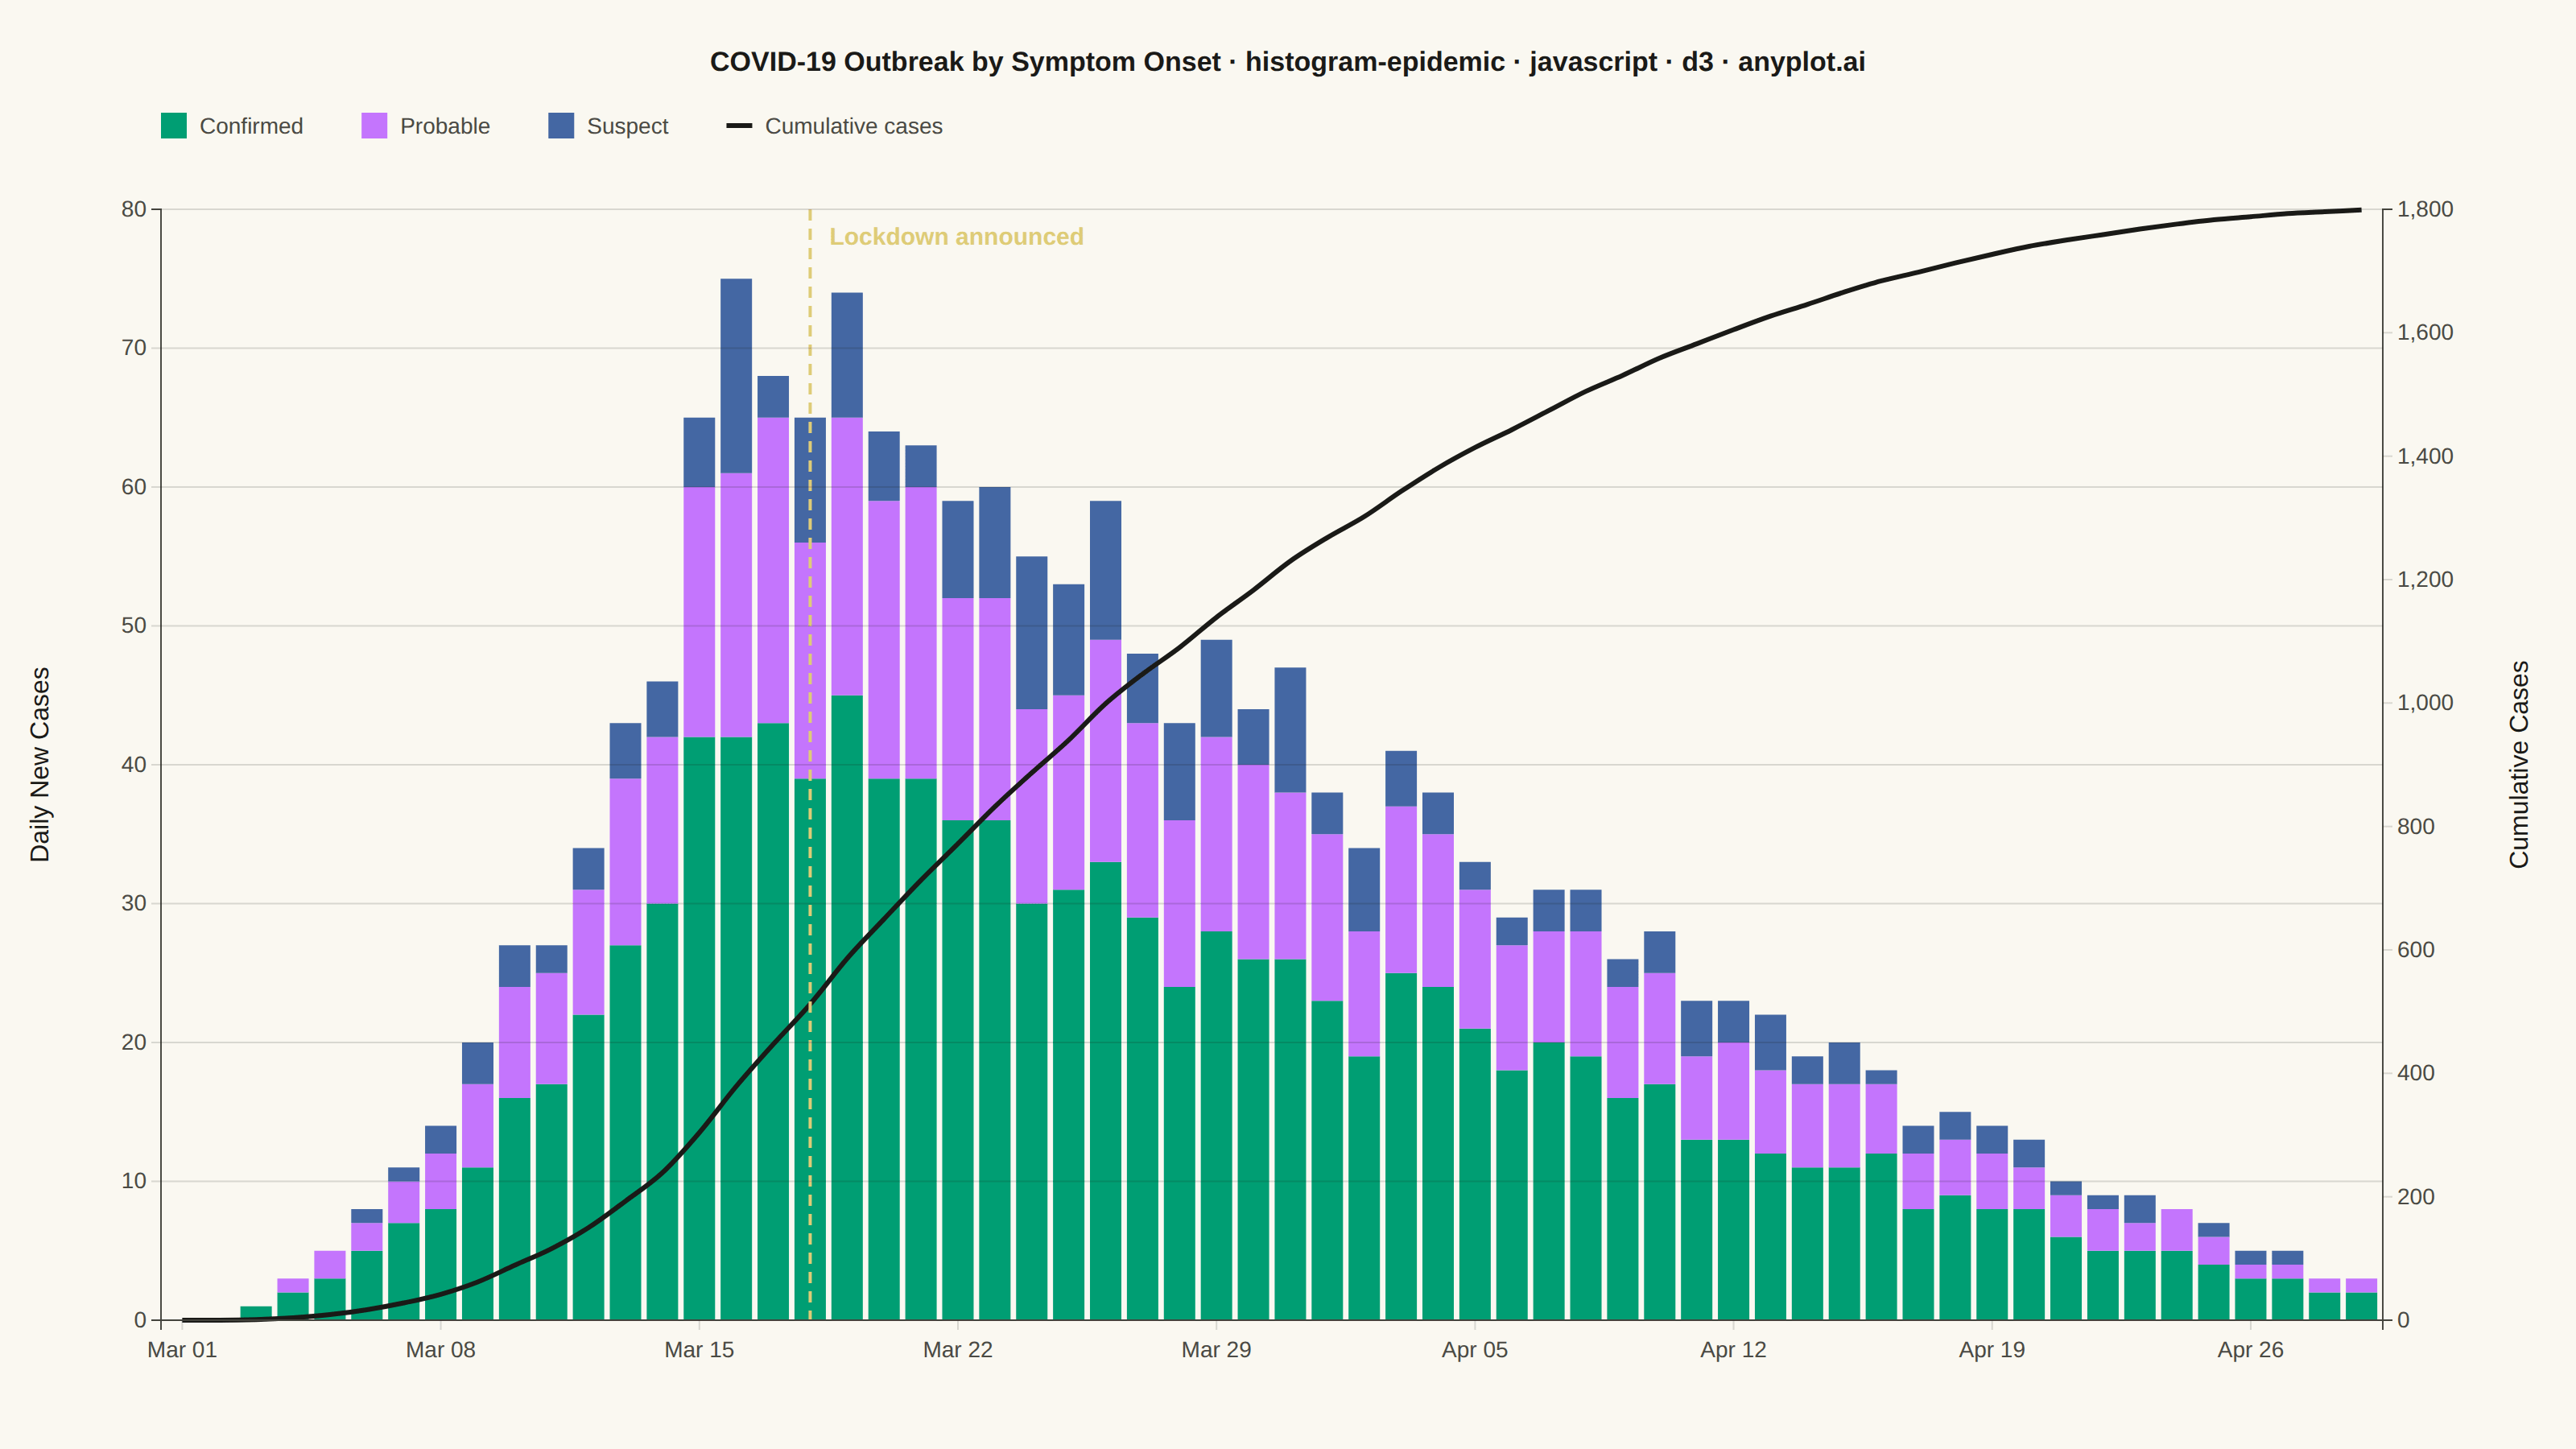
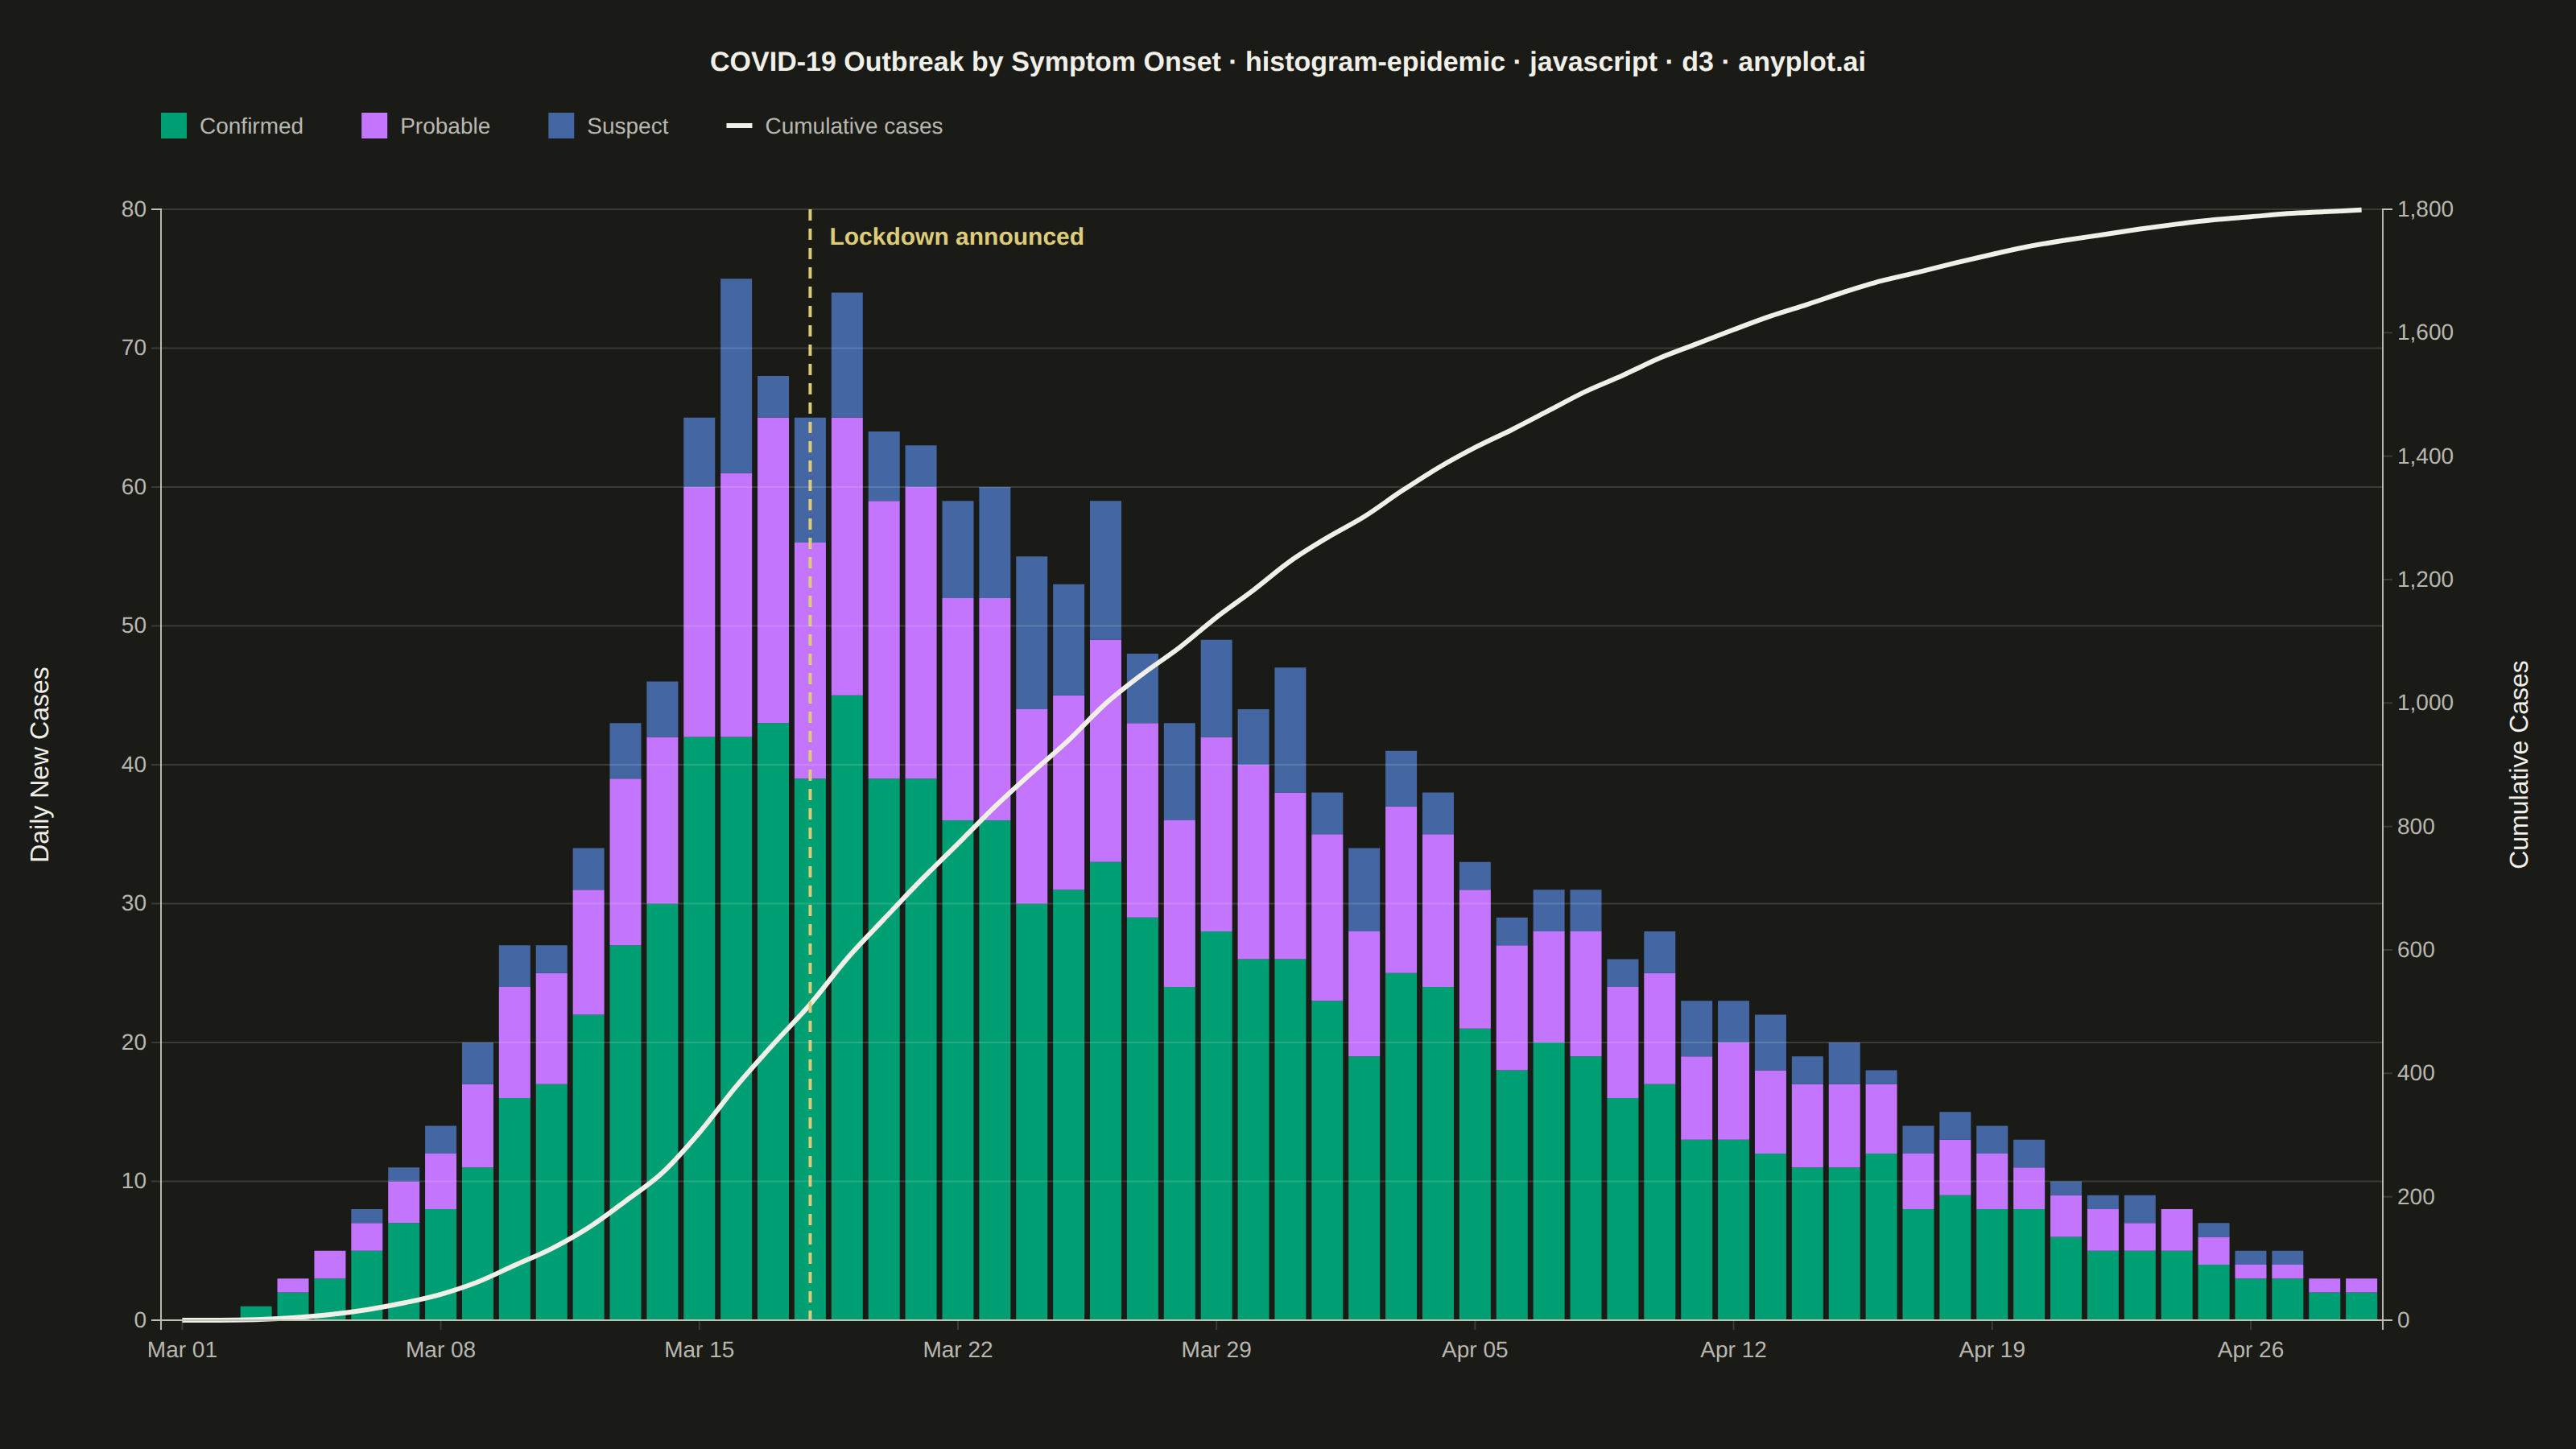
The same plot in 14 other libraries — JavaScript: Chart.js, Apache ECharts, Highcharts, MUI X Charts; Python: Altair, Bokeh, lets-plot, Matplotlib, Plotly, plotnine, Pygal, Seaborn; R: ggplot2; Julia: Makie.jl. Compare all 15 side by side: Epidemic Curve (Epi Curve) in Python, R, Julia and JavaScript.
An epidemic curve (epi curve) is a histogram showing the number of new disease cases over time, plotted by date of symptom onset. The shape of the curve reveals the outbreak pattern: a sharp peak indicates a point source, successive waves suggest propagated transmission, and a plateau indicates continuous exposure. It is fundamental to epidemiological investigation and public health surveillance.
// anyplot.ai
// histogram-epidemic: Epidemic Curve (Epi Curve)
// Library: d3 7.9.0 | JavaScript 22.23.2
// Quality: 92/100 | Created: 2026-08-26

const t = window.ANYPLOT_TOKENS;
const { width, height } = window.ANYPLOT_SIZE;
const margin = { top: 130, right: 120, bottom: 80, left: 100 };
const iw = width - margin.left - margin.right;
const ih = height - margin.top - margin.bottom;

// --- Data (in-memory, deterministic) ----------------------------------------
// Fixed-seed LCG — the browser has no seeded Math.random().
let seed = 42;
function nextRandom() {
  seed = (seed * 9301 + 49297) % 233280;
  return seed / 233280;
}

const START_DATE = new Date(Date.UTC(2024, 2, 1));
const NUM_DAYS = 60;
const LOCKDOWN_DAY = 17;
const PEAK_DAY = 15;

const days = d3.range(NUM_DAYS).map((i) => {
  const date = new Date(START_DATE);
  date.setUTCDate(date.getUTCDate() + i);

  // Gamma-shaped epidemic curve: fast rise to a peak, slower decay after the
  // lockdown intervention — typical point-source-then-controlled outbreak.
  const shape =
    i < PEAK_DAY
      ? Math.pow(i / PEAK_DAY, 2.1)
      : Math.pow(Math.max(0, 1 - (i - PEAK_DAY) / 50), 1.5);
  const base = 72 * shape;
  const noise = (nextRandom() - 0.5) * base * 0.3;
  const total = Math.max(0, Math.round(base + noise));

  const confirmedShare = 0.55 + nextRandom() * 0.1;
  const probableShare = 0.25 + nextRandom() * 0.08;
  const confirmed = Math.round(total * confirmedShare);
  const probable = Math.round(total * probableShare);
  const suspect = Math.max(0, total - confirmed - probable);

  return { date, confirmed, probable, suspect, total: confirmed + probable + suspect };
});

let runningTotal = 0;
for (const d of days) {
  runningTotal += d.total;
  d.cumulative = runningTotal;
}

const STACK_KEYS = ["confirmed", "probable", "suspect"];
const STACK_LABELS = { confirmed: "Confirmed", probable: "Probable", suspect: "Suspect" };
const seriesColor = d3.scaleOrdinal().domain(STACK_KEYS).range(t.palette.slice(0, 3));
const stackedSeries = d3.stack().keys(STACK_KEYS)(days);

// --- SVG mount ----------------------------------------------------------------
const svg = d3.select("#container").append("svg").attr("width", width).attr("height", height);
const g = svg.append("g").attr("transform", `translate(${margin.left},${margin.top})`);

// --- Scales ---------------------------------------------------------------
const x = d3
  .scaleBand()
  .domain(days.map((d) => d.date))
  .range([0, iw])
  .padding(0.15);

const y = d3
  .scaleLinear()
  .domain([0, d3.max(days, (d) => d.total)])
  .nice()
  .range([ih, 0]);

const yCumulative = d3
  .scaleLinear()
  .domain([0, d3.max(days, (d) => d.cumulative)])
  .nice()
  .range([ih, 0]);

// --- Stacked bars -----------------------------------------------------------
g.append("g")
  .selectAll("g.series")
  .data(stackedSeries)
  .join("g")
  .attr("class", "series")
  .attr("fill", (series) => seriesColor(series.key))
  .selectAll("rect")
  .data((series) => series)
  .join("rect")
  .attr("x", (d) => x(d.data.date))
  .attr("y", (d) => y(d[1]))
  .attr("width", x.bandwidth())
  .attr("height", (d) => Math.max(0, y(d[0]) - y(d[1])));

// --- Cumulative case line (secondary axis, neutral/baseline role) -----------
const cumulativeLine = d3
  .line()
  .x((d) => x(d.date) + x.bandwidth() / 2)
  .y((d) => yCumulative(d.cumulative))
  .curve(d3.curveMonotoneX);

g.append("path")
  .datum(days)
  .attr("fill", "none")
  .attr("stroke", t.ink)
  .attr("stroke-width", 3)
  .attr("d", cumulativeLine);

// --- Intervention annotation (spec explicitly requests this) ----------------
const lockdownDate = days[LOCKDOWN_DAY].date;
const lockdownX = x(lockdownDate) + x.bandwidth() / 2;

g.append("line")
  .attr("x1", lockdownX)
  .attr("x2", lockdownX)
  .attr("y1", 0)
  .attr("y2", ih)
  .attr("stroke", t.amber)
  .attr("stroke-width", 2)
  .attr("stroke-dasharray", "7,5");

g.append("text")
  .attr("x", lockdownX + 12)
  .attr("y", 22)
  .attr("fill", t.amber)
  .style("font-size", "15px")
  .style("font-weight", "600")
  .text("Lockdown announced");

// --- Axes ---------------------------------------------------------------
const tickDates = days.filter((d, i) => i % 7 === 0).map((d) => d.date);
const xAxis = g
  .append("g")
  .attr("transform", `translate(0,${ih})`)
  .call(d3.axisBottom(x).tickValues(tickDates).tickFormat(d3.timeFormat("%b %d")));

const yAxis = g.append("g").call(d3.axisLeft(y).ticks(6));

const yCumulativeAxis = g
  .append("g")
  .attr("transform", `translate(${iw},0)`)
  .call(d3.axisRight(yCumulative).ticks(6));

for (const axis of [xAxis, yAxis, yCumulativeAxis]) {
  axis.selectAll("text").attr("fill", t.inkSoft).style("font-size", "14px");
  axis.selectAll("line").attr("stroke", t.grid);
  axis.select(".domain").attr("stroke", t.inkSoft);
}
xAxis.selectAll("text").attr("dy", "1em");

g.append("g")
  .selectAll("line.grid")
  .data(y.ticks(6))
  .join("line")
  .attr("class", "grid")
  .attr("x1", 0)
  .attr("x2", iw)
  .attr("y1", (d) => y(d))
  .attr("y2", (d) => y(d))
  .attr("stroke", t.grid)
  .lower();

// --- Axis labels --------------------------------------------------------
g.append("text")
  .attr("x", -ih / 2)
  .attr("y", -70)
  .attr("transform", "rotate(-90)")
  .attr("text-anchor", "middle")
  .attr("fill", t.ink)
  .style("font-size", "16px")
  .text("Daily New Cases");

g.append("text")
  .attr("x", -ih / 2)
  .attr("y", iw + 90)
  .attr("transform", "rotate(-90)")
  .attr("text-anchor", "middle")
  .attr("fill", t.ink)
  .style("font-size", "16px")
  .text("Cumulative Cases");

// --- Legend ---------------------------------------------------------------
const legendItems = [
  ...STACK_KEYS.map((key) => ({ label: STACK_LABELS[key], color: seriesColor(key), type: "swatch" })),
  { label: "Cumulative cases", color: t.ink, type: "line" },
];
const legend = svg
  .append("g")
  .attr("transform", `translate(${margin.left},${margin.top - 60})`);
let legendX = 0;
for (const item of legendItems) {
  const entry = legend.append("g").attr("transform", `translate(${legendX},0)`);
  if (item.type === "swatch") {
    entry.append("rect").attr("width", 16).attr("height", 16).attr("fill", item.color);
  } else {
    entry
      .append("line")
      .attr("x1", 0)
      .attr("x2", 16)
      .attr("y1", 8)
      .attr("y2", 8)
      .attr("stroke", item.color)
      .attr("stroke-width", 3);
  }
  const label = entry
    .append("text")
    .attr("x", 24)
    .attr("y", 13)
    .attr("fill", t.inkSoft)
    .style("font-size", "14px")
    .text(item.label);
  legendX += 24 + label.node().getComputedTextLength() + 36;
}

// --- Title ------------------------------------------------------------------
const TITLE = "COVID-19 Outbreak by Symptom Onset · histogram-epidemic · javascript · d3 · anyplot.ai";
const TITLE_FONT_SIZE = Math.max(15, Math.round(22 * Math.min(1, 67 / TITLE.length)));

svg
  .append("text")
  .attr("x", width / 2)
  .attr("y", 44)
  .attr("text-anchor", "middle")
  .attr("fill", t.ink)
  .style("font-size", `${TITLE_FONT_SIZE}px`)
  .style("font-weight", "600")
  .text(TITLE);
Runnable source as JSON, for any HTTP client: https://api.anyplot.ai/specs/histogram-epidemic/d3/code. Any spec id and library id listed in llms-full.txt fit the same URL shape; every URL below is complete and callable.
{
  "spec_id": "histogram-epidemic",
  "language": "javascript",
  "library": "d3",
  "page": "https://anyplot.ai/histogram-epidemic/javascript/d3",
  "hub": "https://anyplot.ai/histogram-epidemic",
  "code_json": "https://api.anyplot.ai/specs/histogram-epidemic/d3/code",
  "spec_json": "https://api.anyplot.ai/specs/histogram-epidemic",
  "render_light_png": "https://storage.googleapis.com/anyplot-images/plots/histogram-epidemic/javascript/d3/plot-light.png",
  "render_dark_png": "https://storage.googleapis.com/anyplot-images/plots/histogram-epidemic/javascript/d3/plot-dark.png",
  "interactive_light_html": "https://storage.googleapis.com/anyplot-images/plots/histogram-epidemic/javascript/d3/plot-light.html",
  "interactive_dark_html": "https://storage.googleapis.com/anyplot-images/plots/histogram-epidemic/javascript/d3/plot-dark.html",
  "quality_score": 92.0,
  "license": "MIT",
  "guide": "https://anyplot.ai/llms.txt"
}
Part of Epidemic Curve (Epi Curve) on anyplot.ai.