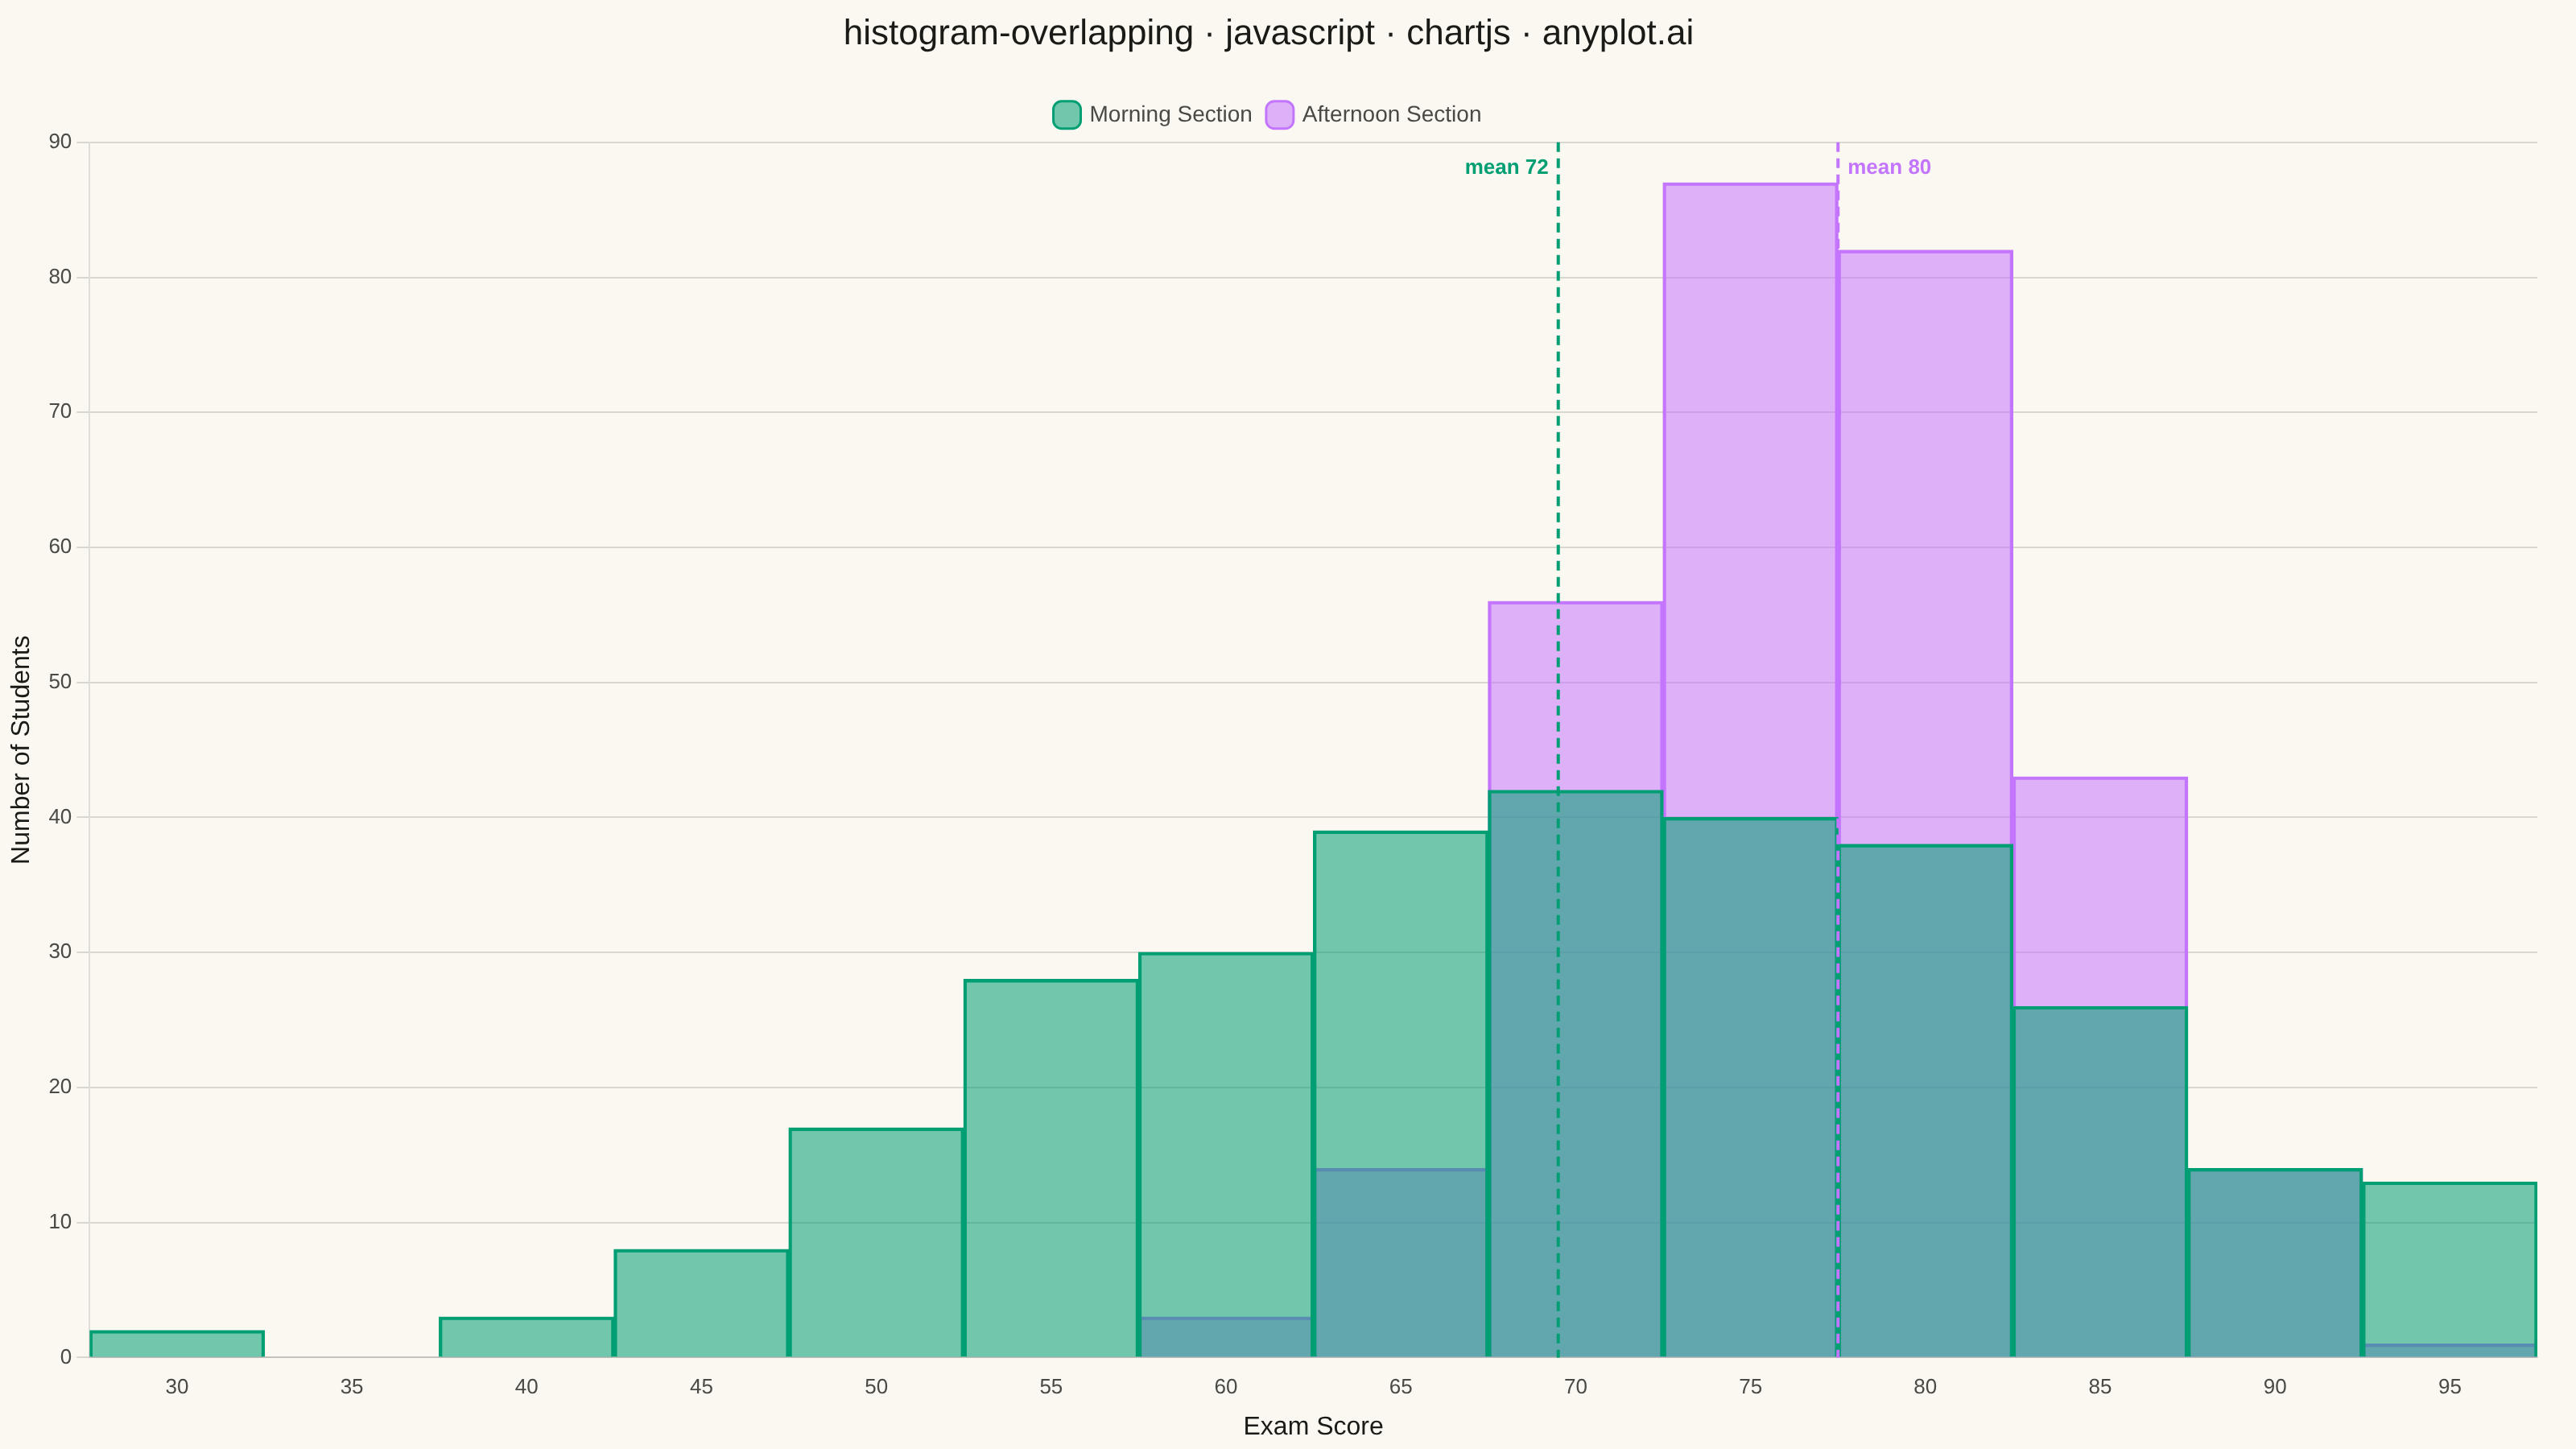
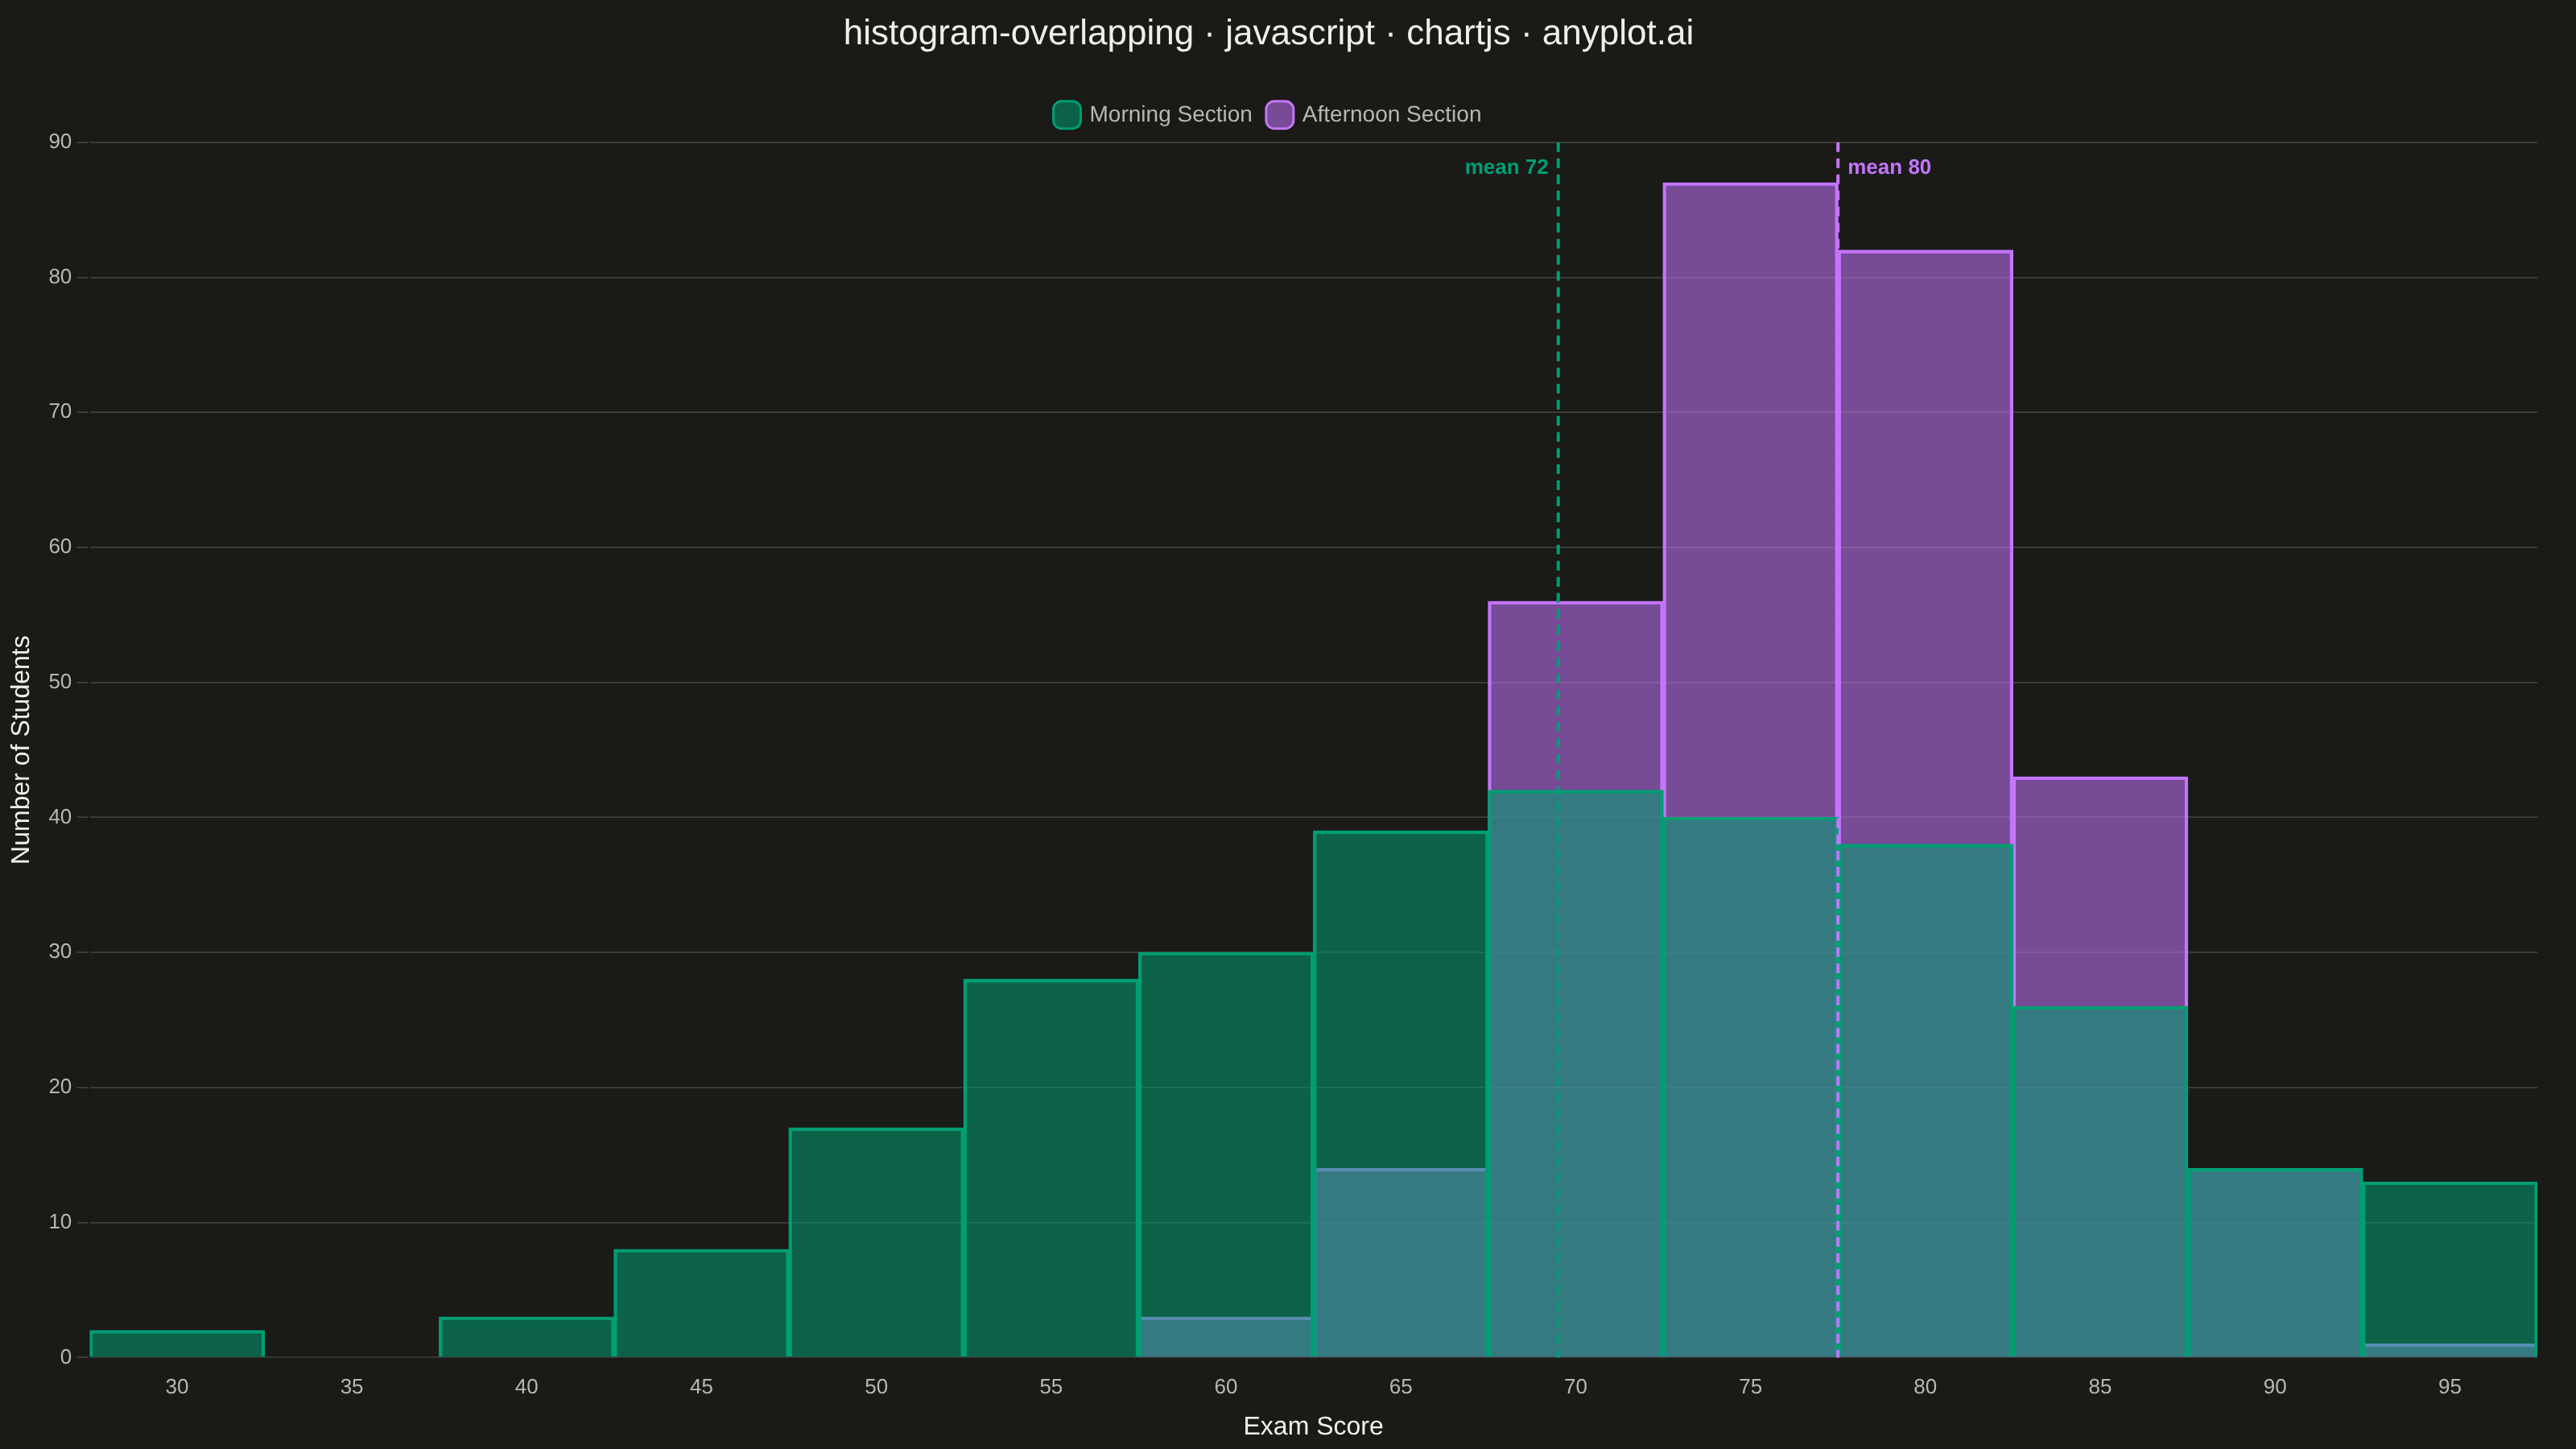
Overlapping histograms display multiple distributions on the same axes using semi-transparent bars, enabling direct visual comparison between groups. This technique reveals differences in central tendency, spread, and shape across categories while maintaining the familiar histogram format. The transparency allows viewers to see where distributions overlap and diverge.
Preview render from the Chart.js implementation.