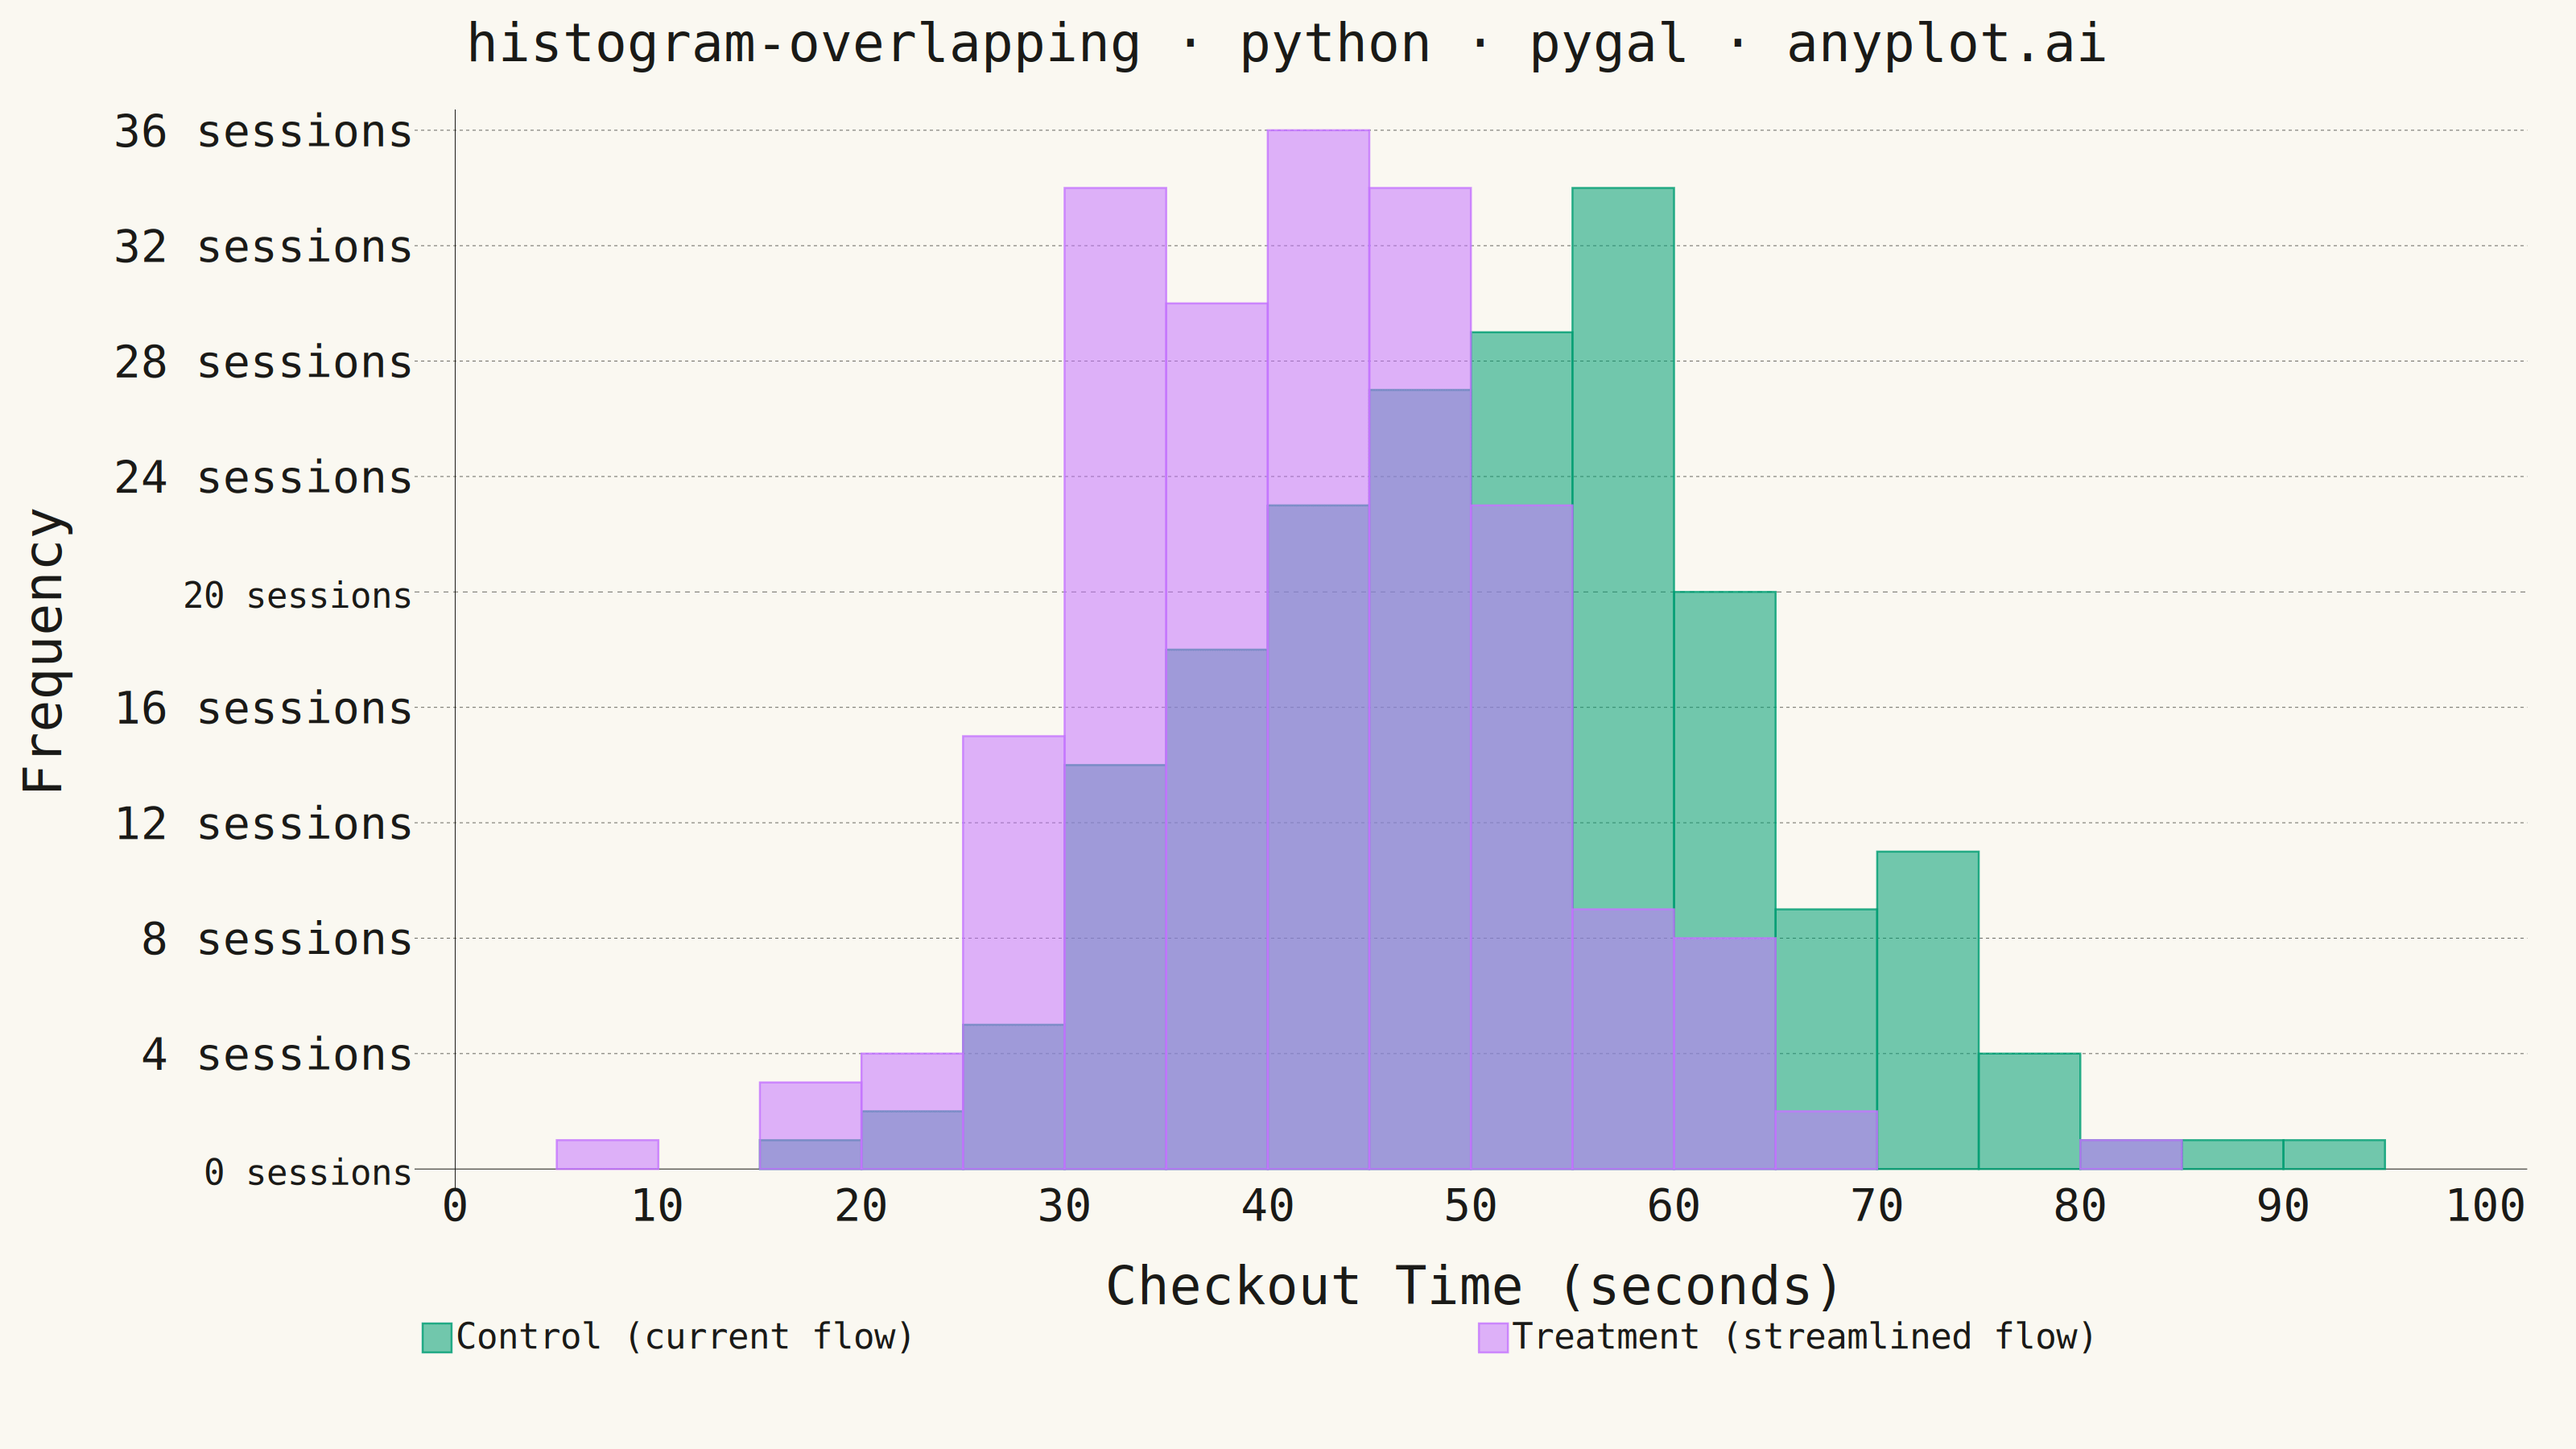
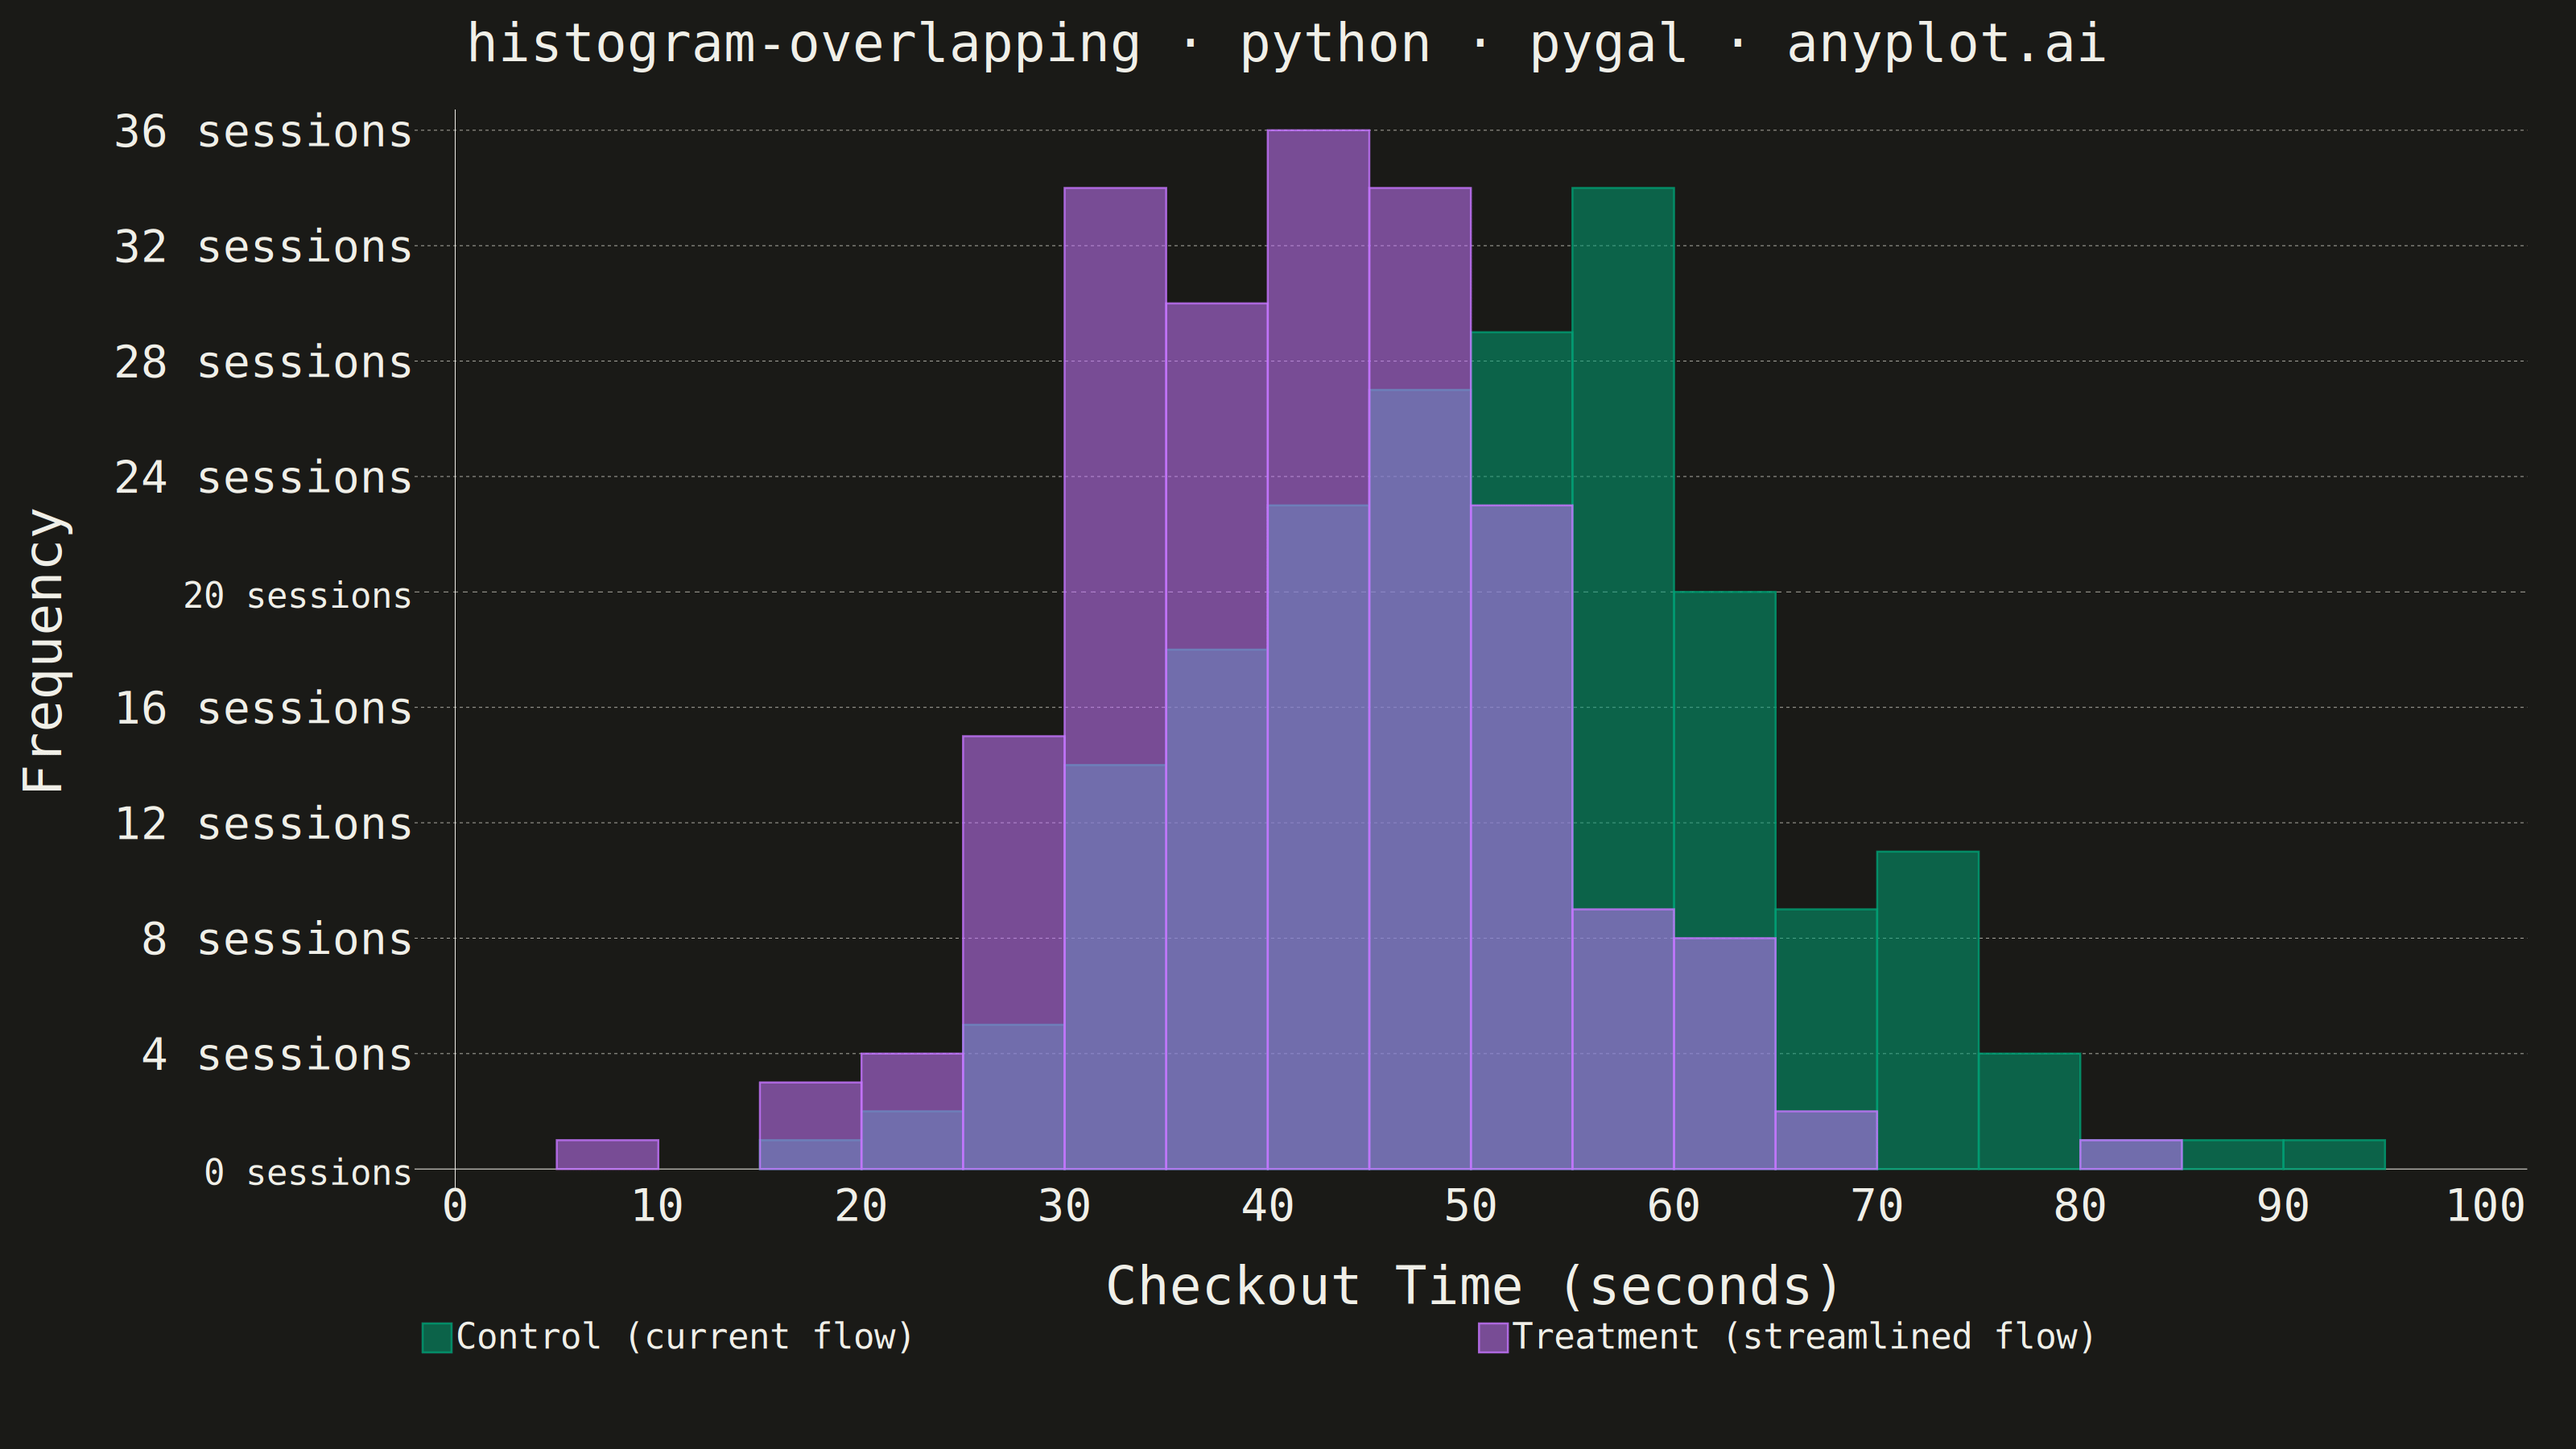
Overlapping histograms display multiple distributions on the same axes using semi-transparent bars, enabling direct visual comparison between groups. This technique reveals differences in central tendency, spread, and shape across categories while maintaining the familiar histogram format. The transparency allows viewers to see where distributions overlap and diverge.
""" anyplot.ai
histogram-overlapping: Overlapping Histograms
Library: pygal 3.1.3 | Python 3.13.15
Quality: 91/100 | Updated: 2026-08-18
"""

import os
import sys


sys.path = [p for p in sys.path if not p.endswith("python")]

import numpy as np
import pygal
from pygal.style import Style


# Theme tokens (see prompts/default-style-guide.md "Background" + "Theme-adaptive Chrome")
THEME = os.getenv("ANYPLOT_THEME", "light")
PAGE_BG = "#FAF8F1" if THEME == "light" else "#1A1A17"
INK = "#1A1A17" if THEME == "light" else "#F0EFE8"
INK_MUTED = "#6B6A63" if THEME == "light" else "#A8A79F"

# Imprint categorical palette — first series is always brand green
IMPRINT_PALETTE = ("#009E73", "#C475FD", "#4467A3", "#BD8233", "#AE3030", "#2ABCCD", "#954477", "#99B314")

# Data - checkout completion time (seconds) for an A/B test on a streamlined
# checkout flow. Control keeps the current multi-step form; Treatment trims it
# to one page. Times are clipped at 5s — a real checkout can't complete faster.
np.random.seed(42)
control_times = np.clip(np.random.normal(52, 14, 200), 5, None)
treatment_times = np.clip(np.random.normal(41, 11, 200), 5, None)

# Histogram parameters - shared bin edges for a fair overlap comparison
bin_min = 0
bin_max = 100
n_bins = 20
bin_edges = np.linspace(bin_min, bin_max, n_bins + 1)

# Pygal Histogram expects tuples of (count, start, end)
hist_control, _ = np.histogram(control_times, bins=bin_edges)
hist_treatment, _ = np.histogram(treatment_times, bins=bin_edges)

control_data = [(int(count), float(bin_edges[i]), float(bin_edges[i + 1])) for i, count in enumerate(hist_control)]
treatment_data = [(int(count), float(bin_edges[i]), float(bin_edges[i + 1])) for i, count in enumerate(hist_treatment)]

# Mean shift, worked into the legend labels below, tells the A/B story at a glance
control_mean = float(control_times.mean())
treatment_mean = float(treatment_times.mean())

# Style — theme-adaptive chrome, Imprint palette, sizing tuned for 3200x1800
custom_style = Style(
    background=PAGE_BG,
    plot_background=PAGE_BG,
    foreground=INK,
    foreground_strong=INK,
    foreground_subtle=INK_MUTED,
    # pygal's graph.css ships guide_stroke_color="black" and layers it over
    # style.css's foreground_subtle rule for the same selector, so gridlines
    # render pure black regardless of theme unless overridden here — nearly
    # invisible against the near-black dark-theme background.
    guide_stroke_color=INK_MUTED,
    major_guide_stroke_color=INK_MUTED,
    opacity=0.55,
    opacity_hover=0.75,
    colors=IMPRINT_PALETTE,
    title_font_size=66,
    label_font_size=56,
    major_label_font_size=44,
    legend_font_size=44,
    value_font_size=36,
    stroke_width=2.5,
)

# Chart — semi-transparent overlapping bars on shared bins, y-axis grid only,
# bottom legend to keep the plot area uncluttered.
chart = pygal.Histogram(
    width=3200,
    height=1800,
    style=custom_style,
    title="histogram-overlapping · python · pygal · anyplot.ai",
    x_title="Checkout Time (seconds)",
    y_title="Frequency",
    show_legend=True,
    legend_at_bottom=True,
    legend_box_size=36,
    show_y_guides=True,
    show_x_guides=False,
    x_label_rotation=0,
    margin=60,
    value_formatter=lambda x: f"{x:.0f}",
    tooltip_border_radius=10,
    tooltip_fancy_mode=True,
    rounded_bars=4,
    # Pygal-native interactivity: counts stay hidden in the static PNG and
    # reveal per-bar on hover in the exported HTML, instead of a plain tooltip.
    print_values=True,
    dynamic_print_values=True,
    print_values_position="top",
)

# Add data series - mean shift folded into the legend labels tells the A/B
# story directly (Treatment moves the mean ~21% faster than Control)
chart.add(f"Control (current flow, mean {control_mean:.0f}s)", control_data)
chart.add(f"Treatment (streamlined flow, mean {treatment_mean:.0f}s)", treatment_data)

# Save outputs
chart.render_to_png(f"plot-{THEME}.png")
with open(f"plot-{THEME}.html", "wb") as f:
    f.write(chart.render())
Runnable source as JSON, for any HTTP client: https://api.anyplot.ai/specs/histogram-overlapping/pygal/code. Any spec id and library id listed in llms-full.txt fit the same URL shape; every URL below is complete and callable.
{
  "spec_id": "histogram-overlapping",
  "language": "python",
  "library": "pygal",
  "page": "https://anyplot.ai/histogram-overlapping/python/pygal",
  "hub": "https://anyplot.ai/histogram-overlapping",
  "code_json": "https://api.anyplot.ai/specs/histogram-overlapping/pygal/code",
  "spec_json": "https://api.anyplot.ai/specs/histogram-overlapping",
  "render_light_png": "https://storage.googleapis.com/anyplot-images/plots/histogram-overlapping/python/pygal/plot-light.png",
  "render_dark_png": "https://storage.googleapis.com/anyplot-images/plots/histogram-overlapping/python/pygal/plot-dark.png",
  "interactive_light_html": "https://storage.googleapis.com/anyplot-images/plots/histogram-overlapping/python/pygal/plot-light.html",
  "interactive_dark_html": "https://storage.googleapis.com/anyplot-images/plots/histogram-overlapping/python/pygal/plot-dark.html",
  "quality_score": 91.0,
  "license": "MIT",
  "guide": "https://anyplot.ai/llms.txt"
}
Part of Overlapping Histograms on anyplot.ai.