The same plot in 14 other libraries — JavaScript: Chart.js, Apache ECharts, Highcharts, MUI X Charts; Python: Altair, Bokeh, lets-plot, Matplotlib, Plotly, plotnine, Pygal, Seaborn; R: ggplot2; Julia: Makie.jl. Compare all 15 side by side: Overlapping Histograms in Python, R, Julia and JavaScript.
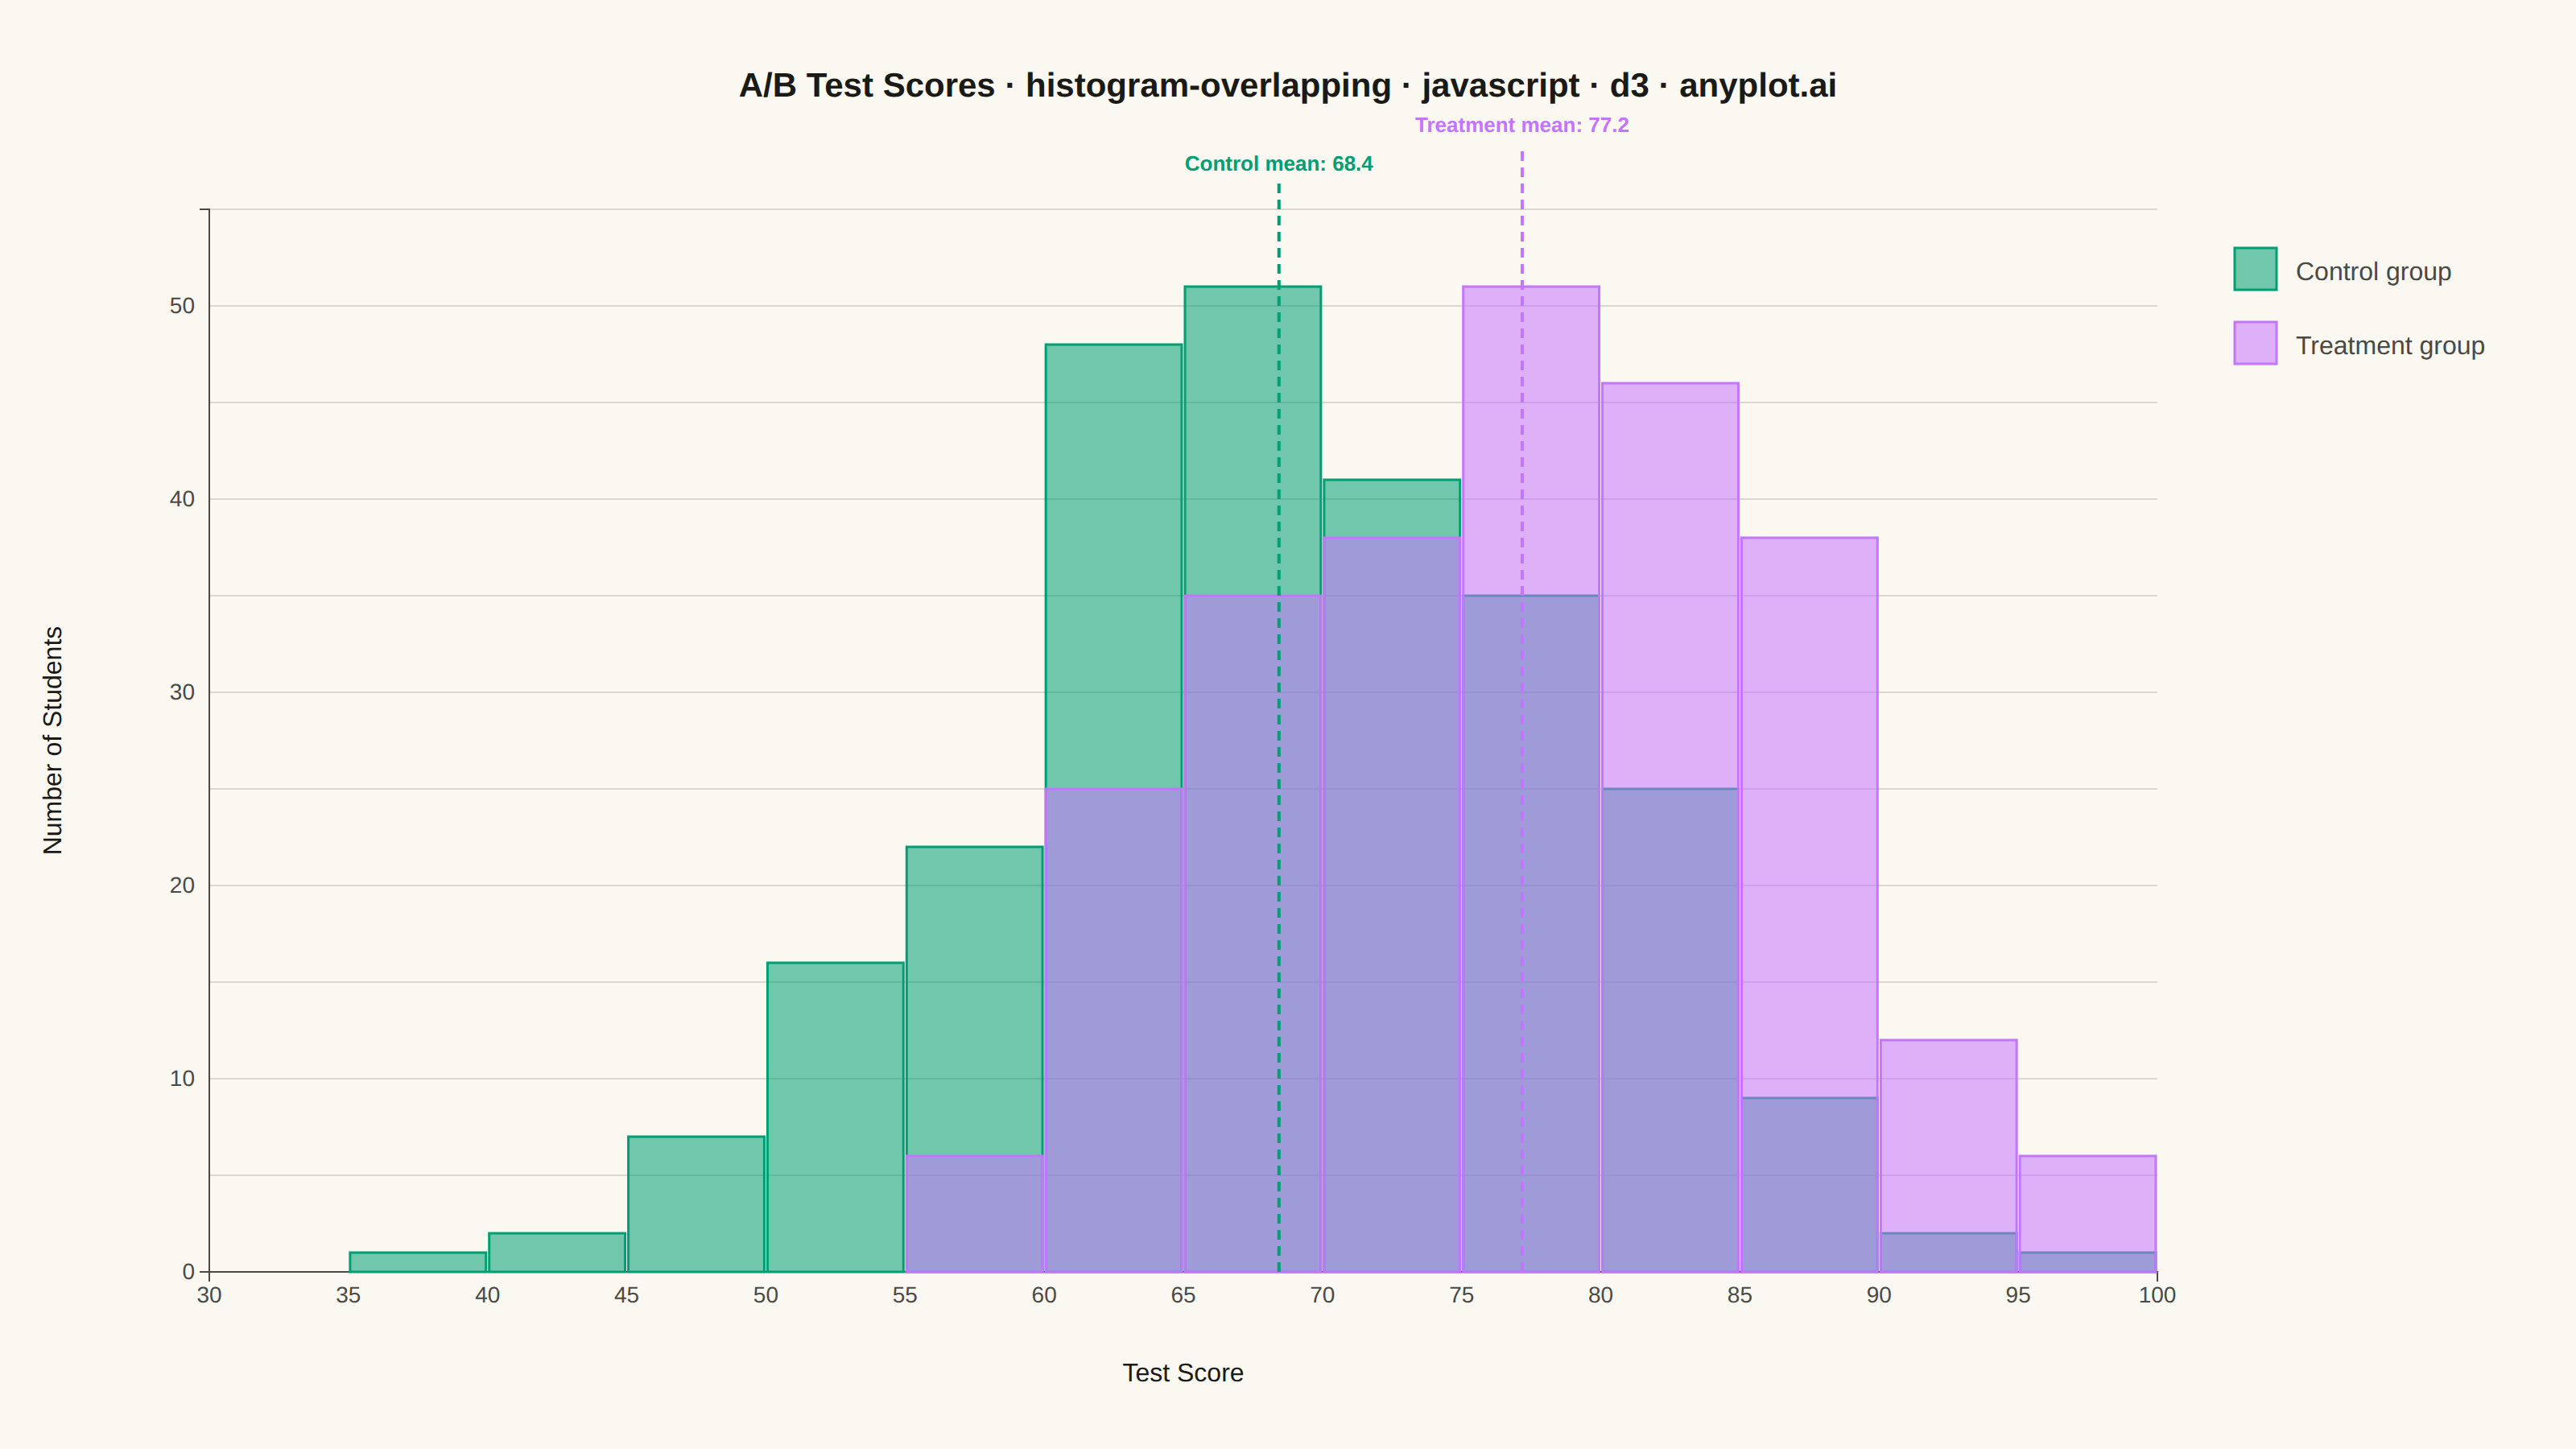
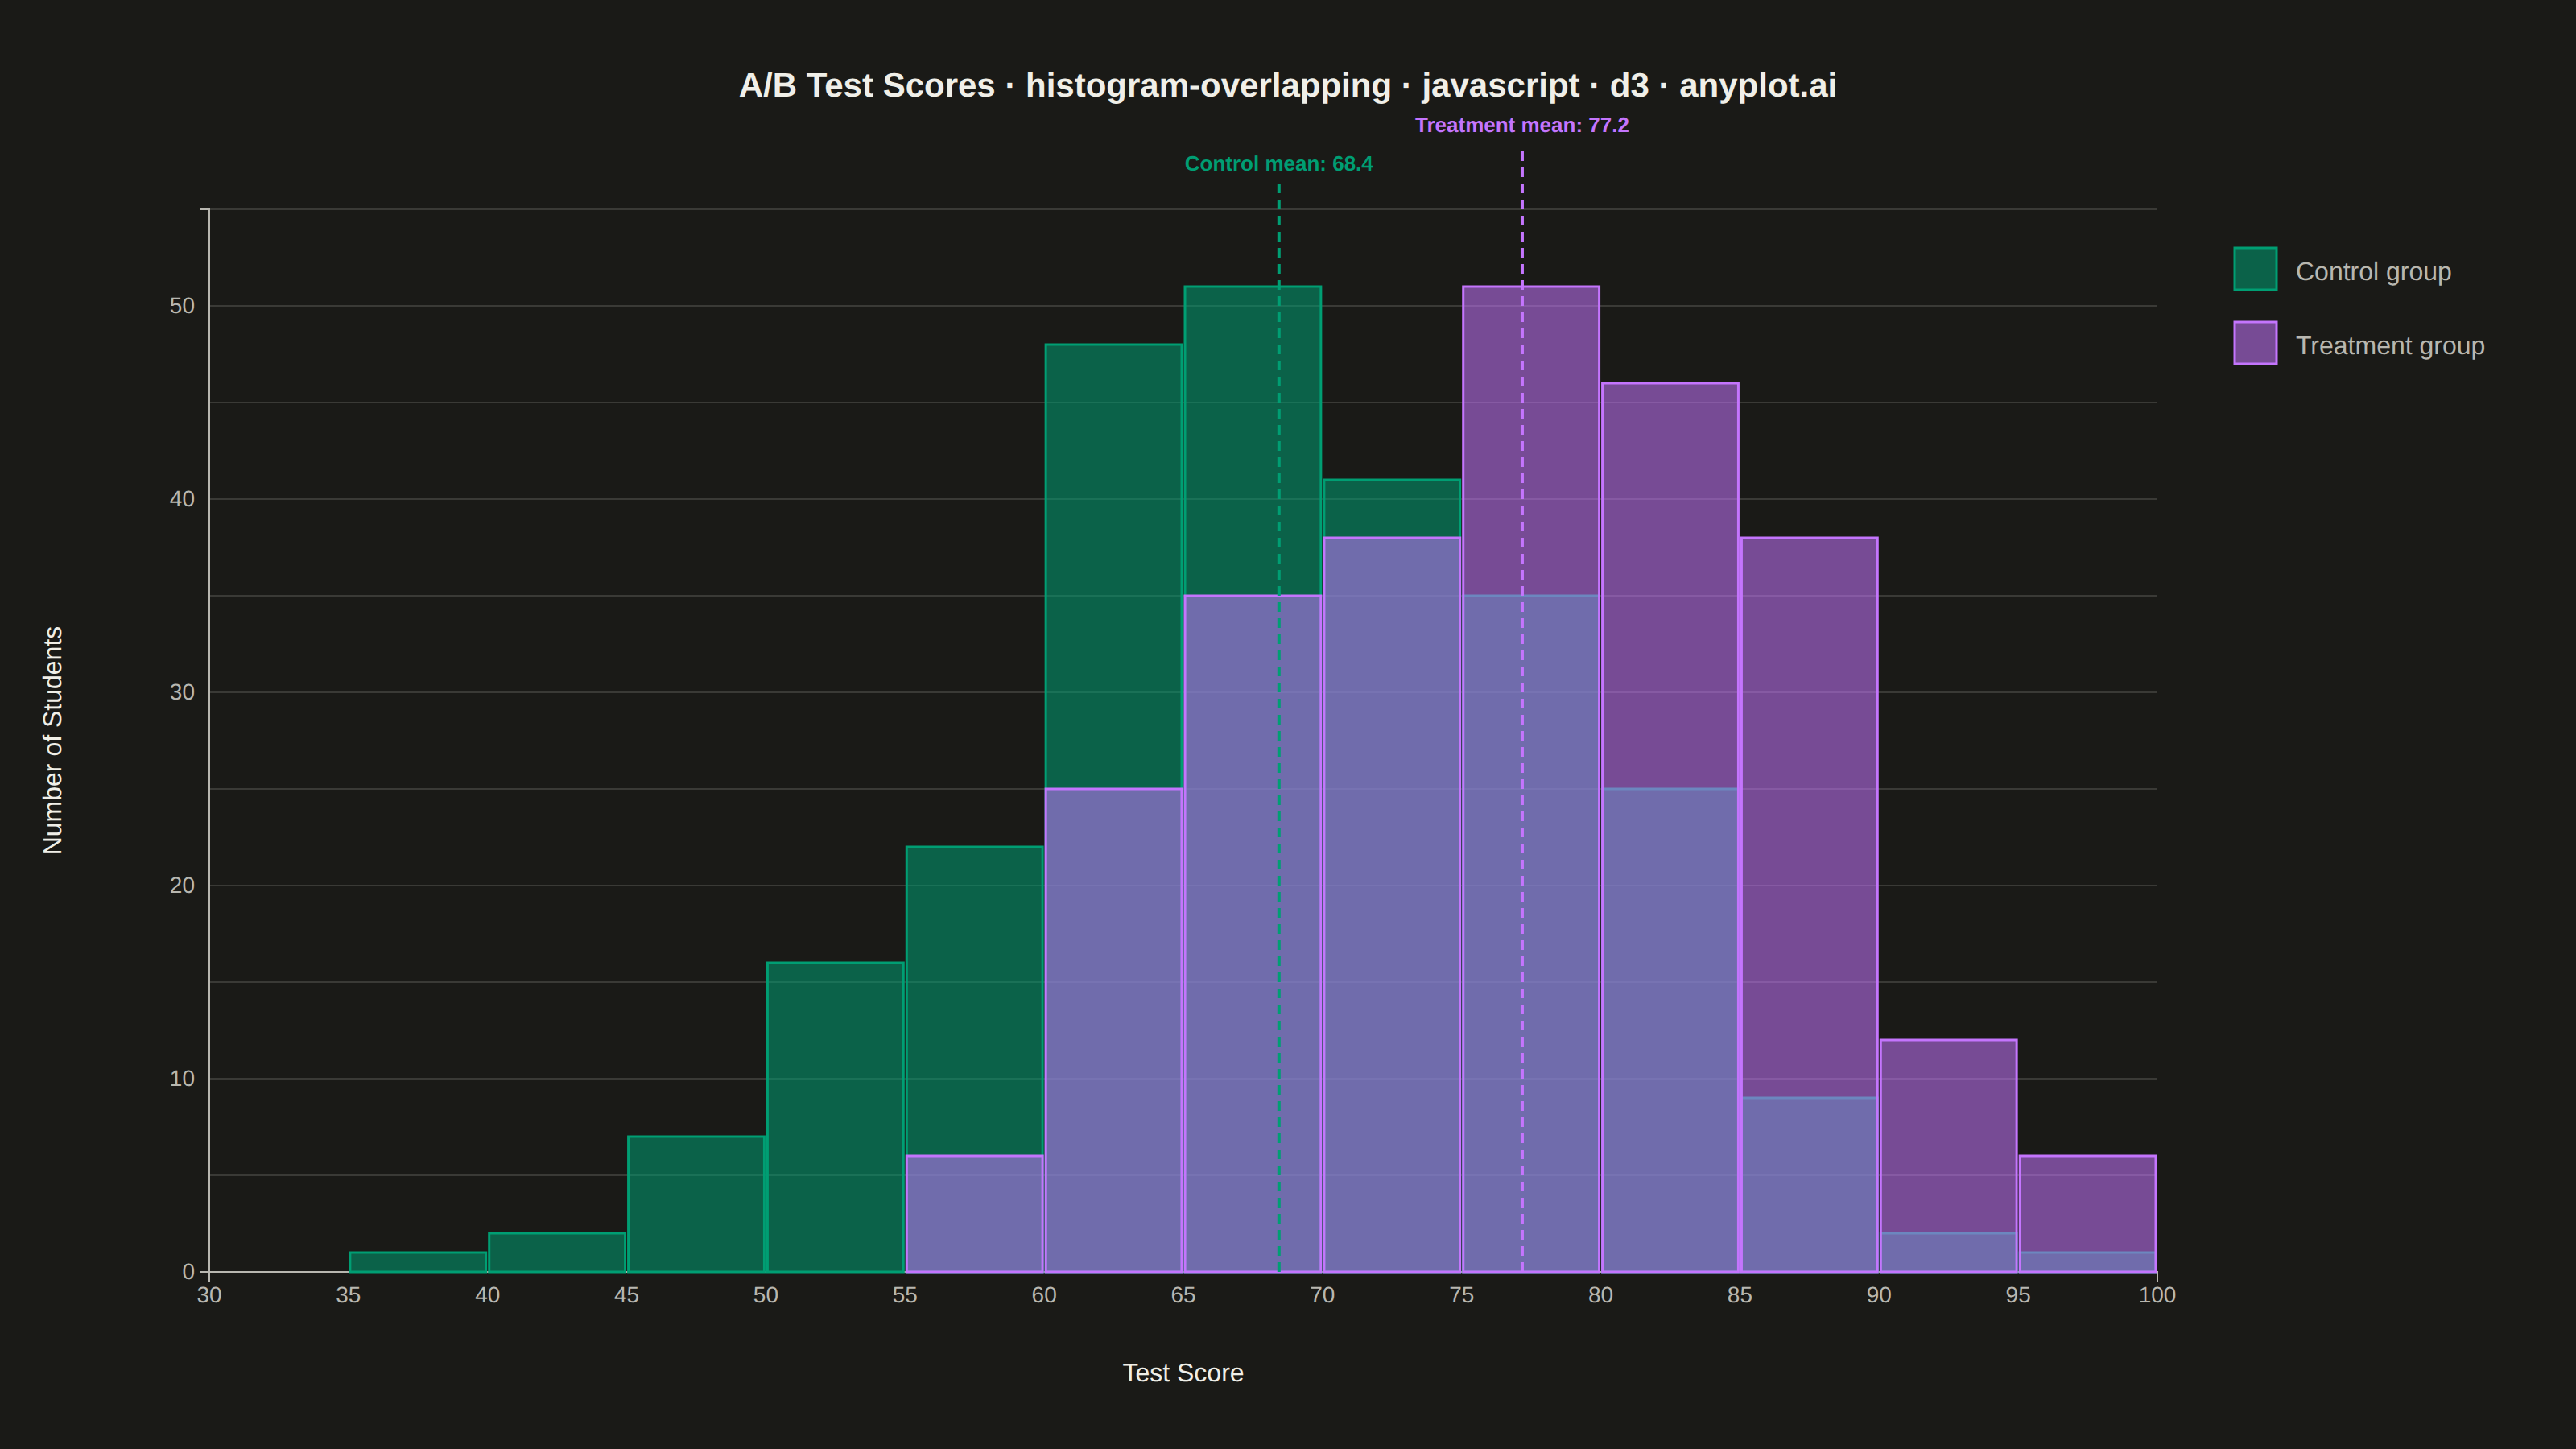
Overlapping histograms display multiple distributions on the same axes using semi-transparent bars, enabling direct visual comparison between groups. This technique reveals differences in central tendency, spread, and shape across categories while maintaining the familiar histogram format. The transparency allows viewers to see where distributions overlap and diverge.
// anyplot.ai
// histogram-overlapping: Overlapping Histograms
// Library: d3 7.9.0 | JavaScript 22.23.2
// Quality: 88/100 | Created: 2026-08-18

const t = window.ANYPLOT_TOKENS;
const { width, height } = window.ANYPLOT_SIZE;
const margin = { top: 130, right: 260, bottom: 110, left: 130 };
const iw = width - margin.left - margin.right;
const ih = height - margin.top - margin.bottom;

// --- Data (in-memory, deterministic LCG) ------------------------------------
function makeLcg(seed) {
  let state = seed;
  return () => {
    state = (state * 1664525 + 1013904223) % 4294967296;
    return state / 4294967296;
  };
}

function randomNormal(rng, mean, sd) {
  const u1 = Math.max(rng(), 1e-9);
  const u2 = rng();
  const z = Math.sqrt(-2 * Math.log(u1)) * Math.cos(2 * Math.PI * u2);
  return mean + z * sd;
}

const rng = makeLcg(42);
const groups = [
  { label: "Control group", mean: 68, sd: 11, n: 260 },
  { label: "Treatment group", mean: 78, sd: 10, n: 260 },
];

const records = [];
for (const grp of groups) {
  for (let i = 0; i < grp.n; i++) {
    const score = Math.min(100, Math.max(0, randomNormal(rng, grp.mean, grp.sd)));
    records.push({ group: grp.label, value: score });
  }
}

// --- Shared bins across both groups, tightened to the actual data range -----
const allValues = records.map((d) => d.value);
const [dataMin, dataMax] = d3.extent(allValues);
const binWidth = 5;
const domainMin = Math.max(0, Math.floor(dataMin / binWidth) * binWidth - binWidth);
const domainMax = Math.min(100, Math.ceil(dataMax / binWidth) * binWidth);
const binCount = Math.round((domainMax - domainMin) / binWidth);
const binner = d3
  .bin()
  .domain([domainMin, domainMax])
  .thresholds(d3.range(binCount + 1).map((i) => domainMin + i * binWidth));

const binsByGroup = groups.map((grp) => ({
  label: grp.label,
  bins: binner(records.filter((d) => d.group === grp.label).map((d) => d.value)),
}));

const maxCount = d3.max(binsByGroup.flatMap((g) => g.bins.map((b) => b.length)));

// --- SVG mount ----------------------------------------------------------------
const svg = d3.select("#container").append("svg").attr("width", width).attr("height", height);
const g = svg.append("g").attr("transform", `translate(${margin.left},${margin.top})`);

// --- Scales ---------------------------------------------------------------
const x = d3.scaleLinear().domain([domainMin, domainMax]).range([0, iw]);
const y = d3.scaleLinear().domain([0, maxCount]).nice().range([ih, 0]);
const color = d3.scaleOrdinal().domain(groups.map((grp) => grp.label)).range(t.palette);

// --- Gridlines (y-axis only) ---------------------------------------------
g.append("g")
  .attr("class", "grid")
  .call(d3.axisLeft(y).tickSize(-iw).tickFormat(""))
  .call((sel) => sel.select(".domain").remove())
  .selectAll("line")
  .attr("stroke", t.grid);

// --- Axes -----------------------------------------------------------------
const xAxis = g
  .append("g")
  .attr("transform", `translate(0,${ih})`)
  .call(d3.axisBottom(x).ticks(10));
const yAxis = g.append("g").call(d3.axisLeft(y).ticks(6));
for (const ax of [xAxis, yAxis]) {
  ax.selectAll("text").attr("fill", t.inkSoft).style("font-size", "14px");
  ax.selectAll("line").attr("stroke", t.grid);
  ax.select(".domain").attr("stroke", t.inkSoft);
}
xAxis.selectAll(".tick line").remove();
yAxis.selectAll(".tick line").remove();

// --- Overlapping histogram bars --------------------------------------------
for (const grp of binsByGroup) {
  g.append("g")
    .selectAll("rect")
    .data(grp.bins)
    .join("rect")
    .attr("x", (d) => x(d.x0) + 1)
    .attr("y", (d) => y(d.length))
    .attr("width", (d) => Math.max(0, x(d.x1) - x(d.x0) - 2))
    .attr("height", (d) => ih - y(d.length))
    .attr("fill", color(grp.label))
    .attr("fill-opacity", 0.55)
    .attr("stroke", color(grp.label))
    .attr("stroke-width", 1.5);
}

// --- Mean markers (data storytelling: highlights the Treatment-group shift) -
const meansByGroup = groups.map((grp) => ({
  label: grp.label,
  mean: d3.mean(
    records.filter((d) => d.group === grp.label),
    (d) => d.value
  ),
}));
const meanLine = d3.line();
meansByGroup.forEach((gm, i) => {
  const mx = x(gm.mean);
  const topY = -(16 + (i % 2) * 24);
  g.append("path")
    .attr("d", meanLine([[mx, ih], [mx, topY]]))
    .attr("fill", "none")
    .attr("stroke", color(gm.label))
    .attr("stroke-width", 2)
    .attr("stroke-dasharray", "6,4");
  g.append("text")
    .attr("x", mx)
    .attr("y", topY - 8)
    .attr("text-anchor", "middle")
    .attr("fill", color(gm.label))
    .style("font-size", "13px")
    .style("font-weight", "600")
    .text(`${gm.label.replace(" group", "")} mean: ${gm.mean.toFixed(1)}`);
});

// --- Axis labels -------------------------------------------------------------
g.append("text")
  .attr("x", iw / 2)
  .attr("y", ih + 68)
  .attr("text-anchor", "middle")
  .attr("fill", t.ink)
  .style("font-size", "16px")
  .text("Test Score");

g.append("text")
  .attr("transform", "rotate(-90)")
  .attr("x", -ih / 2)
  .attr("y", -92)
  .attr("text-anchor", "middle")
  .attr("fill", t.ink)
  .style("font-size", "16px")
  .text("Number of Students");

// --- Legend ------------------------------------------------------------------
const legend = svg
  .append("g")
  .attr("transform", `translate(${margin.left + iw + 48},${margin.top + 24})`);

groups.forEach((grp, i) => {
  const row = legend.append("g").attr("transform", `translate(0,${i * 46})`);
  row
    .append("rect")
    .attr("width", 26)
    .attr("height", 26)
    .attr("fill", color(grp.label))
    .attr("fill-opacity", 0.55)
    .attr("stroke", color(grp.label))
    .attr("stroke-width", 1.5);
  row
    .append("text")
    .attr("x", 38)
    .attr("y", 20)
    .attr("fill", t.inkSoft)
    .style("font-size", "16px")
    .text(grp.label);
});

// --- Title ------------------------------------------------------------------
const title = "A/B Test Scores · histogram-overlapping · javascript · d3 · anyplot.ai";
svg
  .append("text")
  .attr("x", width / 2)
  .attr("y", 60)
  .attr("text-anchor", "middle")
  .attr("fill", t.ink)
  .style("font-size", `${Math.round(22 * Math.min(1, 67 / title.length))}px`)
  .style("font-weight", "600")
  .text(title);
Runnable source as JSON, for any HTTP client: https://api.anyplot.ai/specs/histogram-overlapping/d3/code. Any spec id and library id listed in llms-full.txt fit the same URL shape; every URL below is complete and callable.
{
  "spec_id": "histogram-overlapping",
  "language": "javascript",
  "library": "d3",
  "page": "https://anyplot.ai/histogram-overlapping/javascript/d3",
  "hub": "https://anyplot.ai/histogram-overlapping",
  "code_json": "https://api.anyplot.ai/specs/histogram-overlapping/d3/code",
  "spec_json": "https://api.anyplot.ai/specs/histogram-overlapping",
  "render_light_png": "https://storage.googleapis.com/anyplot-images/plots/histogram-overlapping/javascript/d3/plot-light.png",
  "render_dark_png": "https://storage.googleapis.com/anyplot-images/plots/histogram-overlapping/javascript/d3/plot-dark.png",
  "interactive_light_html": "https://storage.googleapis.com/anyplot-images/plots/histogram-overlapping/javascript/d3/plot-light.html",
  "interactive_dark_html": "https://storage.googleapis.com/anyplot-images/plots/histogram-overlapping/javascript/d3/plot-dark.html",
  "quality_score": 88.0,
  "license": "MIT",
  "guide": "https://anyplot.ai/llms.txt"
}
Part of Overlapping Histograms on anyplot.ai.