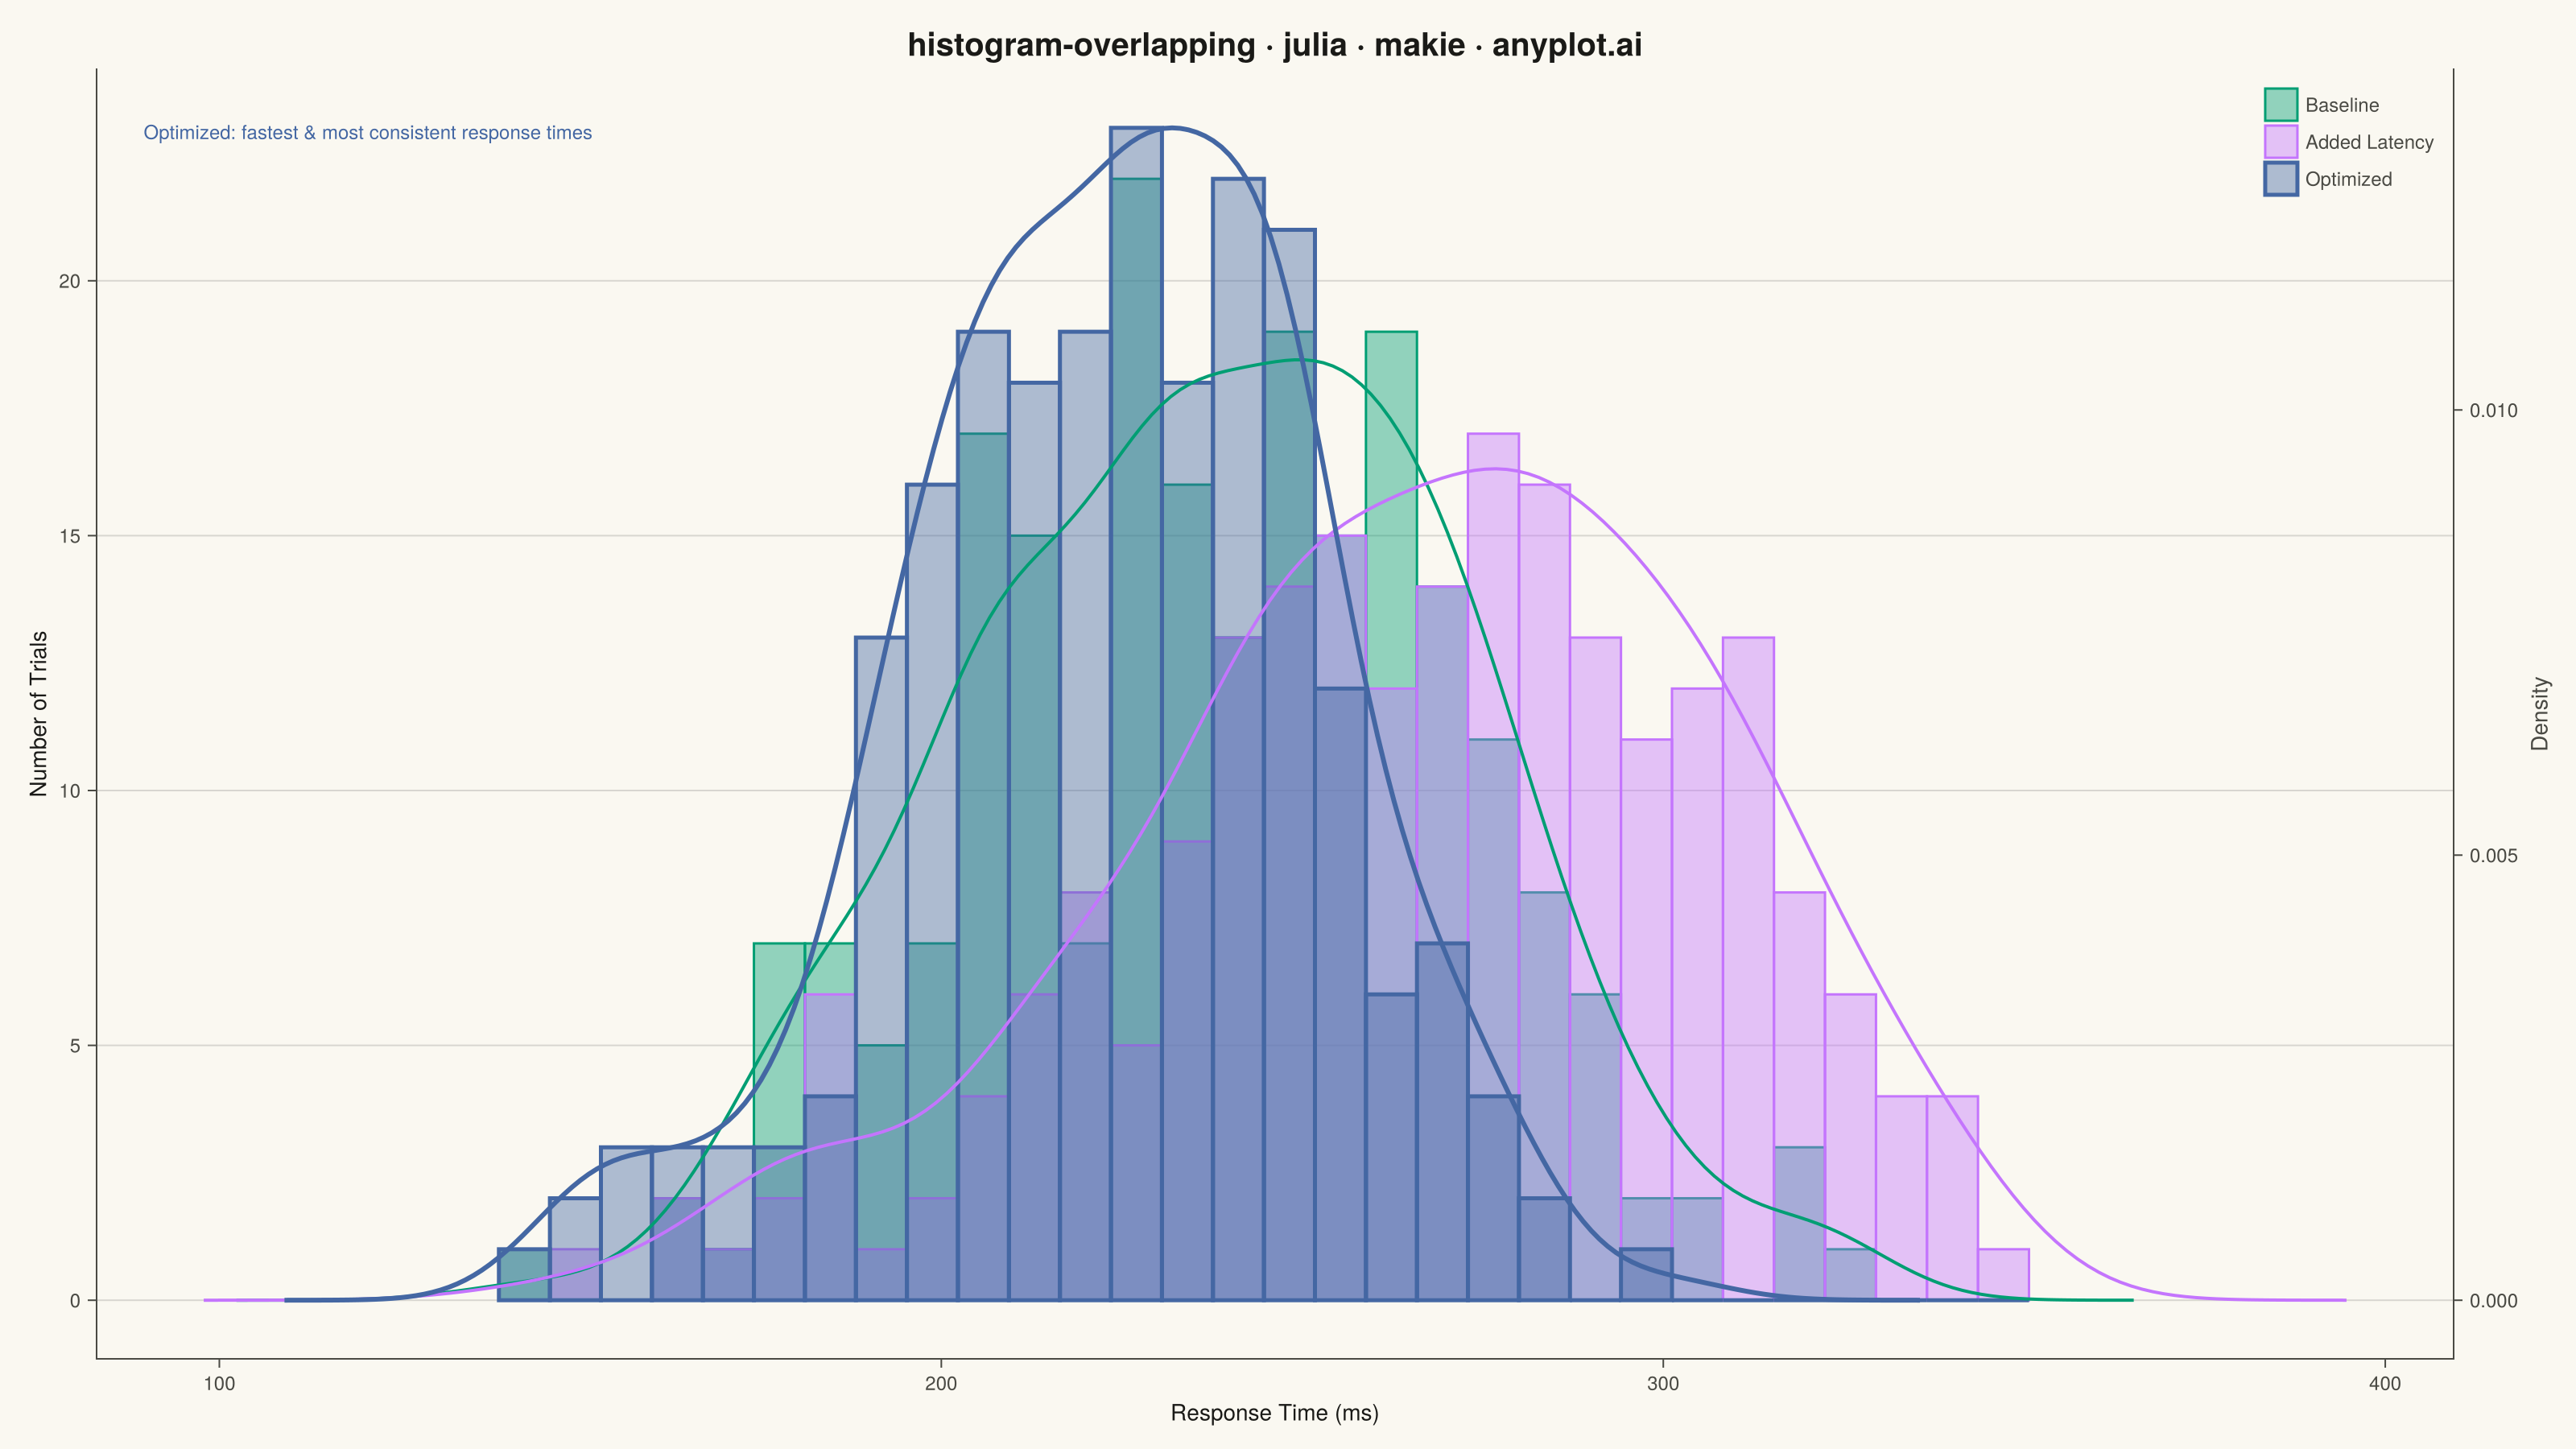
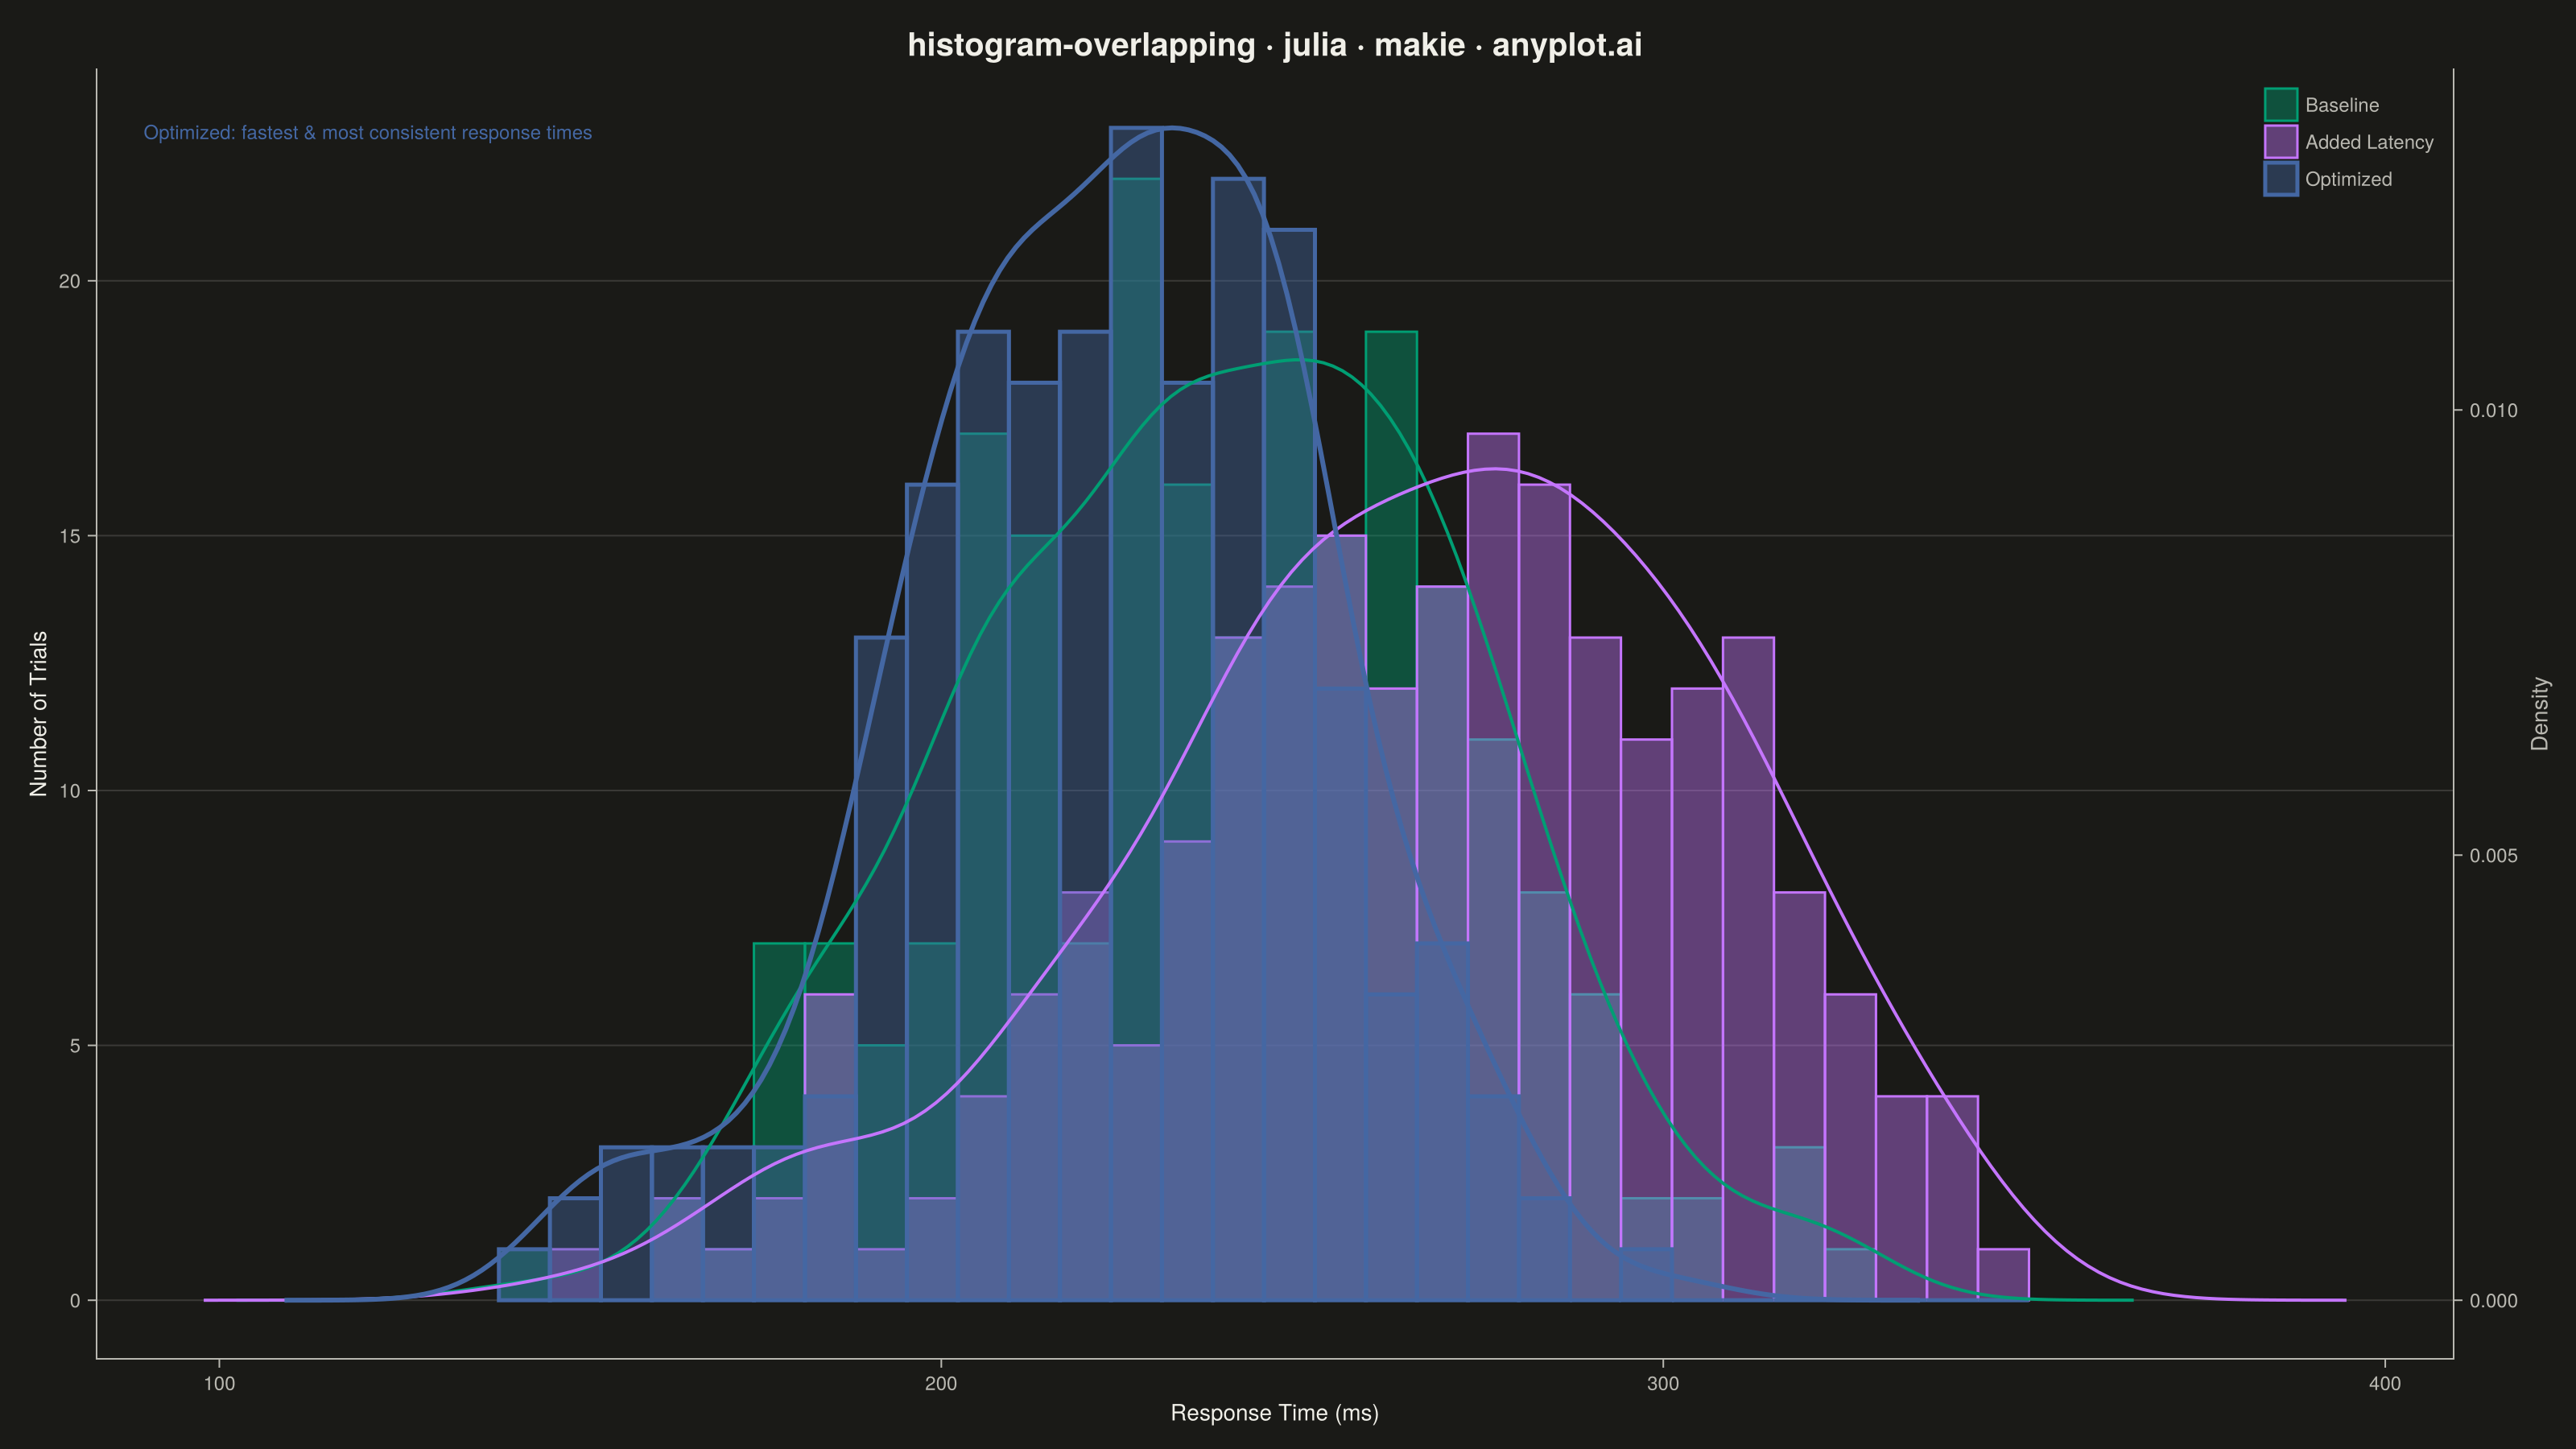
The same plot in 14 other libraries — Python: Altair, Bokeh, lets-plot, Matplotlib, Plotly, plotnine, Pygal, Seaborn; R: ggplot2; JavaScript: Chart.js, D3.js, Apache ECharts, Highcharts, MUI X Charts. Compare all 15 side by side: Overlapping Histograms in Python, R, Julia and JavaScript.
Overlapping histograms display multiple distributions on the same axes using semi-transparent bars, enabling direct visual comparison between groups. This technique reveals differences in central tendency, spread, and shape across categories while maintaining the familiar histogram format. The transparency allows viewers to see where distributions overlap and diverge.
# anyplot.ai
# histogram-overlapping: Overlapping Histograms
# Library: makie 0.21.9 | Julia 1.11.9
# Quality: 90/100 | Created: 2026-08-18

using CairoMakie
using Colors
using Random

Random.seed!(42)

# --- Theme tokens -----------------------------------------------------------
const THEME    = get(ENV, "ANYPLOT_THEME", "light")
const PAGE_BG  = THEME == "light" ? colorant"#FAF8F1" : colorant"#1A1A17"
const INK      = THEME == "light" ? colorant"#1A1A17" : colorant"#F0EFE8"
const INK_SOFT = THEME == "light" ? colorant"#4A4A44" : colorant"#B8B7B0"
const IMPRINT_PALETTE = [
    colorant"#009E73",  # 1 — brand green, ALWAYS first series
    colorant"#C475FD",  # 2 — lavender
    colorant"#4467A3",  # 3 — blue
]

# --- Data ---------------------------------------------------------------
# Reaction times (ms) across three UI response conditions
n_per_group = 220
condition_a = 240 .+ 35 .* randn(n_per_group)          # baseline
condition_b = 265 .+ 42 .* randn(n_per_group)           # added latency
condition_c = 225 .+ 30 .* randn(n_per_group)           # optimized

bin_edges = range(minimum(vcat(condition_a, condition_b, condition_c)) - 5,
                   maximum(vcat(condition_a, condition_b, condition_c)) + 5;
                   length = 31)

# --- Plot -----------------------------------------------------------------
fig = Figure(
    resolution      = (1600, 900),
    fontsize        = 14,
    backgroundcolor = PAGE_BG,
)

ax = Axis(
    fig[1, 1];
    title              = "histogram-overlapping · julia · makie · anyplot.ai",
    titlesize          = 20,
    titlecolor         = INK,
    xlabel             = "Response Time (ms)",
    ylabel             = "Number of Trials",
    xlabelsize         = 14,
    ylabelsize         = 14,
    xlabelcolor        = INK,
    ylabelcolor        = INK,
    xticklabelsize     = 12,
    yticklabelsize     = 12,
    xticklabelcolor    = INK_SOFT,
    yticklabelcolor    = INK_SOFT,
    xtickcolor         = INK_SOFT,
    ytickcolor         = INK_SOFT,
    backgroundcolor    = PAGE_BG,
    topspinevisible    = false,
    rightspinevisible  = false,
    leftspinecolor     = INK_SOFT,
    bottomspinecolor   = INK_SOFT,
    xgridvisible       = false,
    ygridcolor         = RGBAf(INK.r, INK.g, INK.b, 0.15),
)

hist!(ax, condition_a; bins = bin_edges, color = (IMPRINT_PALETTE[1], 0.42),
      strokewidth = 1.5, strokecolor = IMPRINT_PALETTE[1], label = "Baseline")
hist!(ax, condition_b; bins = bin_edges, color = (IMPRINT_PALETTE[2], 0.42),
      strokewidth = 1.5, strokecolor = IMPRINT_PALETTE[2], label = "Added Latency")
hist!(ax, condition_c; bins = bin_edges, color = (IMPRINT_PALETTE[3], 0.42),
      strokewidth = 2.5, strokecolor = IMPRINT_PALETTE[3], label = "Optimized")

# Distinctive Makie touch: a linked secondary y-axis overlays smoothed KDE
# outlines so each group's shape stays traceable through the dense triple-overlap.
ax2 = Axis(
    fig[1, 1];
    yaxisposition      = :right,
    backgroundcolor    = :transparent,
    ylabel             = "Density",
    ylabelsize         = 14,
    ylabelcolor        = INK_SOFT,
    yticklabelsize     = 12,
    yticklabelcolor    = INK_SOFT,
    ytickcolor         = INK_SOFT,
    leftspinevisible   = false,
    rightspinecolor    = INK_SOFT,
    topspinevisible    = false,
    bottomspinevisible = false,
    xgridvisible       = false,
    ygridvisible       = false,
)
hidexdecorations!(ax2)
linkxaxes!(ax, ax2)

density!(ax2, condition_a; color = :transparent, strokecolor = IMPRINT_PALETTE[1], strokewidth = 2)
density!(ax2, condition_b; color = :transparent, strokecolor = IMPRINT_PALETTE[2], strokewidth = 2)
density!(ax2, condition_c; color = :transparent, strokecolor = IMPRINT_PALETTE[3], strokewidth = 3)

text!(
    ax, 0.02, 0.96;
    text     = "Optimized: fastest & most consistent response times",
    space    = :relative,
    align    = (:left, :top),
    fontsize = 12,
    color    = IMPRINT_PALETTE[3],
)

axislegend(ax; position = :rt, labelsize = 12, labelcolor = INK_SOFT,
           framevisible = false, backgroundcolor = :transparent)

# --- Save -------------------------------------------------------------------
save("plot-$(THEME).png", fig; px_per_unit = 2)
Runnable source as JSON, for any HTTP client: https://api.anyplot.ai/specs/histogram-overlapping/makie/code. Any spec id and library id listed in llms-full.txt fit the same URL shape; every URL below is complete and callable.
{
  "spec_id": "histogram-overlapping",
  "language": "julia",
  "library": "makie",
  "page": "https://anyplot.ai/histogram-overlapping/julia/makie",
  "hub": "https://anyplot.ai/histogram-overlapping",
  "code_json": "https://api.anyplot.ai/specs/histogram-overlapping/makie/code",
  "spec_json": "https://api.anyplot.ai/specs/histogram-overlapping",
  "render_light_png": "https://storage.googleapis.com/anyplot-images/plots/histogram-overlapping/julia/makie/plot-light.png",
  "render_dark_png": "https://storage.googleapis.com/anyplot-images/plots/histogram-overlapping/julia/makie/plot-dark.png",
  "quality_score": 90.0,
  "license": "MIT",
  "guide": "https://anyplot.ai/llms.txt"
}
Part of Overlapping Histograms on anyplot.ai.