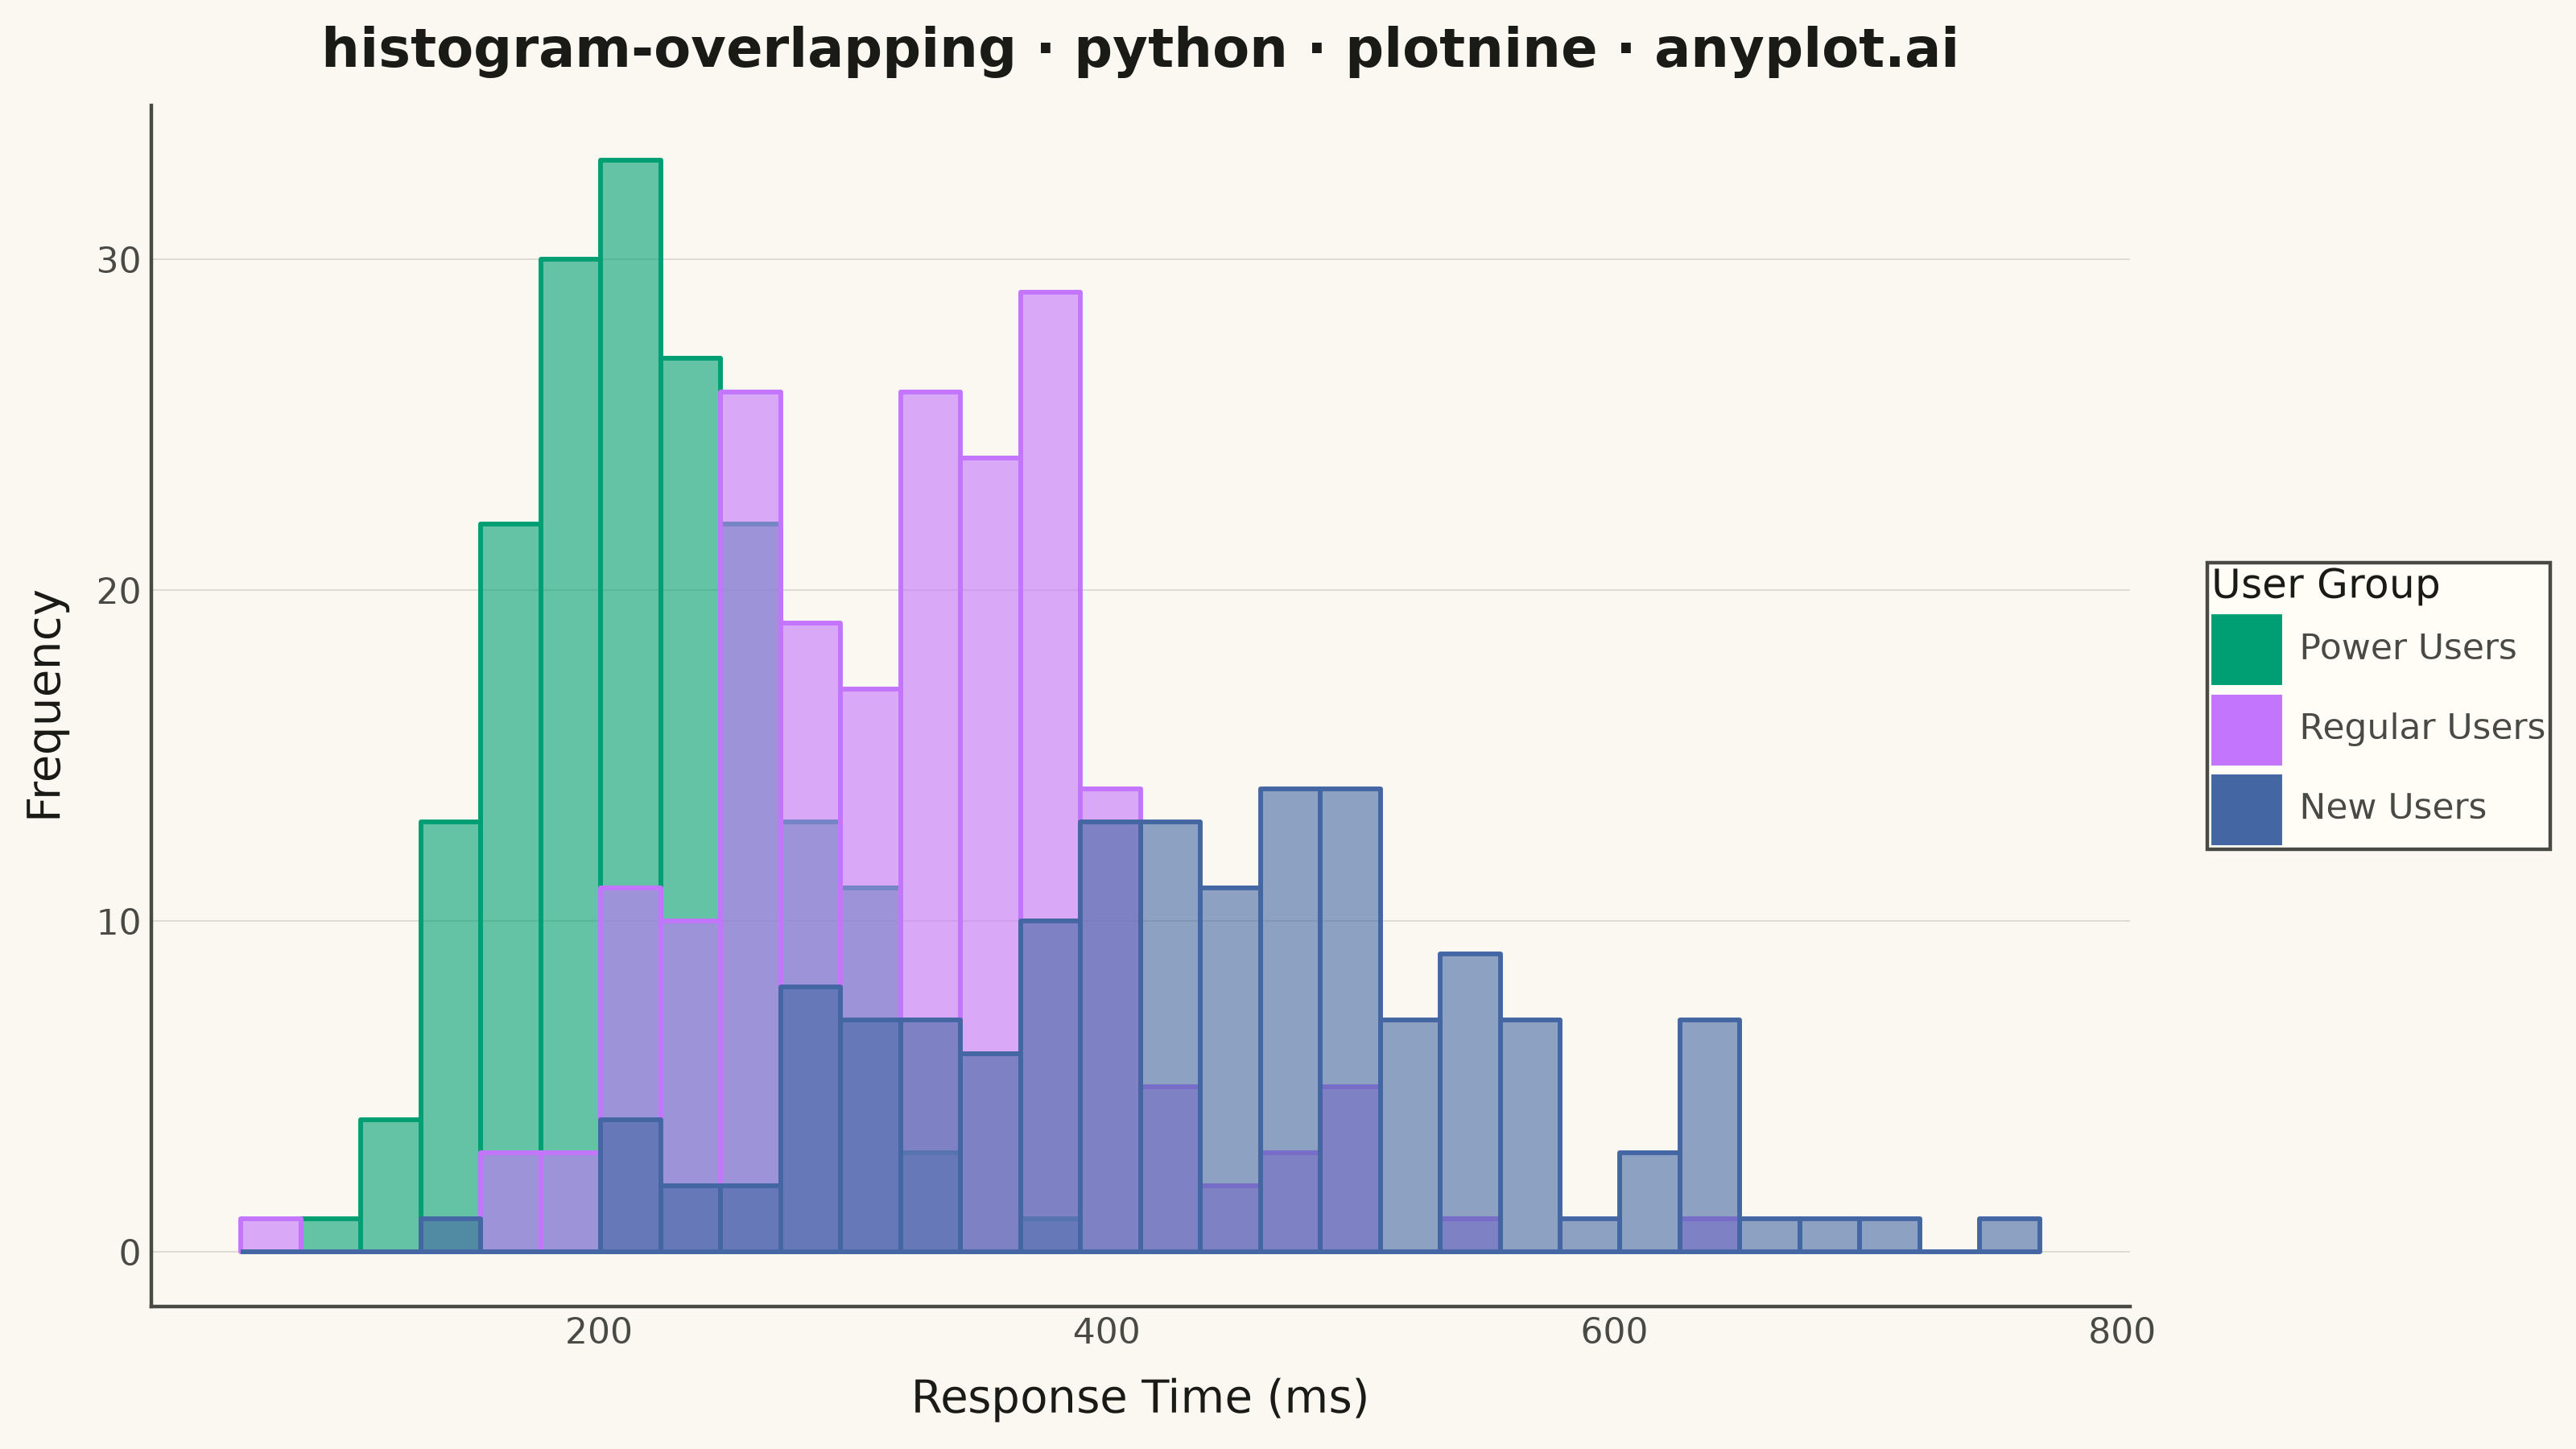
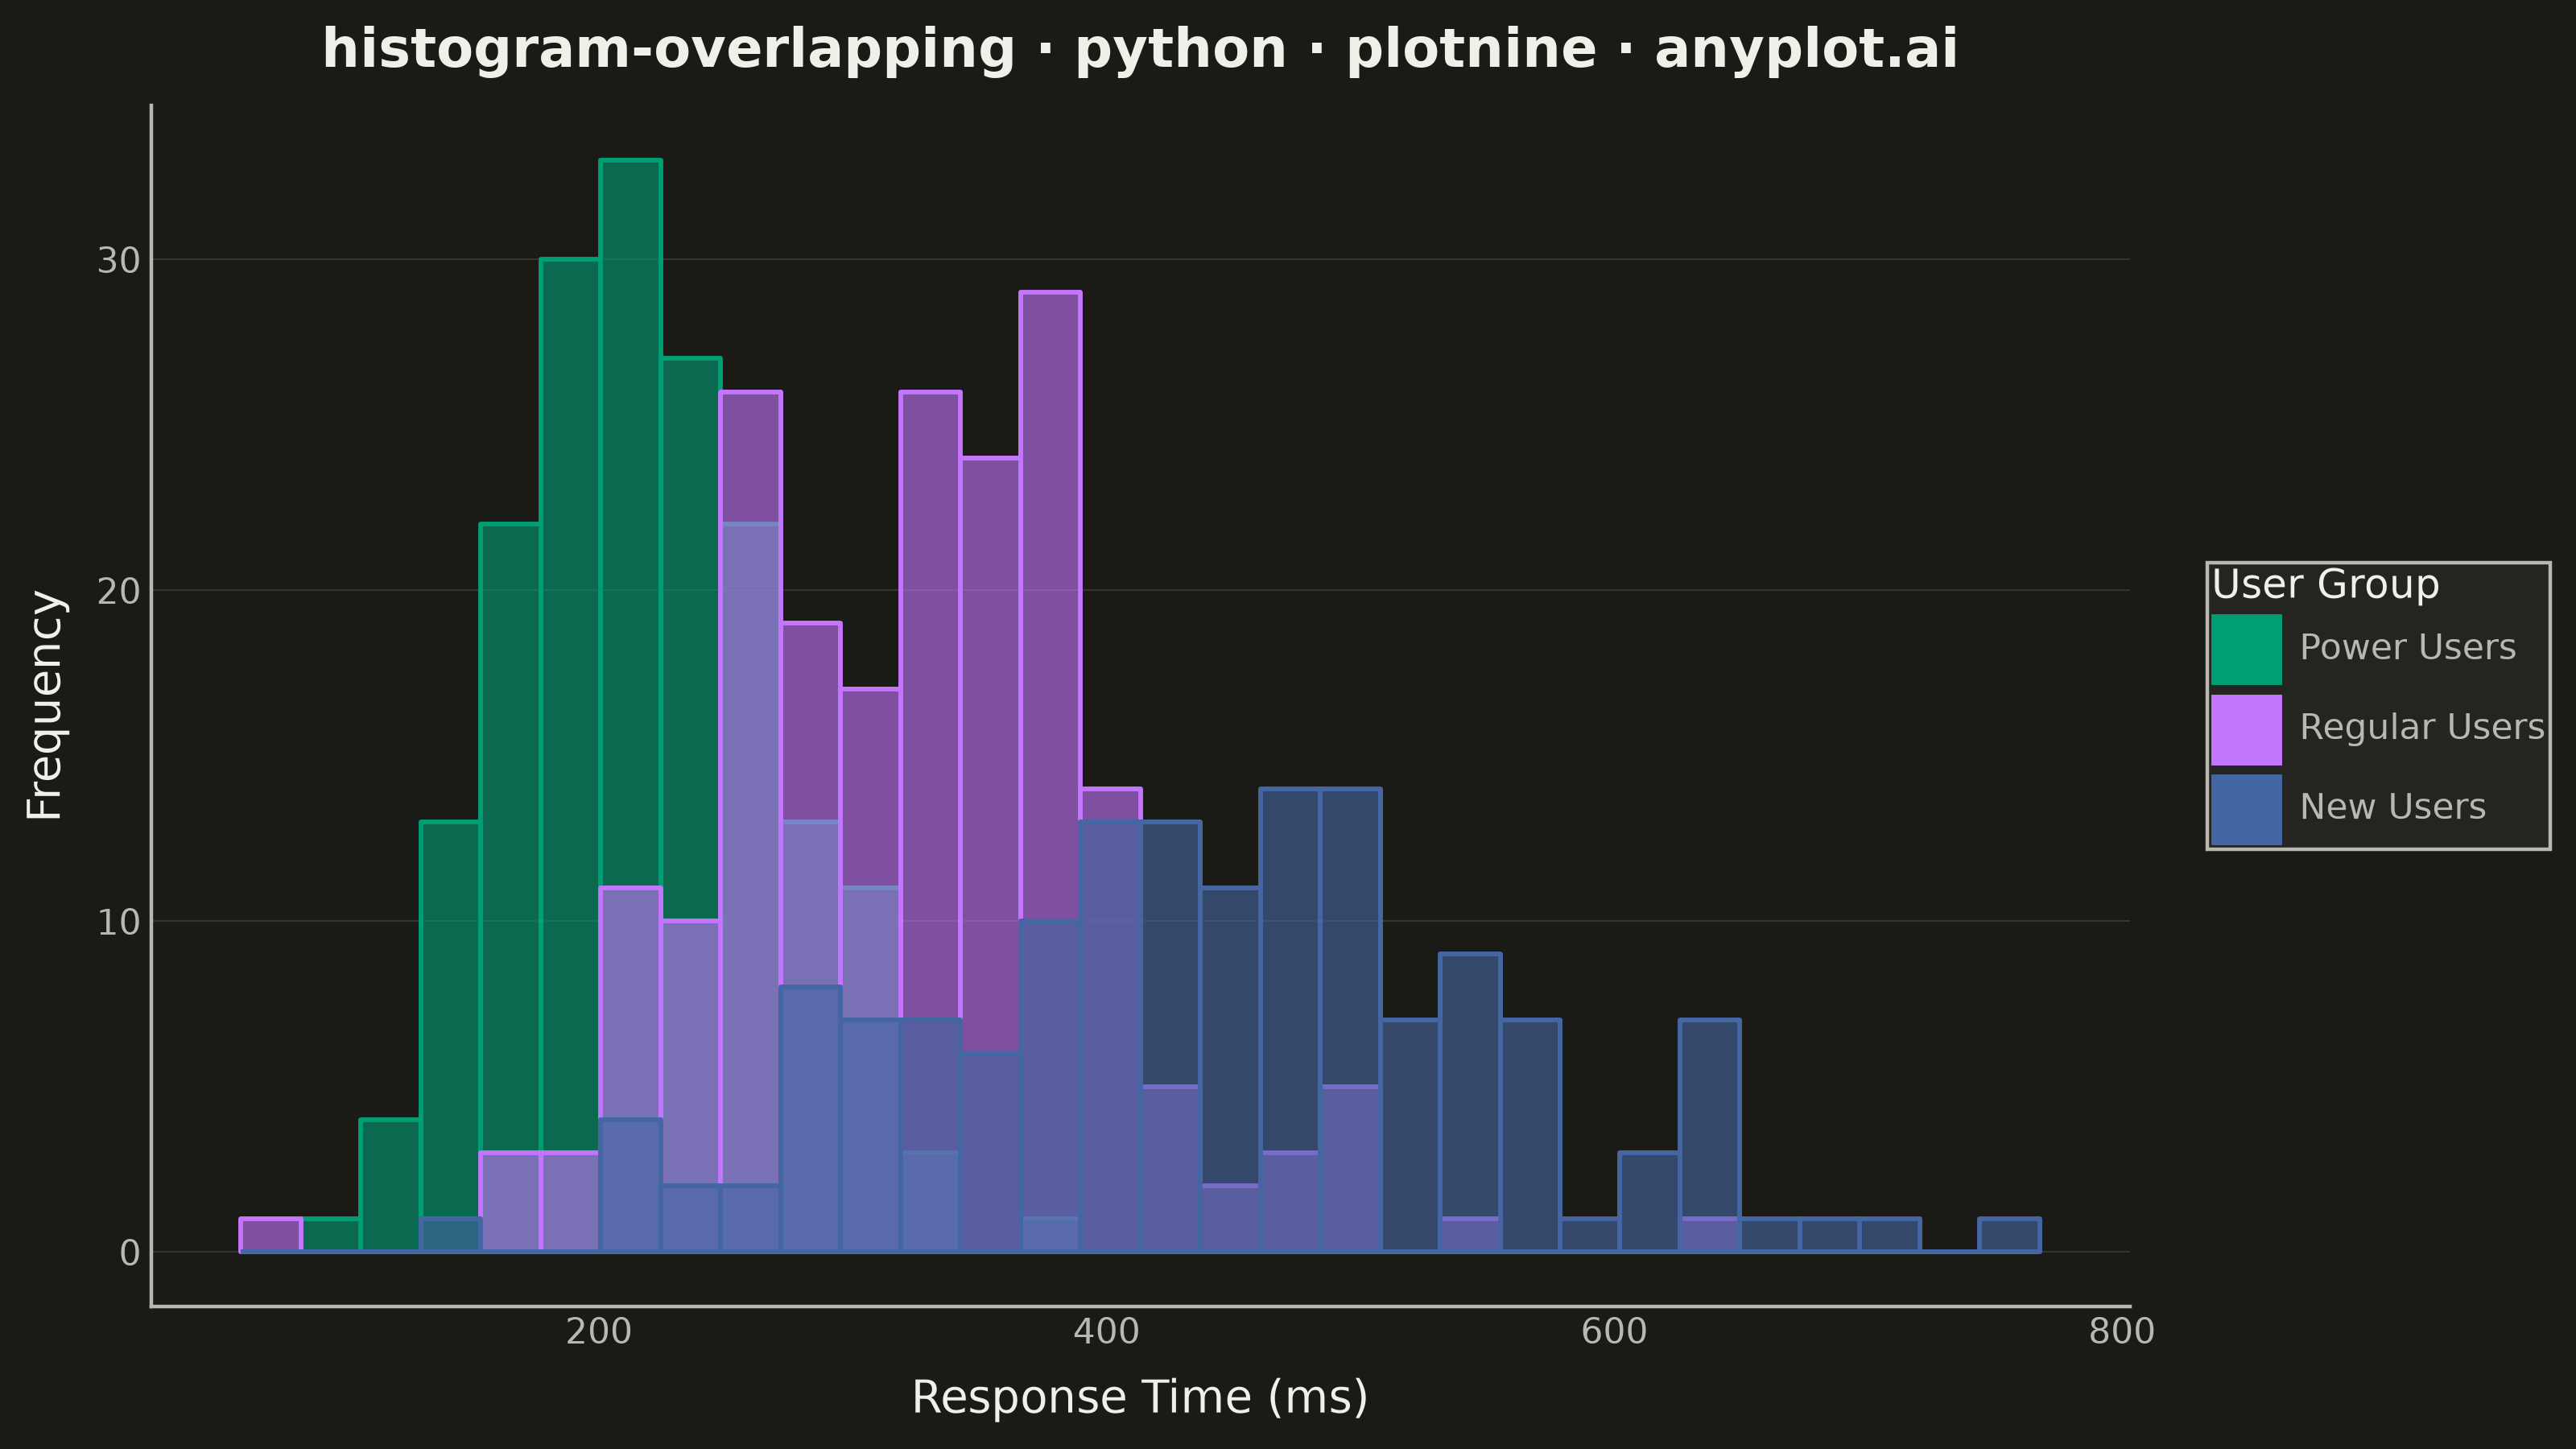
Overlapping histograms display multiple distributions on the same axes using semi-transparent bars, enabling direct visual comparison between groups. This technique reveals differences in central tendency, spread, and shape across categories while maintaining the familiar histogram format. The transparency allows viewers to see where distributions overlap and diverge.
""" anyplot.ai
histogram-overlapping: Overlapping Histograms
Library: plotnine 0.15.8 | Python 3.13.15
Quality: 89/100 | Updated: 2026-08-18
"""

import os

# Add site-packages to path before current directory to avoid local plotnine.py shadowing
import site
import sys


site_packages = site.getsitepackages()
sys.path = site_packages + [p for p in sys.path if p not in site_packages and p not in ("", ".")]

import numpy as np
import pandas as pd
import plotnine as pn


THEME = os.getenv("ANYPLOT_THEME", "light")
PAGE_BG = "#FAF8F1" if THEME == "light" else "#1A1A17"
ELEVATED_BG = "#FFFDF6" if THEME == "light" else "#242420"
INK = "#1A1A17" if THEME == "light" else "#F0EFE8"
INK_SOFT = "#4A4A44" if THEME == "light" else "#B8B7B0"
INK_MUTED = "#6B6A63" if THEME == "light" else "#A8A79F"

IMPRINT = ["#009E73", "#C475FD", "#4467A3"]

# Data - Response times (ms) for three user groups
np.random.seed(42)

# New users: higher response times, more spread
new_users = np.random.normal(loc=450, scale=120, size=150)

# Regular users: moderate response times
regular_users = np.random.normal(loc=320, scale=80, size=200)

# Power users: faster response times, tighter distribution
power_users = np.random.normal(loc=220, scale=50, size=180)

# Combine into a DataFrame, ordering groups fastest-to-slowest (Power -> Regular -> New)
# so the legend and palette assignment tell the response-time story at a glance.
df = pd.DataFrame(
    {
        "response_time": np.concatenate([power_users, regular_users, new_users]),
        "user_group": (
            ["Power Users"] * len(power_users) + ["Regular Users"] * len(regular_users) + ["New Users"] * len(new_users)
        ),
    }
)
group_order = ["Power Users", "Regular Users", "New Users"]
df["user_group"] = pd.Categorical(df["user_group"], categories=group_order, ordered=True)

# Theme-adaptive elements — L-shaped frame (axis lines, no panel border), y-axis-only grid
anyplot_theme = pn.theme(
    plot_background=pn.element_rect(fill=PAGE_BG, color=PAGE_BG),
    panel_background=pn.element_rect(fill=PAGE_BG, color=None),
    panel_grid_major_x=pn.element_blank(),
    panel_grid_major_y=pn.element_line(color=INK, size=0.3, alpha=0.15),
    panel_grid_minor=pn.element_blank(),
    axis_title=pn.element_text(color=INK, size=10),
    axis_text=pn.element_text(color=INK_SOFT, size=8),
    axis_line_x=pn.element_line(color=INK_SOFT, size=0.8),
    axis_line_y=pn.element_line(color=INK_SOFT, size=0.8),
    plot_title=pn.element_text(color=INK, size=12, face="bold"),
    legend_background=pn.element_rect(fill=ELEVATED_BG, color=INK_SOFT, size=0.8),
    legend_text=pn.element_text(color=INK_SOFT, size=8),
    legend_title=pn.element_text(color=INK, size=9),
    figure_size=(8, 4.5),
    text=pn.element_text(size=7, family="sans"),
)

# Plot — per-group edge colors (instead of a uniform background edge) keep each
# distribution separable even inside the triple-overlap zone.
plot = (
    pn.ggplot(df, pn.aes(x="response_time", fill="user_group", color="user_group"))
    + pn.geom_histogram(alpha=0.6, bins=30, position="identity", size=0.6)
    + pn.scale_fill_manual(values=IMPRINT)
    + pn.scale_color_manual(values=IMPRINT)
    + pn.labs(
        x="Response Time (ms)",
        y="Frequency",
        title="histogram-overlapping · python · plotnine · anyplot.ai",
        fill="User Group",
        color="User Group",
    )
    + pn.theme_minimal()
    + anyplot_theme
    + pn.guides(color=pn.guide_legend(override_aes={"alpha": 1}))
)

# Save
plot.save(f"plot-{THEME}.png", dpi=400, width=8, height=4.5, units="in", verbose=False)
Runnable source as JSON, for any HTTP client: https://api.anyplot.ai/specs/histogram-overlapping/plotnine/code. Any spec id and library id listed in llms-full.txt fit the same URL shape; every URL below is complete and callable.
{
  "spec_id": "histogram-overlapping",
  "language": "python",
  "library": "plotnine",
  "page": "https://anyplot.ai/histogram-overlapping/python/plotnine",
  "hub": "https://anyplot.ai/histogram-overlapping",
  "code_json": "https://api.anyplot.ai/specs/histogram-overlapping/plotnine/code",
  "spec_json": "https://api.anyplot.ai/specs/histogram-overlapping",
  "render_light_png": "https://storage.googleapis.com/anyplot-images/plots/histogram-overlapping/python/plotnine/plot-light.png",
  "render_dark_png": "https://storage.googleapis.com/anyplot-images/plots/histogram-overlapping/python/plotnine/plot-dark.png",
  "quality_score": 89.0,
  "license": "MIT",
  "guide": "https://anyplot.ai/llms.txt"
}
Part of Overlapping Histograms on anyplot.ai.