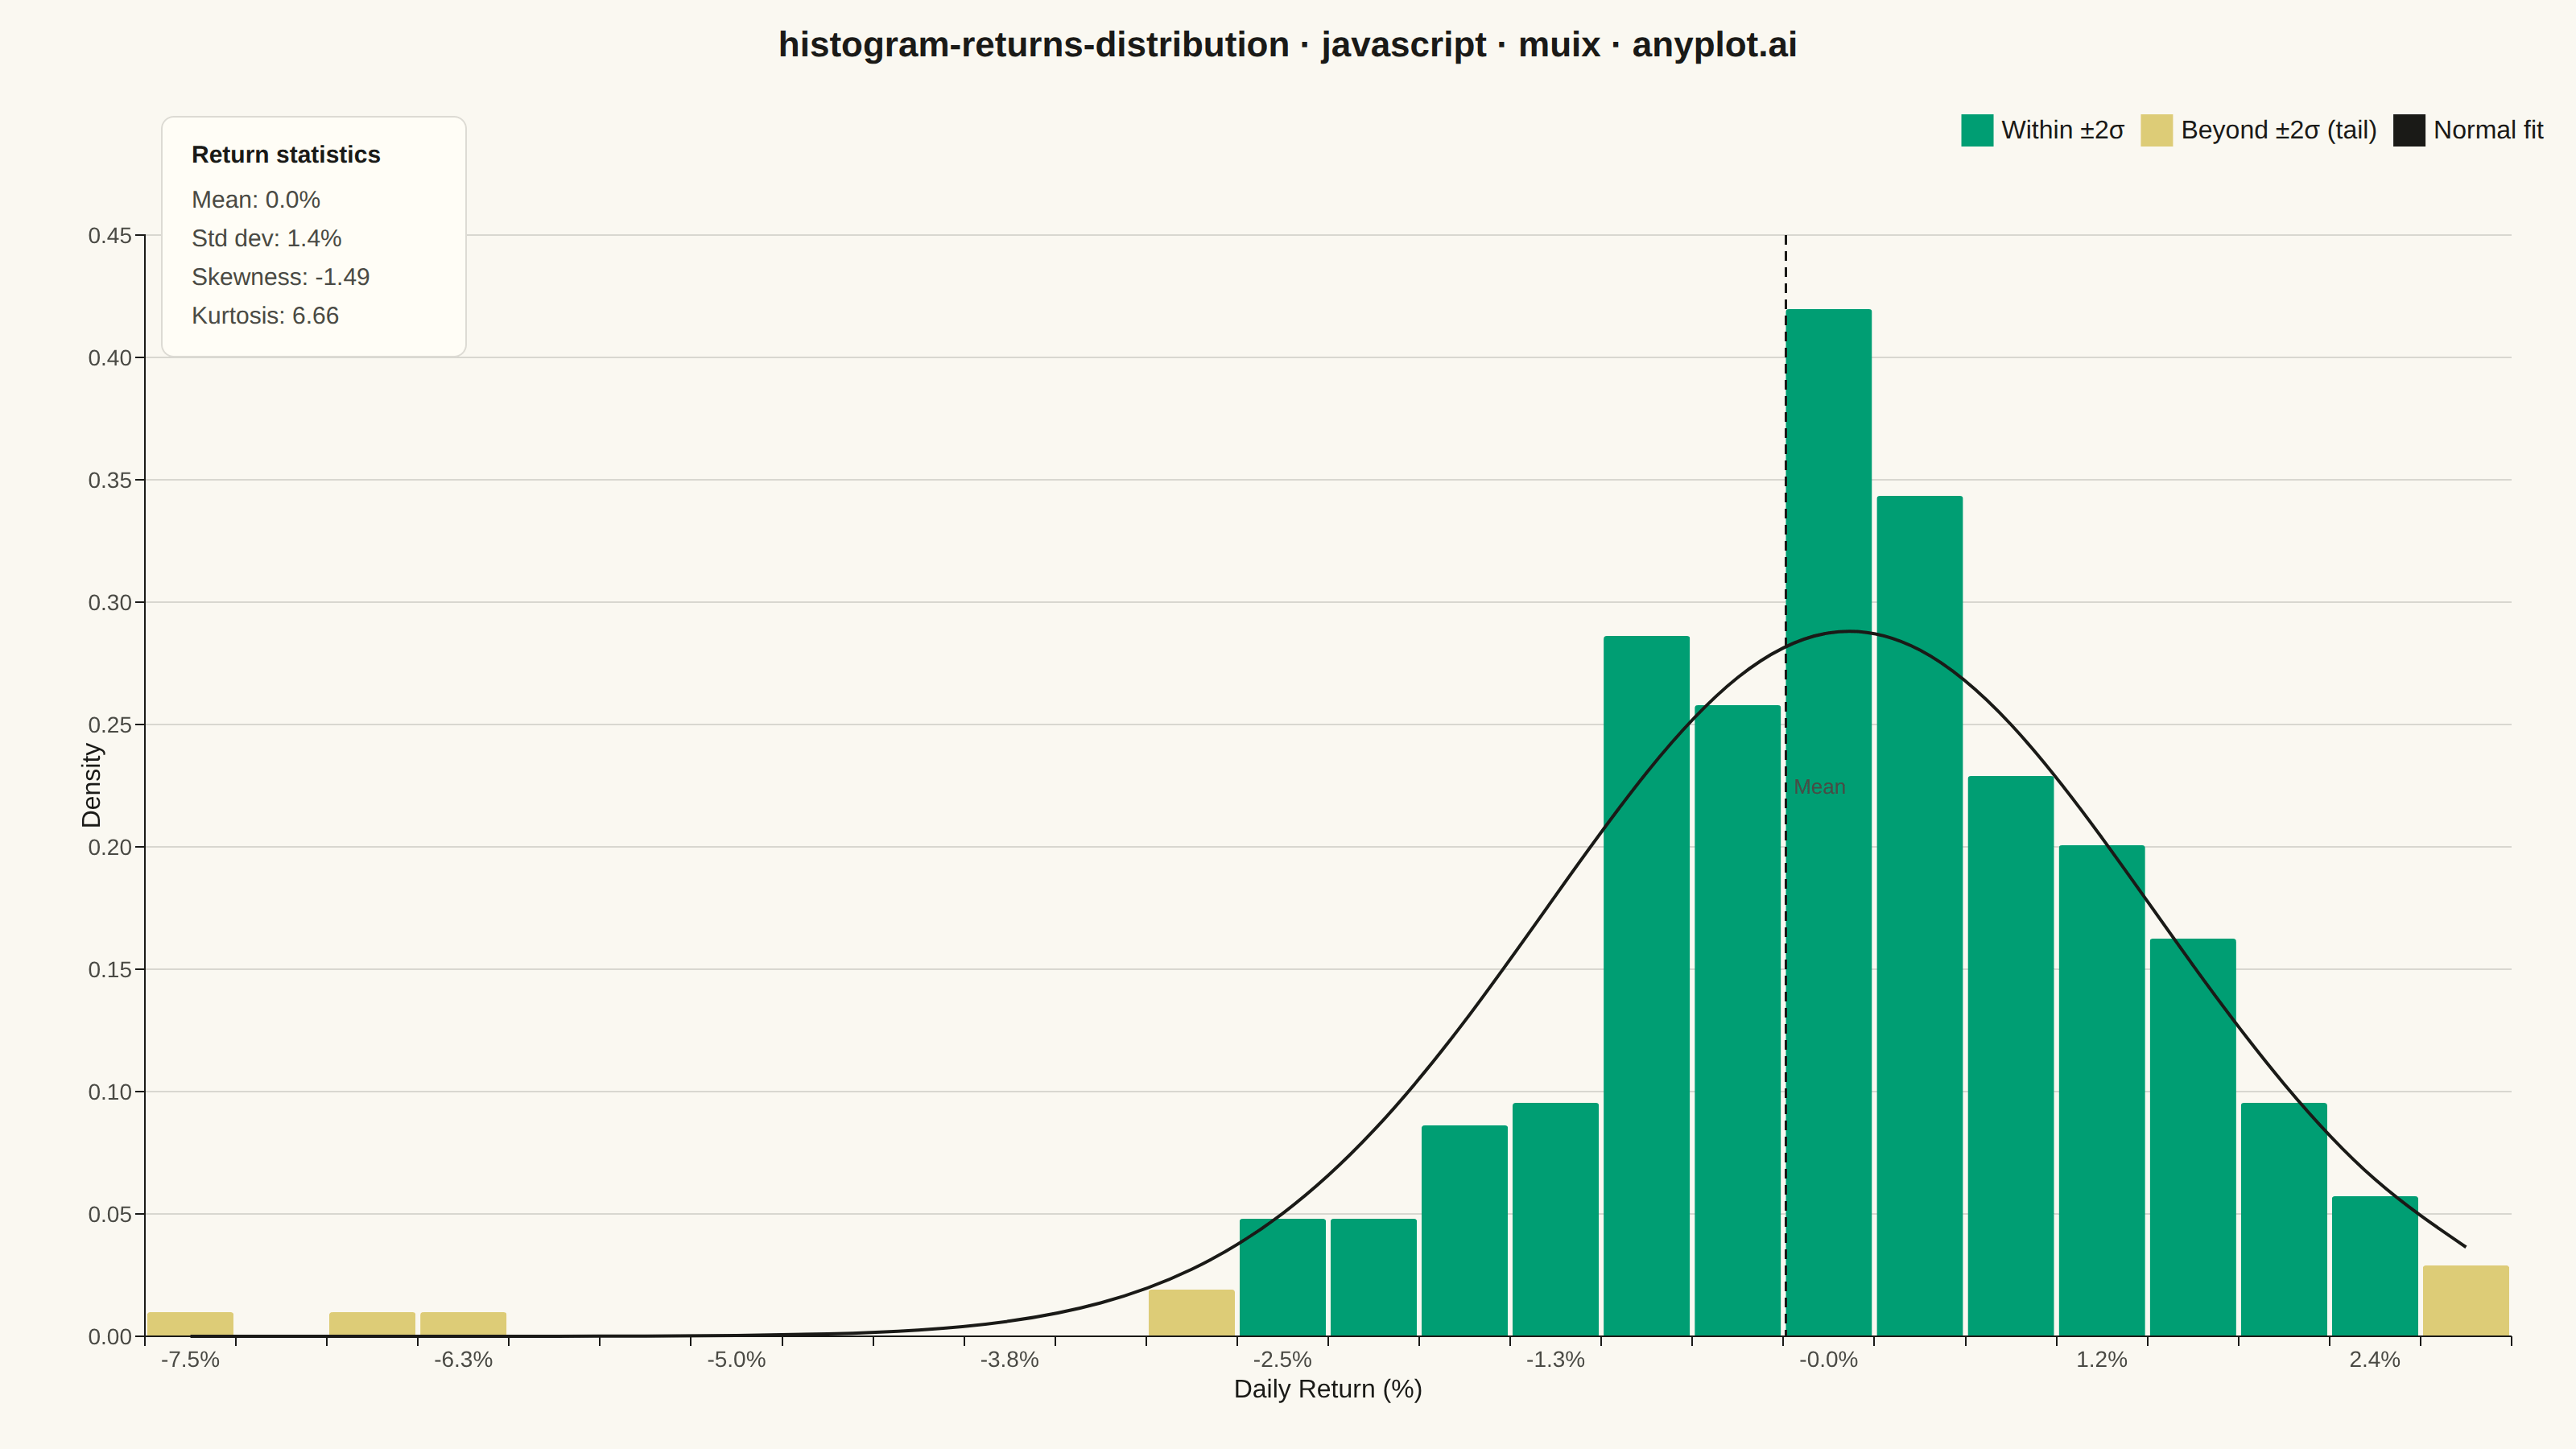
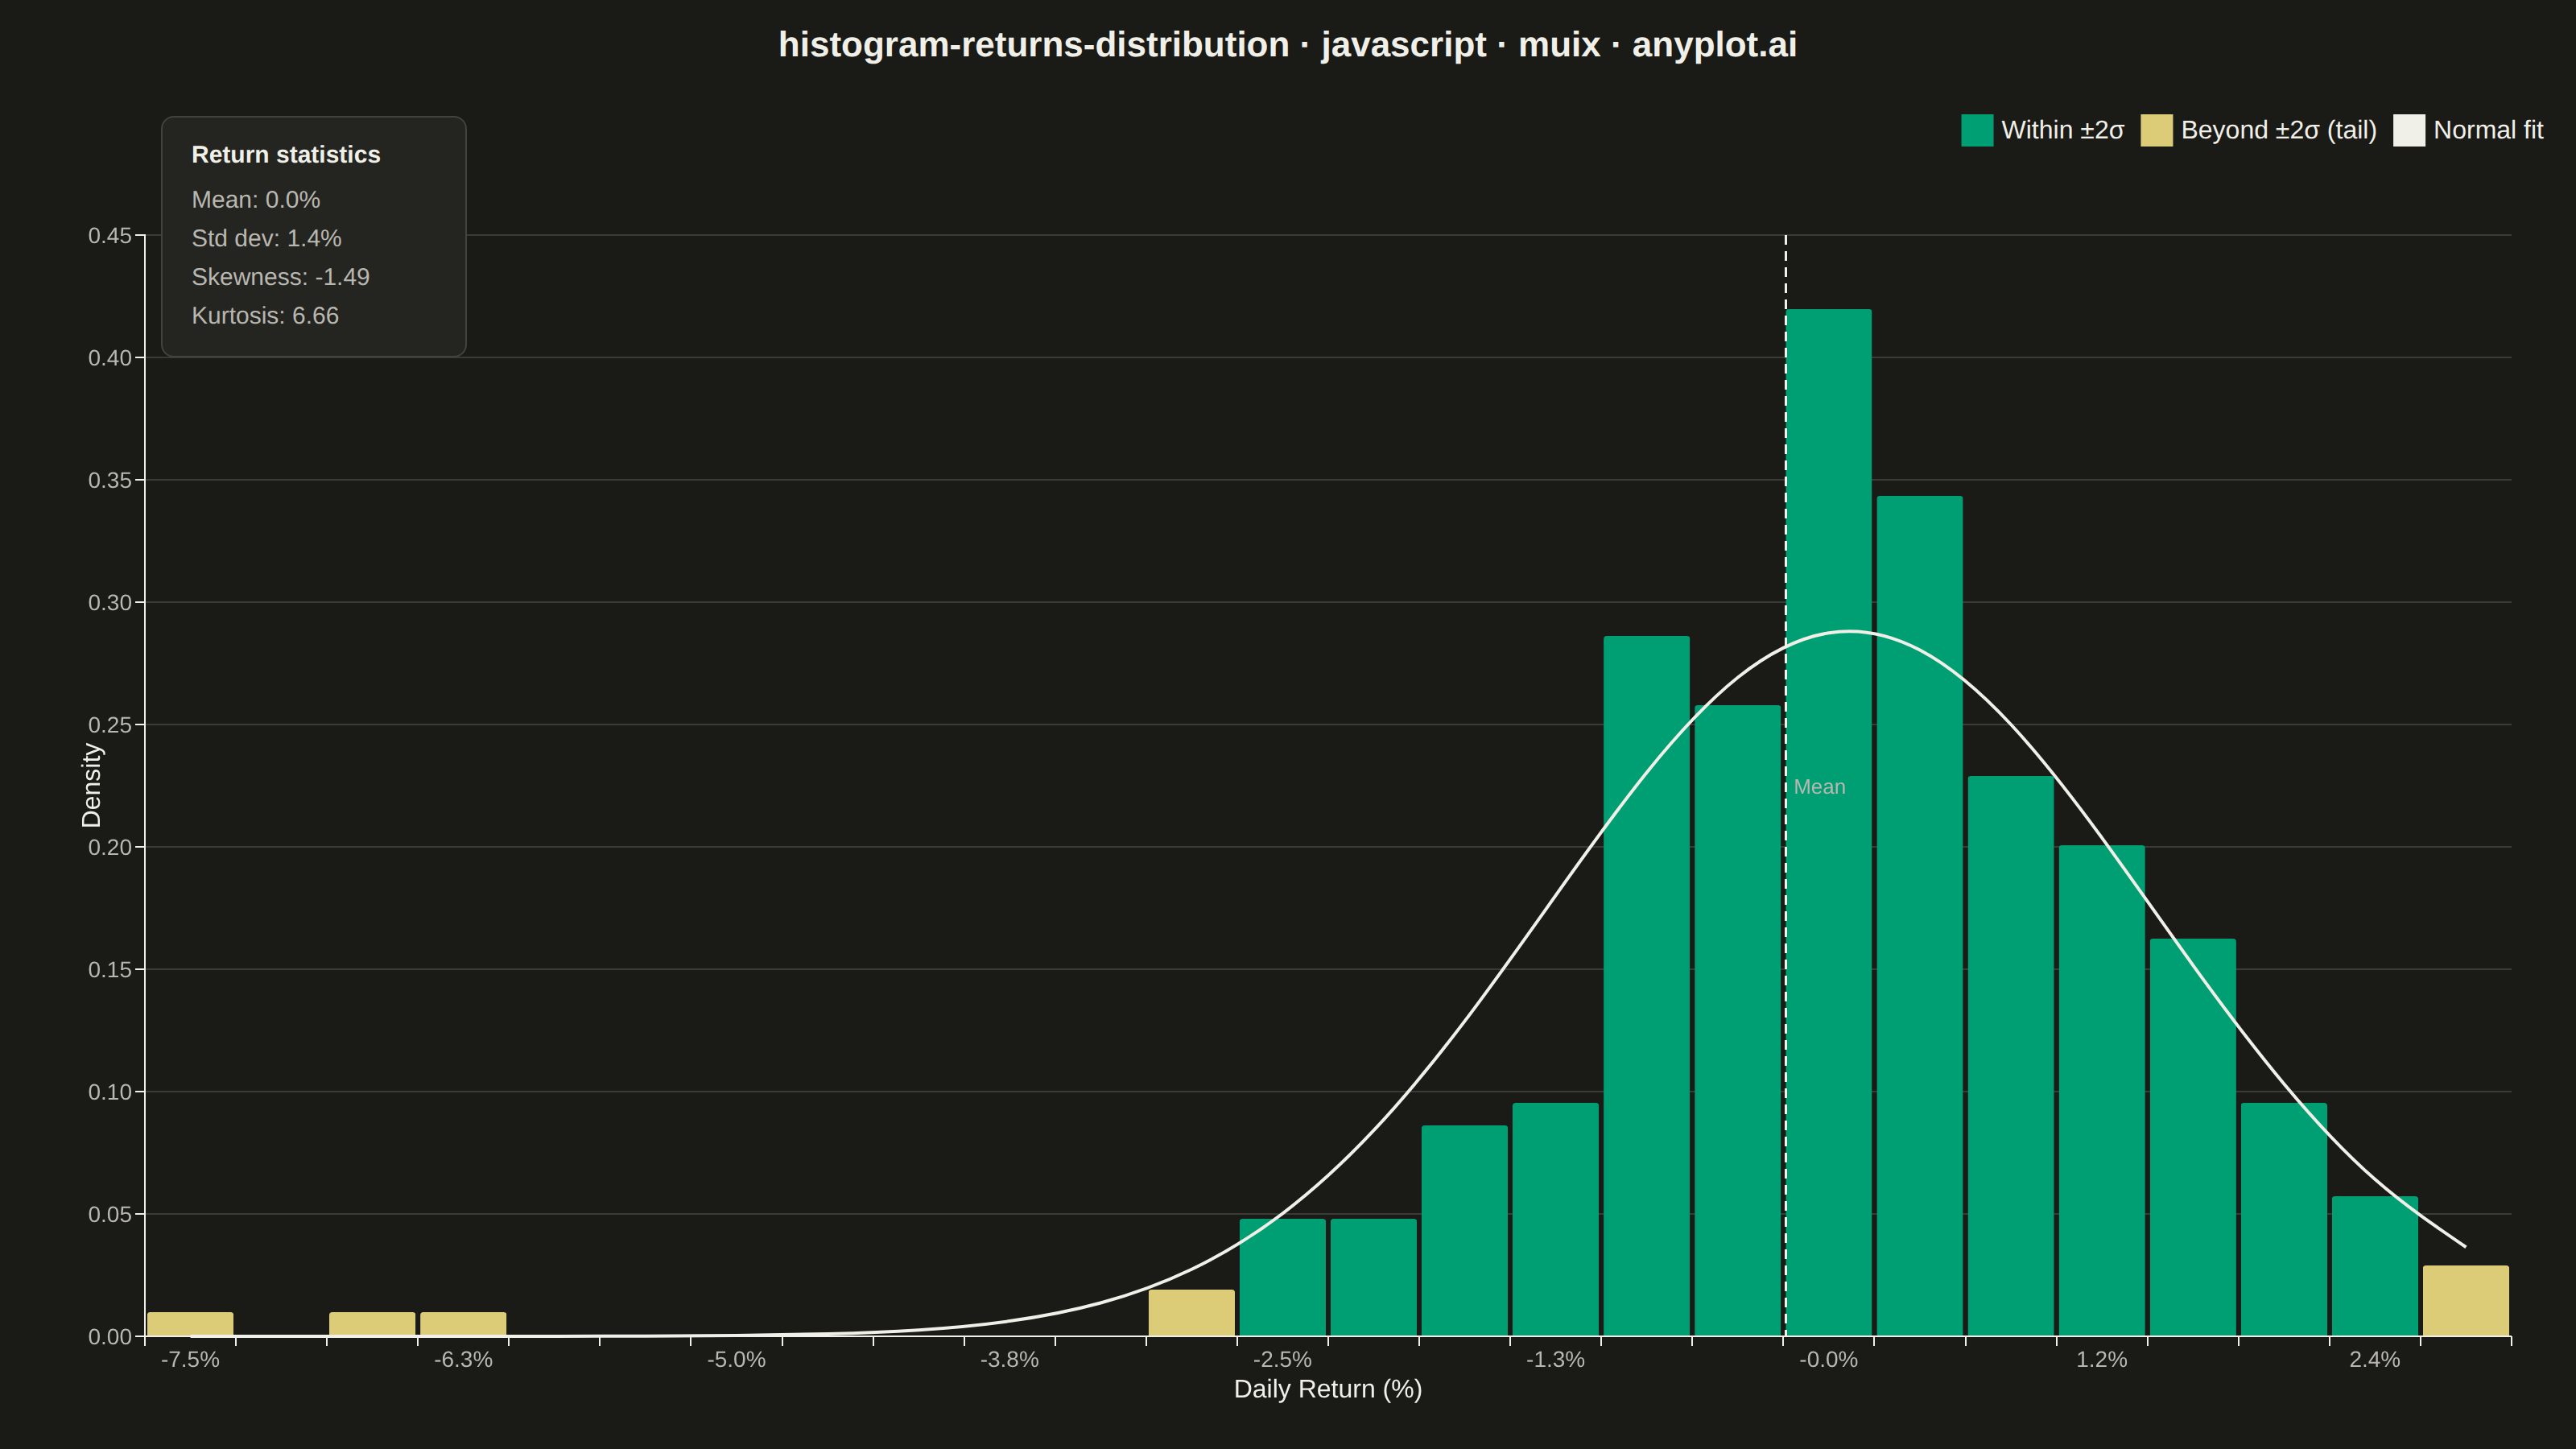
A histogram showing the distribution of financial returns (daily, weekly, or monthly) with a normal distribution overlay for comparison. This visualization is essential for risk analysis, allowing analysts to assess whether returns follow a normal distribution, identify fat tails indicating higher-than-expected extreme events, and measure asymmetry through skewness. Key statistics are displayed directly on the plot for quick interpretation.
Preview render from the MUI X Charts implementation.