The same plot in 14 other libraries — JavaScript: Chart.js, D3.js, Apache ECharts, Highcharts; Python: Altair, Bokeh, lets-plot, Matplotlib, Plotly, plotnine, Pygal, Seaborn; R: ggplot2; Julia: Makie.jl. Compare all 15 side by side: Returns Distribution Histogram in Python, R, Julia and JavaScript.
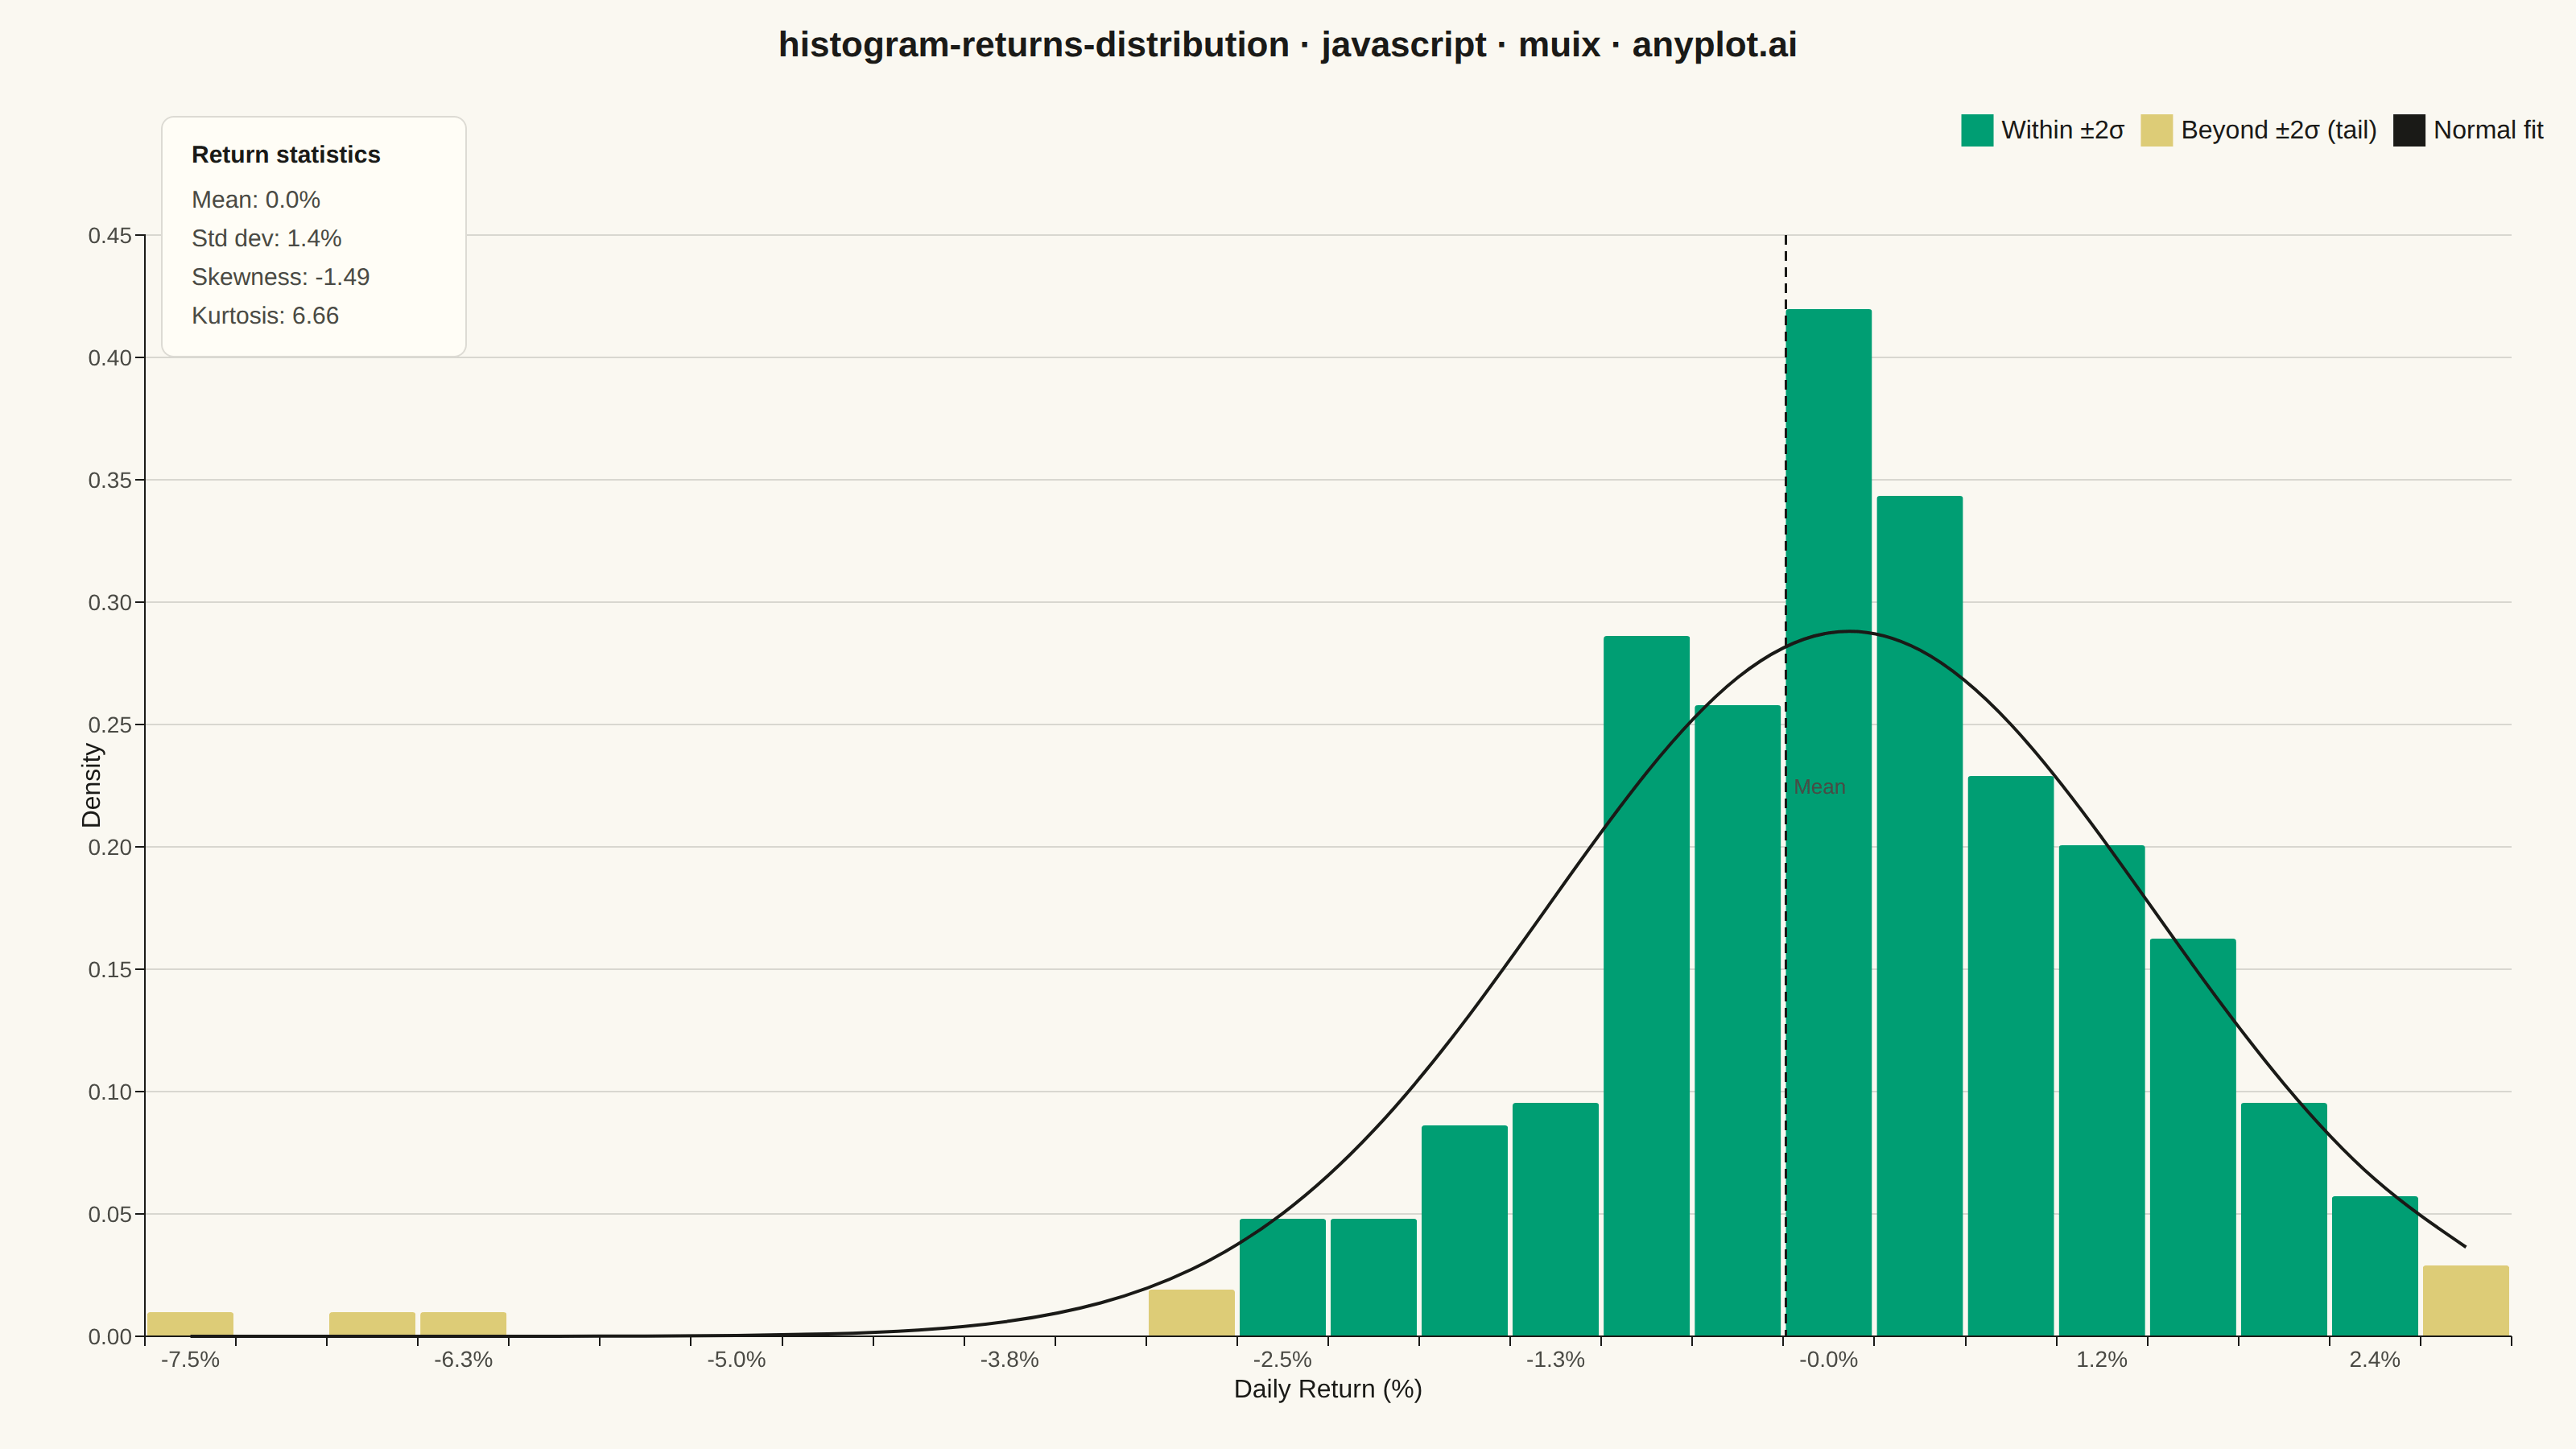
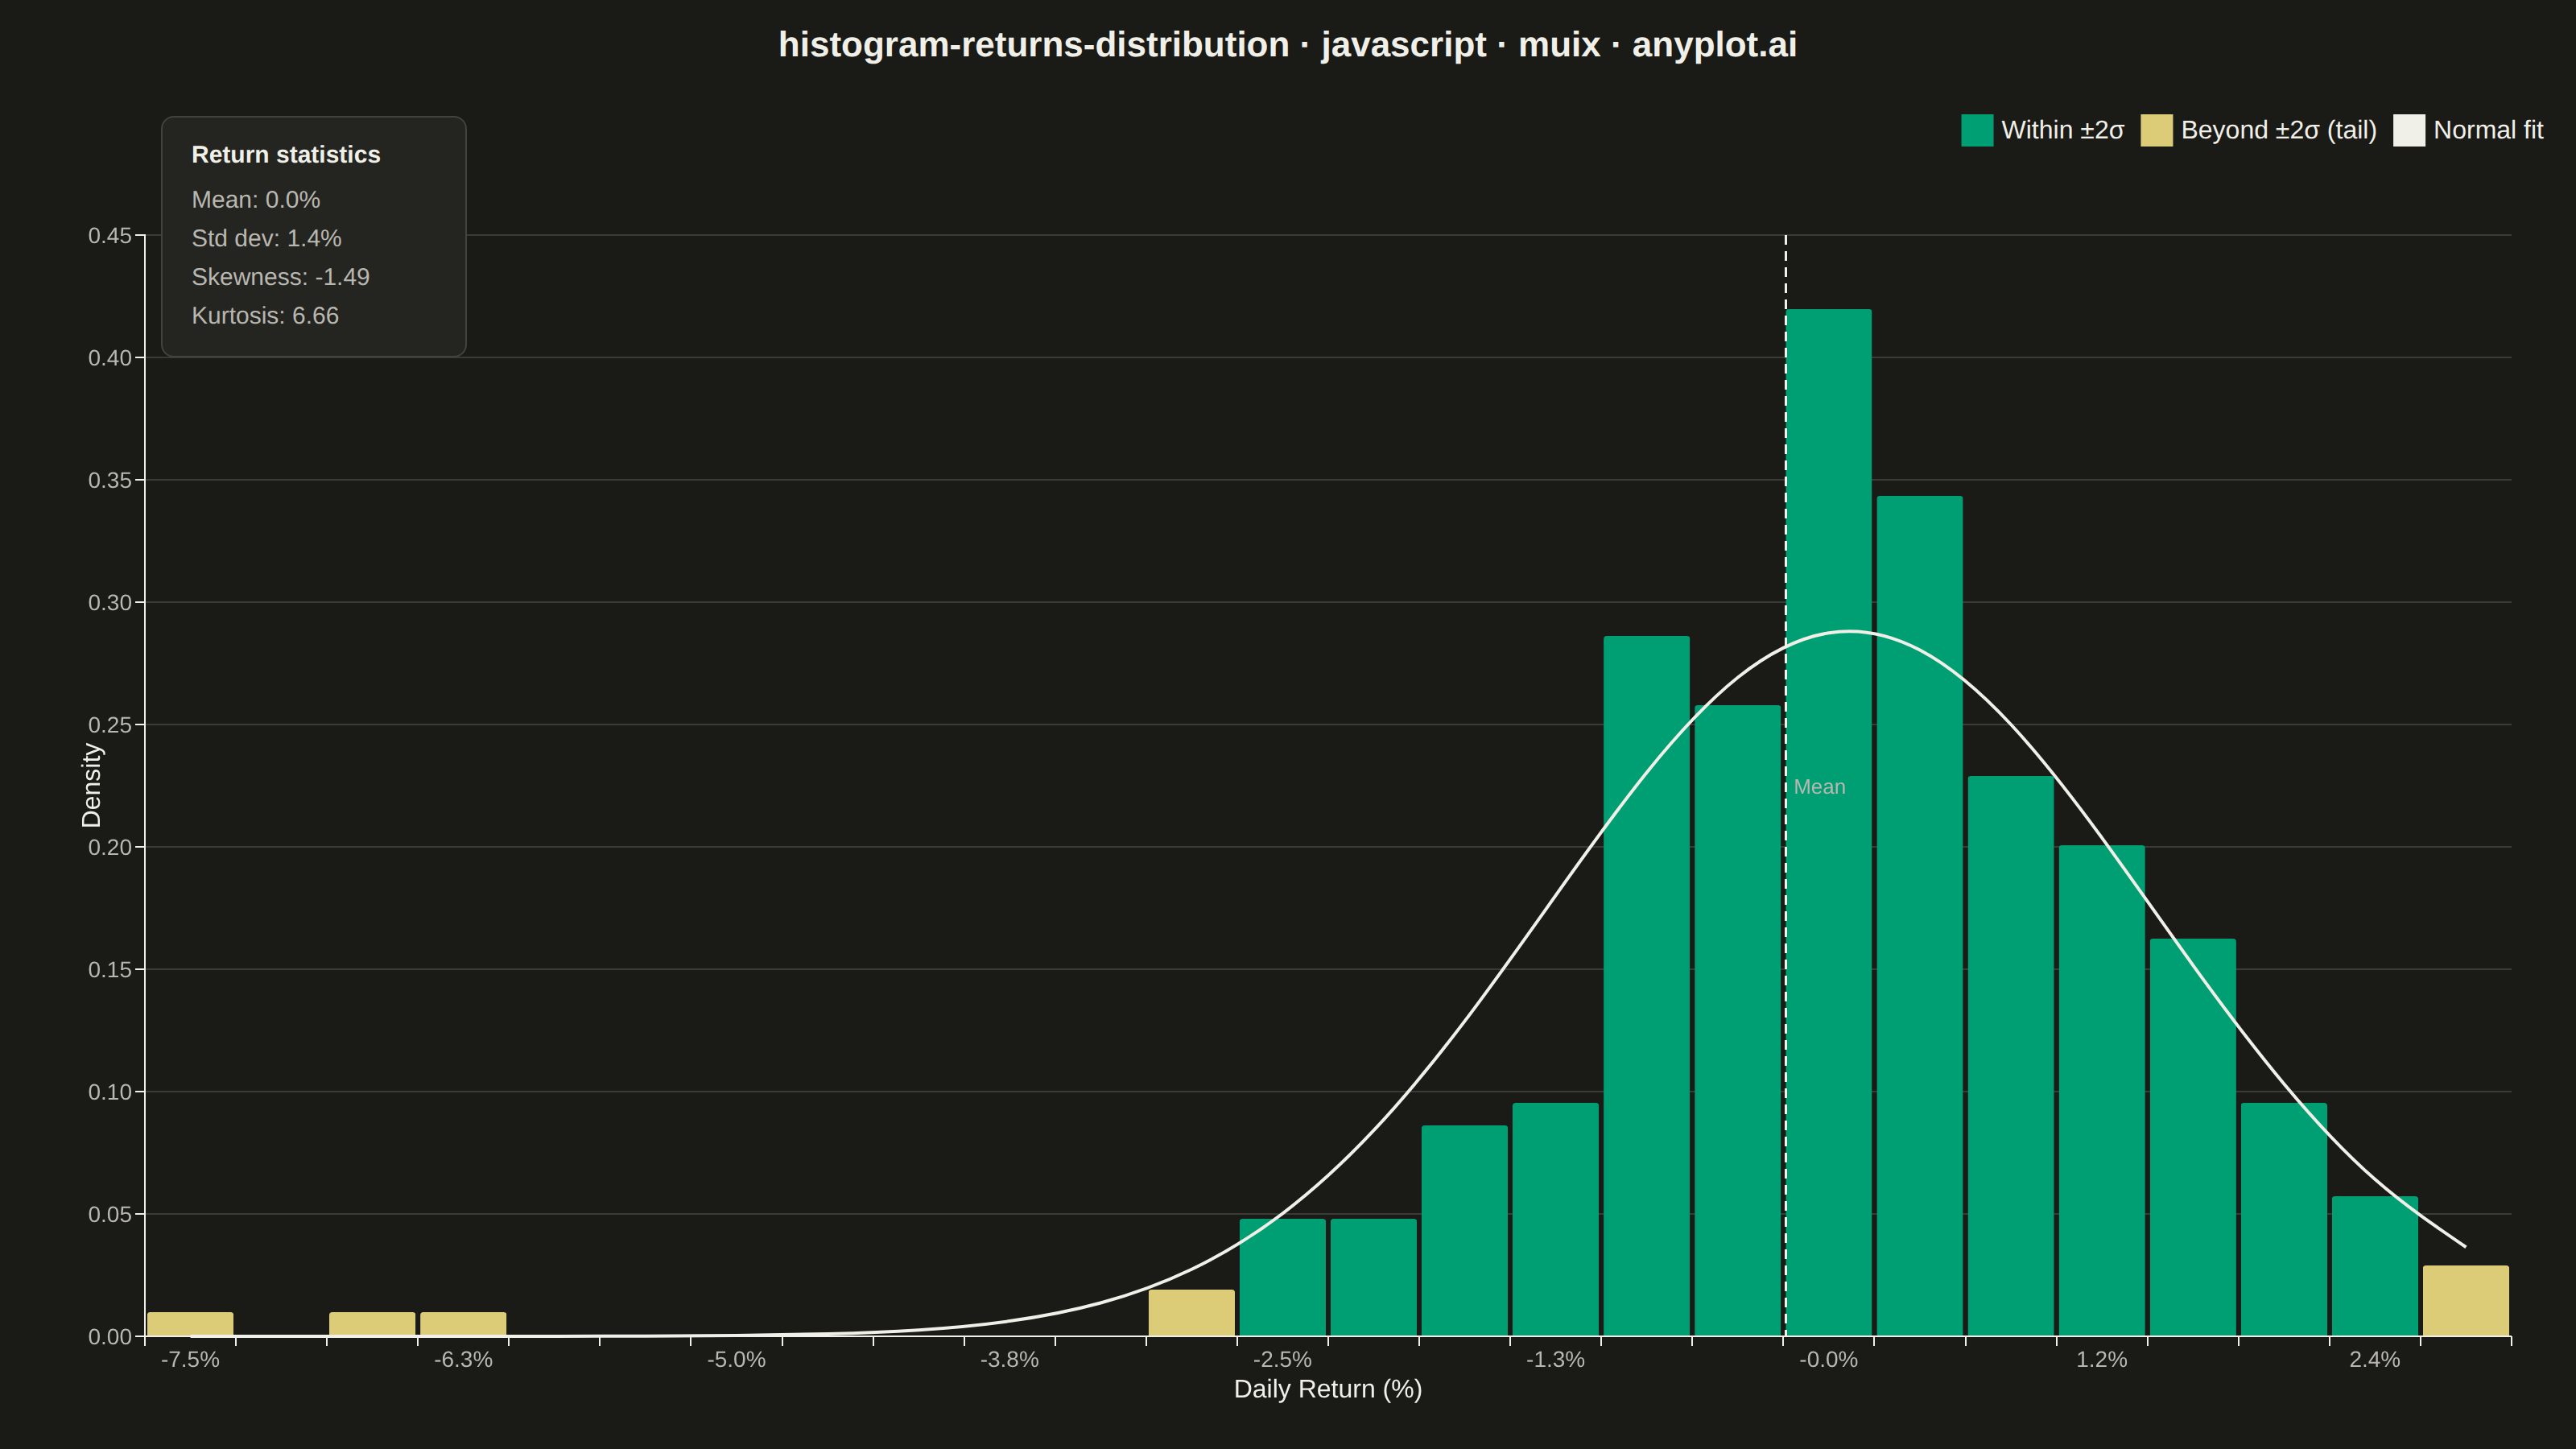
A histogram showing the distribution of financial returns (daily, weekly, or monthly) with a normal distribution overlay for comparison. This visualization is essential for risk analysis, allowing analysts to assess whether returns follow a normal distribution, identify fat tails indicating higher-than-expected extreme events, and measure asymmetry through skewness. Key statistics are displayed directly on the plot for quick interpretation.
// anyplot.ai
// histogram-returns-distribution: Returns Distribution Histogram
// Library: muix 7.29.1 | JavaScript 22.23.2
// Quality: 93/100 | Created: 2026-09-02
import { ChartContainer } from "@mui/x-charts/ChartContainer";
import { BarPlot } from "@mui/x-charts/BarChart";
import { LinePlot } from "@mui/x-charts/LineChart";
import { ChartsXAxis } from "@mui/x-charts/ChartsXAxis";
import { ChartsYAxis } from "@mui/x-charts/ChartsYAxis";
import { ChartsGrid } from "@mui/x-charts/ChartsGrid";
import { ChartsLegend } from "@mui/x-charts/ChartsLegend";
import { ChartsTooltip } from "@mui/x-charts/ChartsTooltip";
import { ChartsReferenceLine } from "@mui/x-charts/ChartsReferenceLine";

const t = window.ANYPLOT_TOKENS;

// --- Data: one trading year of daily returns (fixed-seed LCG, deterministic) -
let seed = 42;
function rand() {
  seed = (seed * 1103515245 + 12345) & 0x7fffffff;
  return seed / 0x7fffffff;
}
function randNormal() {
  const u1 = Math.max(rand(), 1e-12);
  const u2 = rand();
  return Math.sqrt(-2 * Math.log(u1)) * Math.cos(2 * Math.PI * u2);
}

const N_DAYS = 252;
const DAILY_VOL = 1.15; // percent
const DRIFT = 0.04; // percent, slight positive drift
const dailyReturns = [];
for (let i = 0; i < N_DAYS; i += 1) {
  let r = DRIFT + randNormal() * DAILY_VOL;
  // Occasional volatility shock days give the distribution a fat, negatively
  // skewed left tail — the "crash risk" pattern real equity returns show.
  if (rand() < 0.06) {
    r -= Math.abs(randNormal()) * DAILY_VOL * 2.2;
  }
  dailyReturns.push(r);
}

const n = dailyReturns.length;
const mean = dailyReturns.reduce((a, b) => a + b, 0) / n;
const variance = dailyReturns.reduce((a, b) => a + (b - mean) ** 2, 0) / n;
const std = Math.sqrt(variance);
const skewness = dailyReturns.reduce((a, b) => a + ((b - mean) / std) ** 3, 0) / n;
const excessKurtosis =
  dailyReturns.reduce((a, b) => a + ((b - mean) / std) ** 4, 0) / n - 3;

// --- Histogram bins, density-normalized so the normal curve is comparable ---
const BIN_COUNT = 26;
const minReturn = Math.min(...dailyReturns);
const maxReturn = Math.max(...dailyReturns);
const binWidth = (maxReturn - minReturn) / BIN_COUNT;
const binCounts = new Array(BIN_COUNT).fill(0);
dailyReturns.forEach((r) => {
  const idx = Math.min(BIN_COUNT - 1, Math.max(0, Math.floor((r - minReturn) / binWidth)));
  binCounts[idx] += 1;
});
const binCenters = binCounts.map((_, i) => minReturn + binWidth * (i + 0.5));
const density = binCounts.map((c) => c / (n * binWidth));

function normalPdf(x, mu, sigma) {
  return Math.exp(-0.5 * ((x - mu) / sigma) ** 2) / (sigma * Math.sqrt(2 * Math.PI));
}
const normalCurve = binCenters.map((c) => normalPdf(c, mean, std));

// Tail regions beyond +/-2 standard deviations get a distinct color. Both bar
// series are stacked so, per bin, only the applicable one contributes height —
// this renders as a single two-tone histogram rather than grouped bars.
const lowerTail = mean - 2 * std;
const upperTail = mean + 2 * std;
const coreDensity = density.map((d, i) => (binCenters[i] < lowerTail || binCenters[i] > upperTail ? 0 : d));
const tailDensity = density.map((d, i) => (binCenters[i] < lowerTail || binCenters[i] > upperTail ? d : 0));

// Band scale reference lines need an exact category value, so snap to the bin
// center closest to the mean.
const meanBinCenter = binCenters.reduce((closest, c) =>
  Math.abs(c - mean) < Math.abs(closest - mean) ? c : closest
);

const pct = (v) => `${v.toFixed(1)}%`;

// --- Chart (default-exported component — the harness mounts it) -------------
export default function Chart() {
  const { width, height } = window.ANYPLOT_SIZE;
  const titleHeight = 56;
  const chartHeight = height - titleHeight;

  return (
    <div style={{ width, height, display: "flex", flexDirection: "column" }}>
      <div
        style={{
          height: titleHeight,
          display: "flex",
          alignItems: "center",
          justifyContent: "center",
          fontSize: 22,
          fontWeight: 600,
          color: t.ink,
        }}
      >
        histogram-returns-distribution · javascript · muix · anyplot.ai
      </div>

      <div style={{ position: "relative", width, height: chartHeight }}>
        <ChartContainer
          width={width}
          height={chartHeight}
          margin={{ top: 90, right: 40, bottom: 70, left: 90 }}
          series={[
            {
              type: "bar",
              data: coreDensity,
              stack: "bins",
              color: t.palette[0],
              label: "Within ±2σ",
              valueFormatter: (v) => (v ? v.toFixed(3) : null),
            },
            {
              type: "bar",
              data: tailDensity,
              stack: "bins",
              color: t.amber,
              label: "Beyond ±2σ (tail)",
              valueFormatter: (v) => (v ? v.toFixed(3) : null),
            },
            {
              type: "line",
              data: normalCurve,
              color: t.ink,
              label: "Normal fit",
              showMark: false,
              curve: "natural",
              valueFormatter: (v) => v.toFixed(3),
            },
          ]}
          xAxis={[
            {
              scaleType: "band",
              data: binCenters,
              categoryGapRatio: 0.05,
              valueFormatter: pct,
              label: "Daily Return (%)",
              labelStyle: { fill: t.ink, fontSize: 16 },
              tickLabelStyle: { fill: t.inkSoft, fontSize: 14 },
              tickLabelInterval: (_, i) => i % 3 === 0,
            },
          ]}
          yAxis={[
            {
              label: "Density",
              labelStyle: { fill: t.ink, fontSize: 16 },
              tickLabelStyle: { fill: t.inkSoft, fontSize: 14 },
              valueFormatter: (v) => v.toFixed(2),
            },
          ]}
        >
          <ChartsGrid horizontal />
          <BarPlot skipAnimation borderRadius={2} />
          <LinePlot skipAnimation />
          <ChartsReferenceLine
            x={meanBinCenter}
            label="Mean"
            labelStyle={{ fill: t.inkSoft, fontSize: 13 }}
            lineStyle={{ stroke: t.ink, strokeDasharray: "6 4", strokeWidth: 1.5 }}
          />
          <ChartsXAxis />
          <ChartsYAxis />
          <ChartsLegend position={{ vertical: "top", horizontal: "right" }} direction="row" />
          <ChartsTooltip trigger="item" />
        </ChartContainer>

        <div
          style={{
            position: "absolute",
            top: 16,
            left: 100,
            background: t.elevatedBg,
            border: `1px solid ${t.grid}`,
            borderRadius: 8,
            padding: "12px 18px",
            fontSize: 15,
            lineHeight: 1.6,
            color: t.ink,
            minWidth: 190,
          }}
        >
          <div style={{ fontWeight: 600, marginBottom: 4 }}>Return statistics</div>
          <div style={{ color: t.inkSoft }}>Mean: {pct(mean)}</div>
          <div style={{ color: t.inkSoft }}>Std dev: {pct(std)}</div>
          <div style={{ color: t.inkSoft }}>Skewness: {skewness.toFixed(2)}</div>
          <div style={{ color: t.inkSoft }}>Kurtosis: {excessKurtosis.toFixed(2)}</div>
        </div>
      </div>
    </div>
  );
}
Runnable source as JSON, for any HTTP client: https://api.anyplot.ai/specs/histogram-returns-distribution/muix/code. Any spec id and library id listed in llms-full.txt fit the same URL shape; every URL below is complete and callable.
{
  "spec_id": "histogram-returns-distribution",
  "language": "javascript",
  "library": "muix",
  "page": "https://anyplot.ai/histogram-returns-distribution/javascript/muix",
  "hub": "https://anyplot.ai/histogram-returns-distribution",
  "code_json": "https://api.anyplot.ai/specs/histogram-returns-distribution/muix/code",
  "spec_json": "https://api.anyplot.ai/specs/histogram-returns-distribution",
  "render_light_png": "https://storage.googleapis.com/anyplot-images/plots/histogram-returns-distribution/javascript/muix/plot-light.png",
  "render_dark_png": "https://storage.googleapis.com/anyplot-images/plots/histogram-returns-distribution/javascript/muix/plot-dark.png",
  "interactive_light_html": "https://storage.googleapis.com/anyplot-images/plots/histogram-returns-distribution/javascript/muix/plot-light.html",
  "interactive_dark_html": "https://storage.googleapis.com/anyplot-images/plots/histogram-returns-distribution/javascript/muix/plot-dark.html",
  "quality_score": 93.0,
  "license": "MIT",
  "guide": "https://anyplot.ai/llms.txt"
}
Part of Returns Distribution Histogram on anyplot.ai.