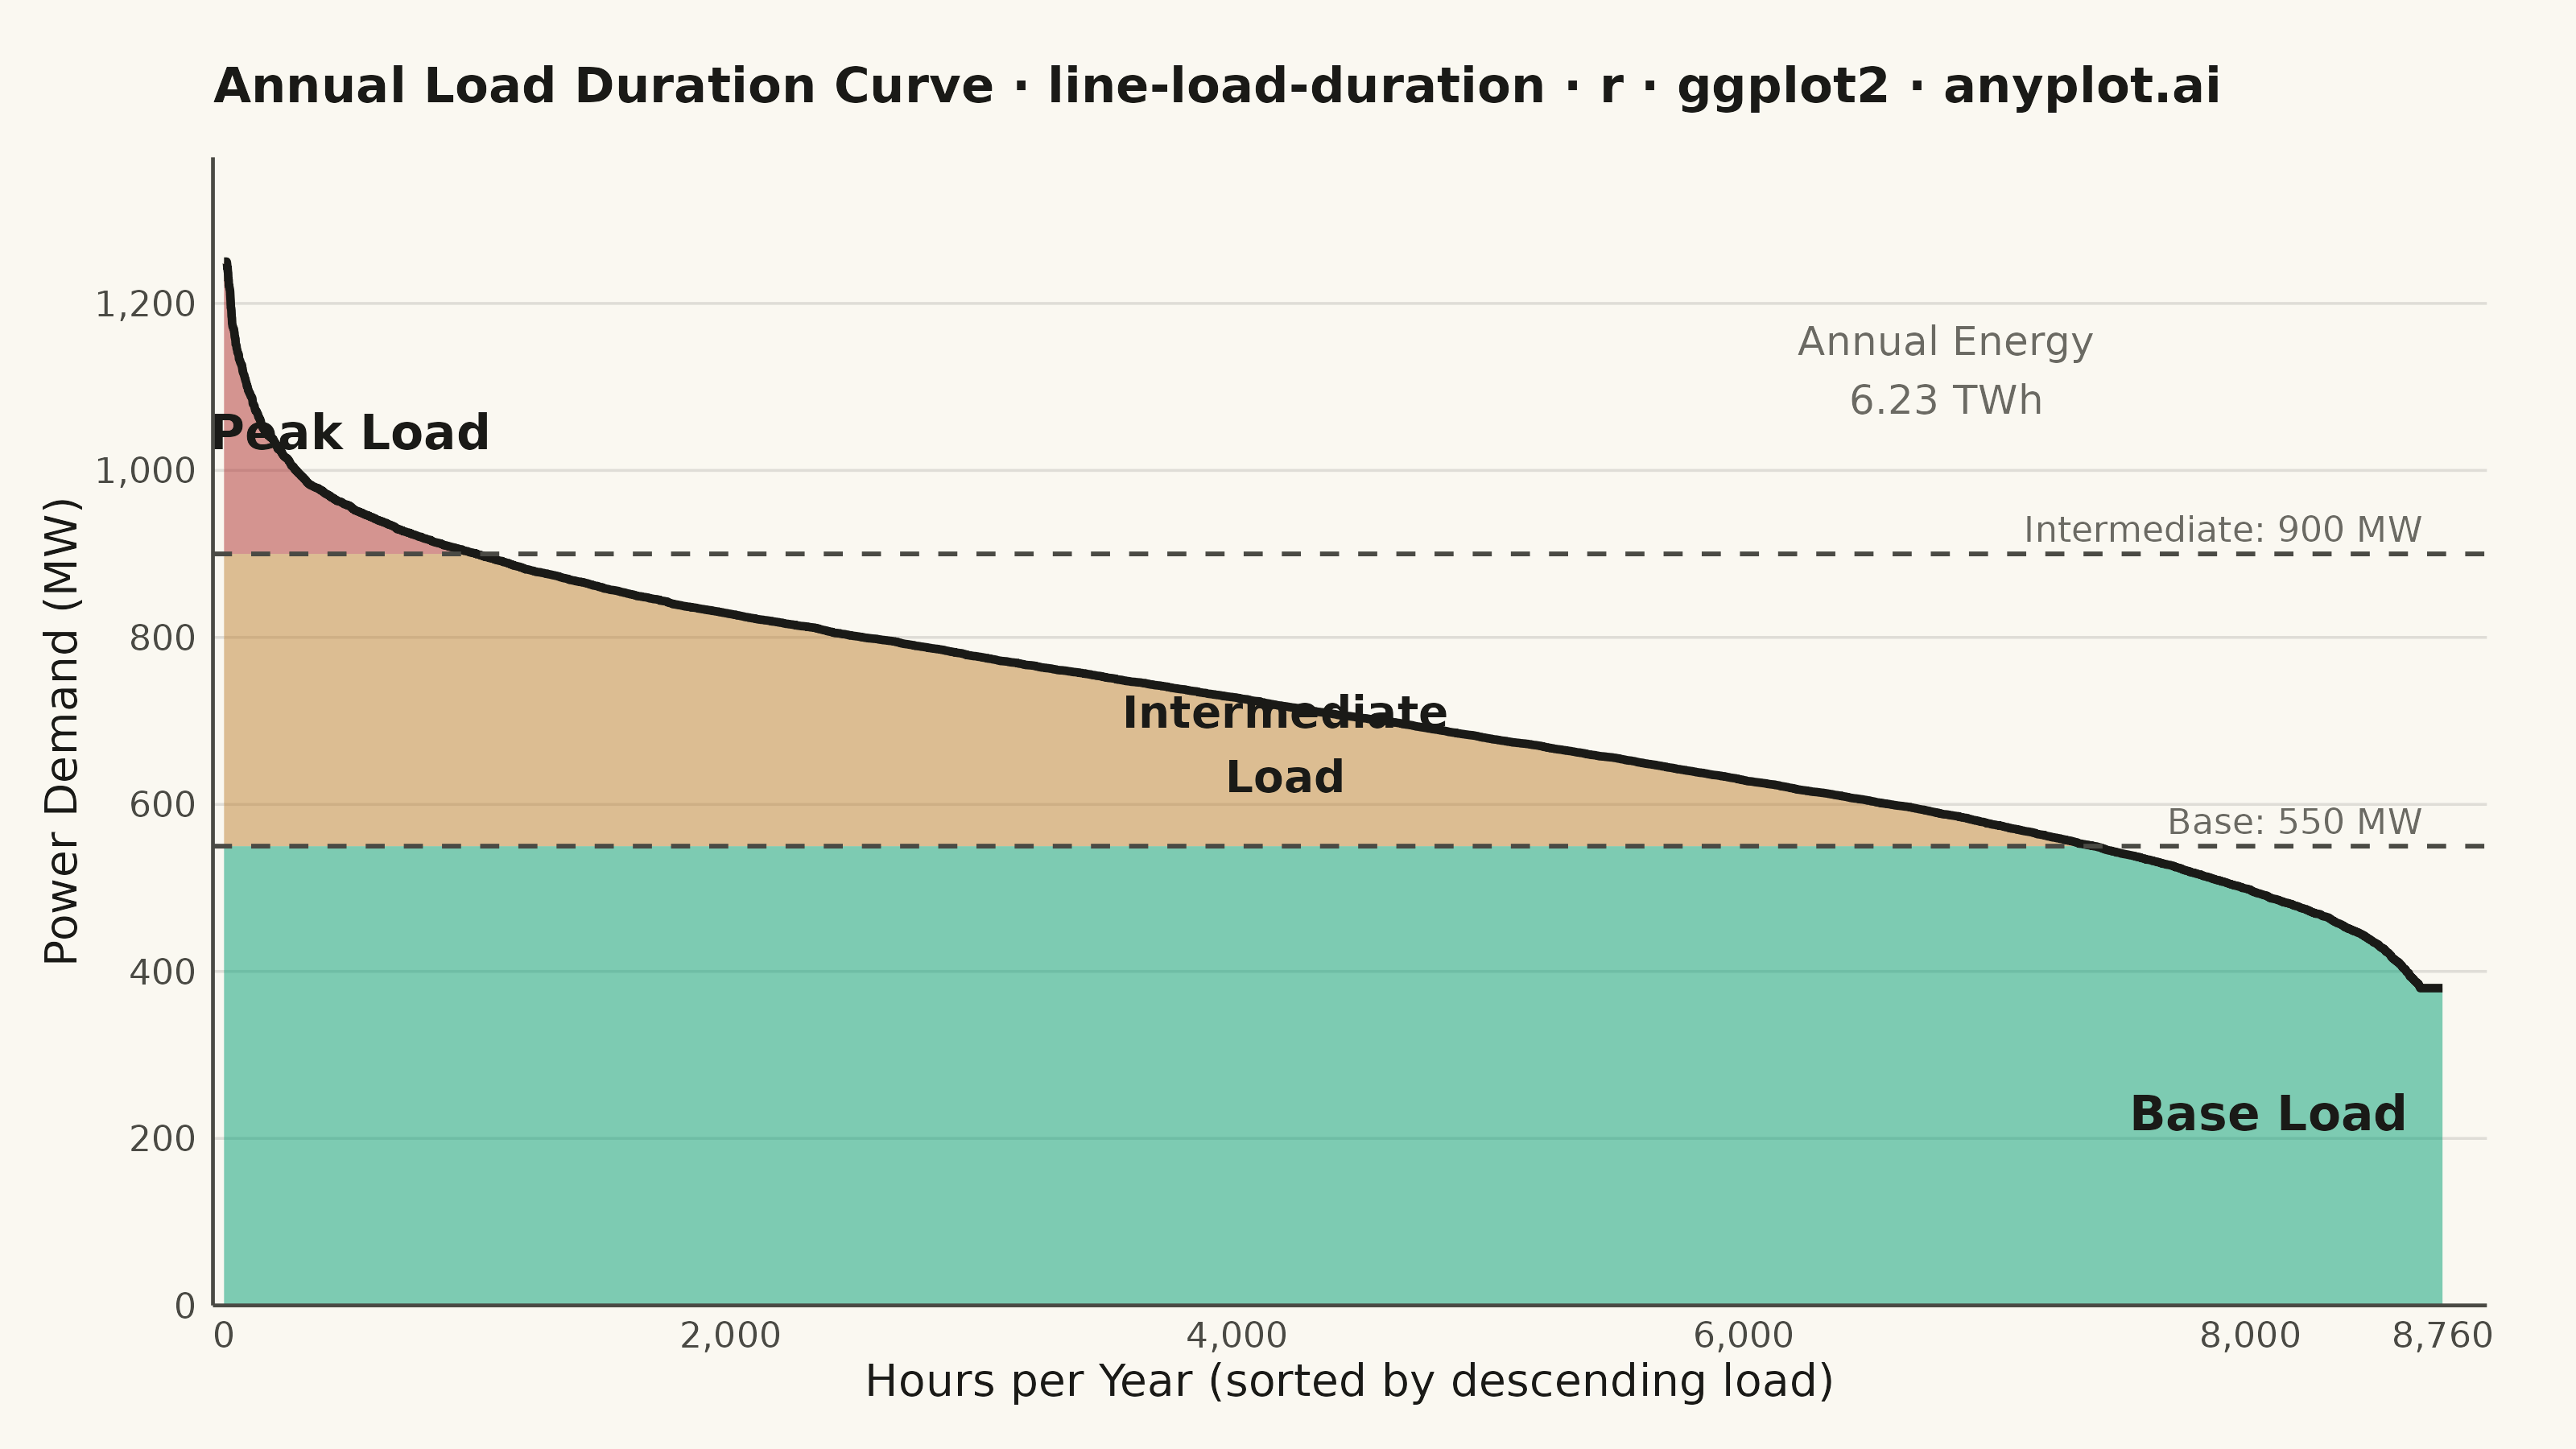
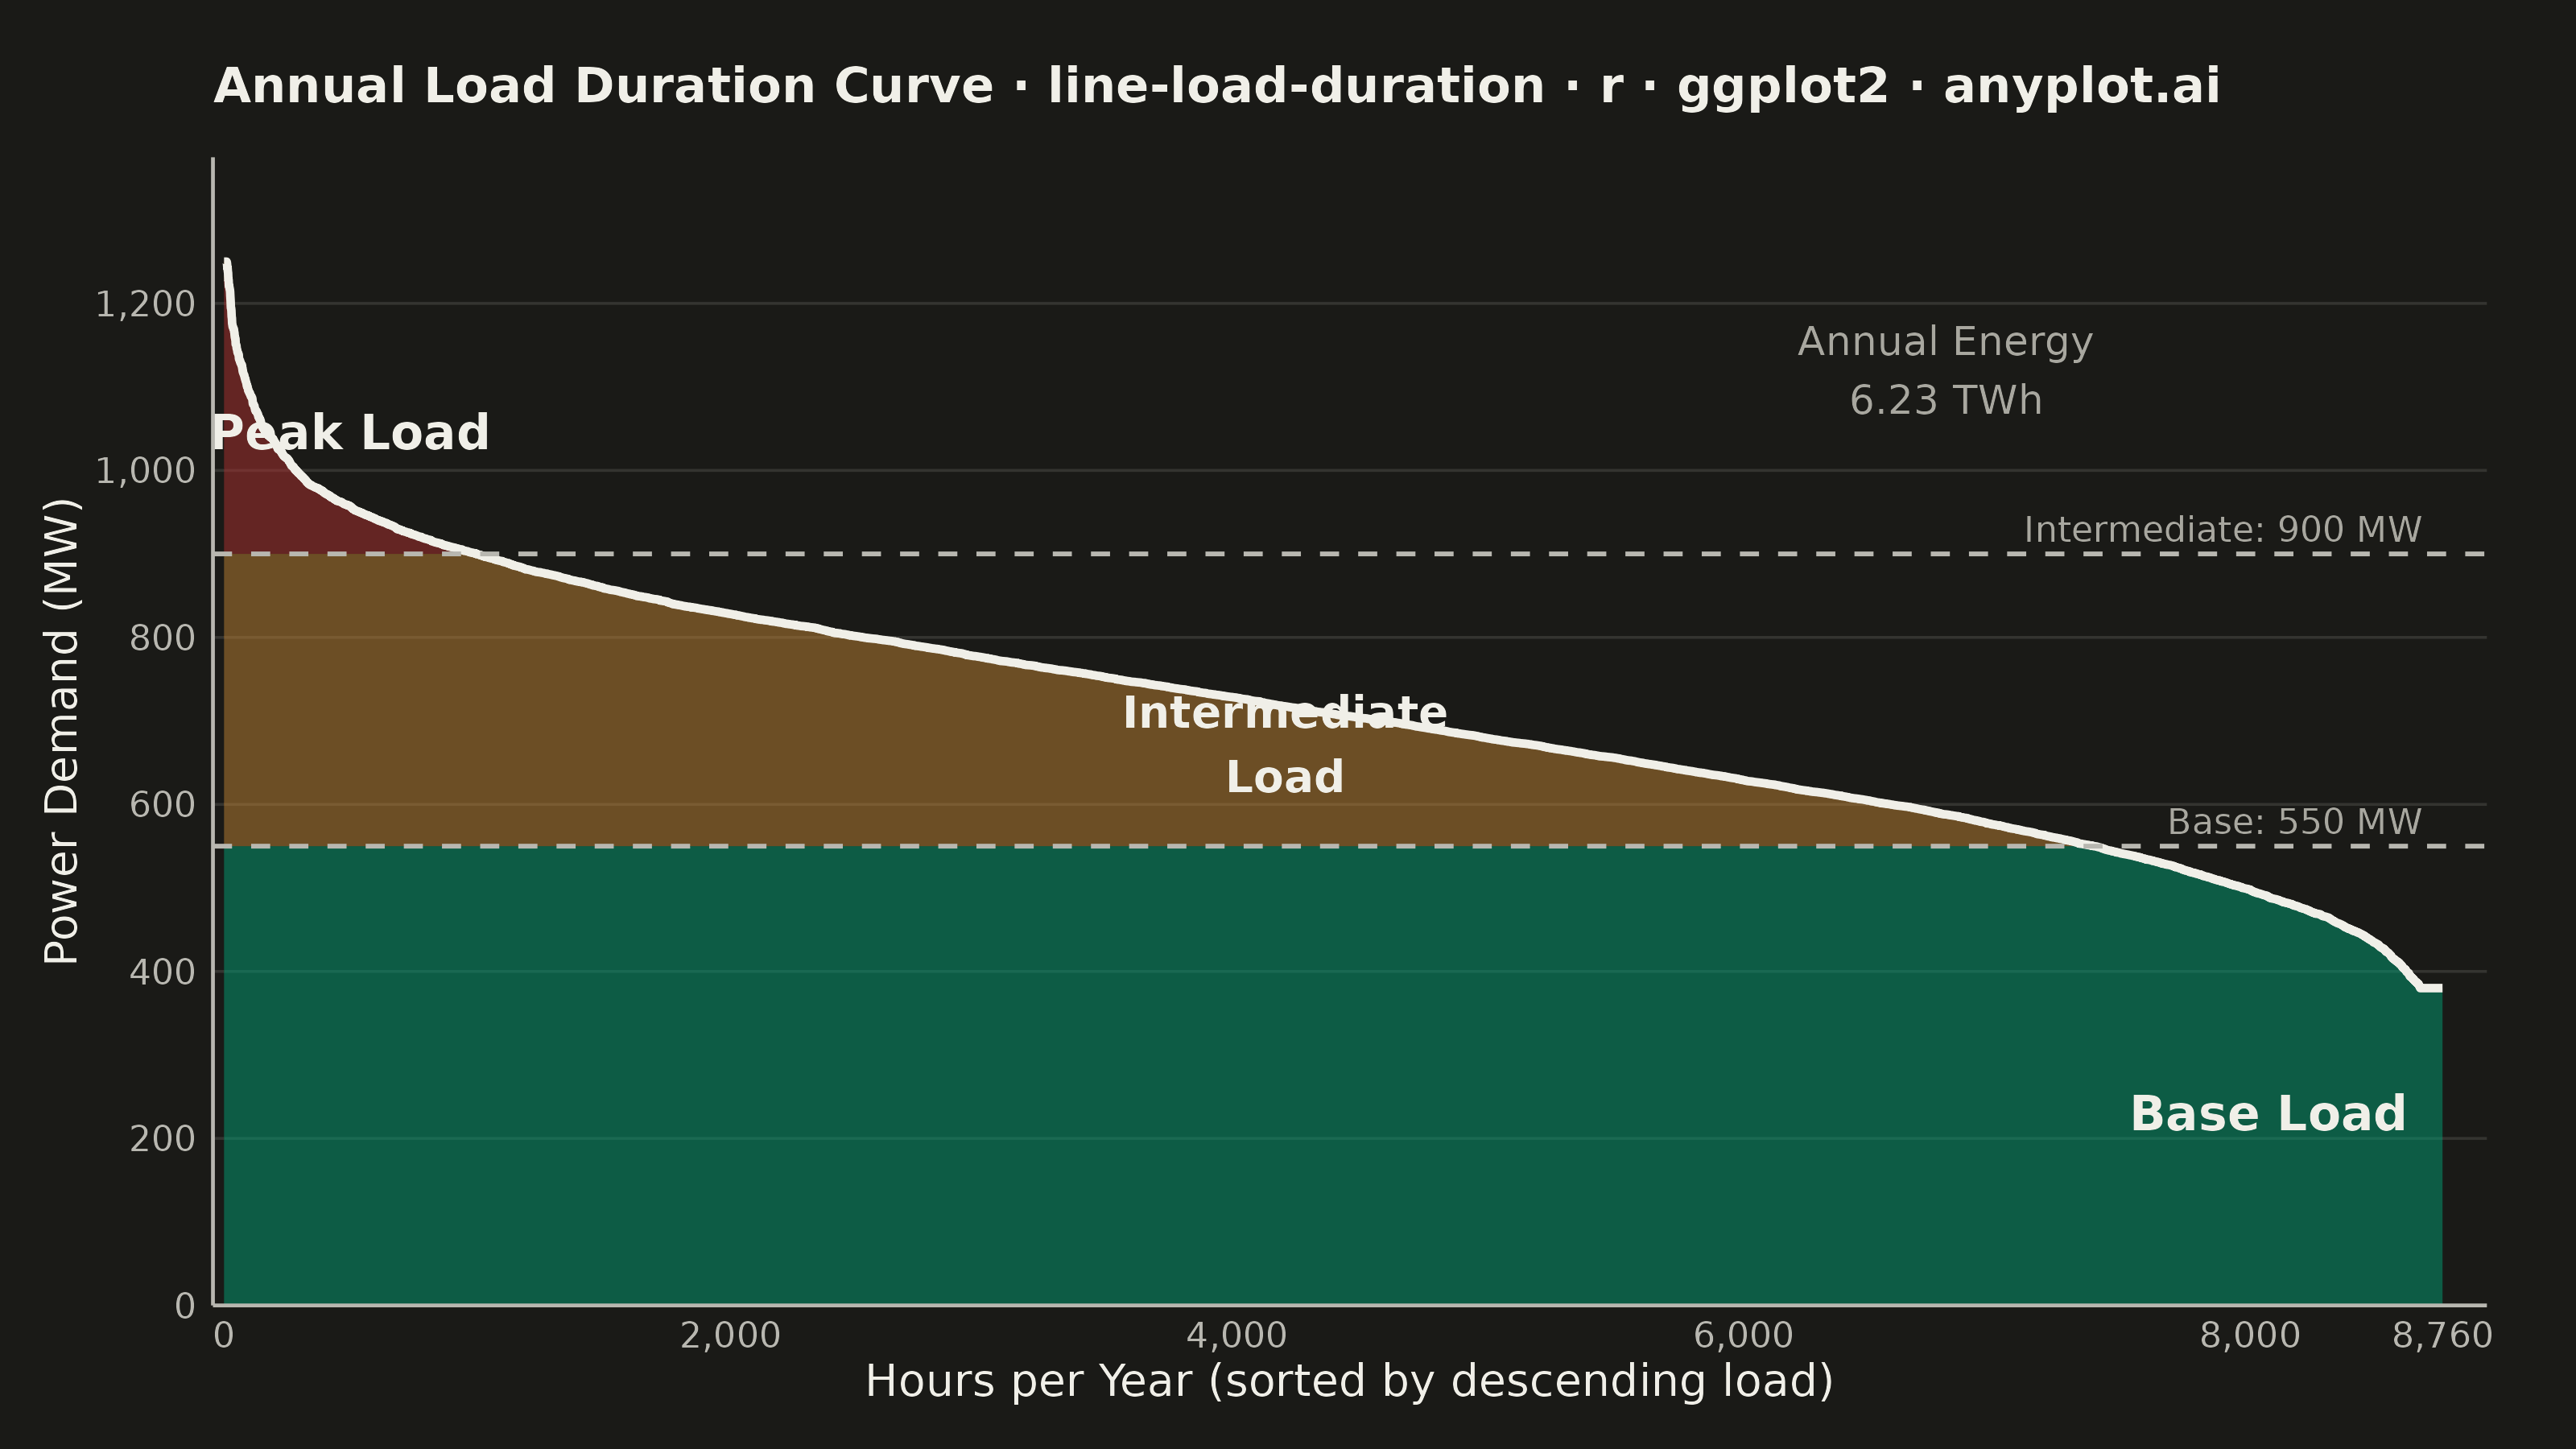
A load duration curve displays electrical power demand (MW) sorted from highest to lowest across all hours of a year (8,760 hours), forming a monotonically decreasing curve. It is a fundamental tool in power system planning, revealing the proportion of time that load exceeds a given level. The curve naturally segments into peak, intermediate, and base load regions, helping utilities determine the optimal generation capacity mix. The area under the curve represents total annual energy consumption.
Preview render from the ggplot2 implementation.