The same plot in 14 other libraries — JavaScript: Chart.js, D3.js, Highcharts, MUI X Charts; Python: Altair, Bokeh, lets-plot, Matplotlib, Plotly, plotnine, Pygal, Seaborn; R: ggplot2; Julia: Makie.jl. Compare all 15 side by side: Load Duration Curve for Energy Systems in Python, R, Julia and JavaScript.
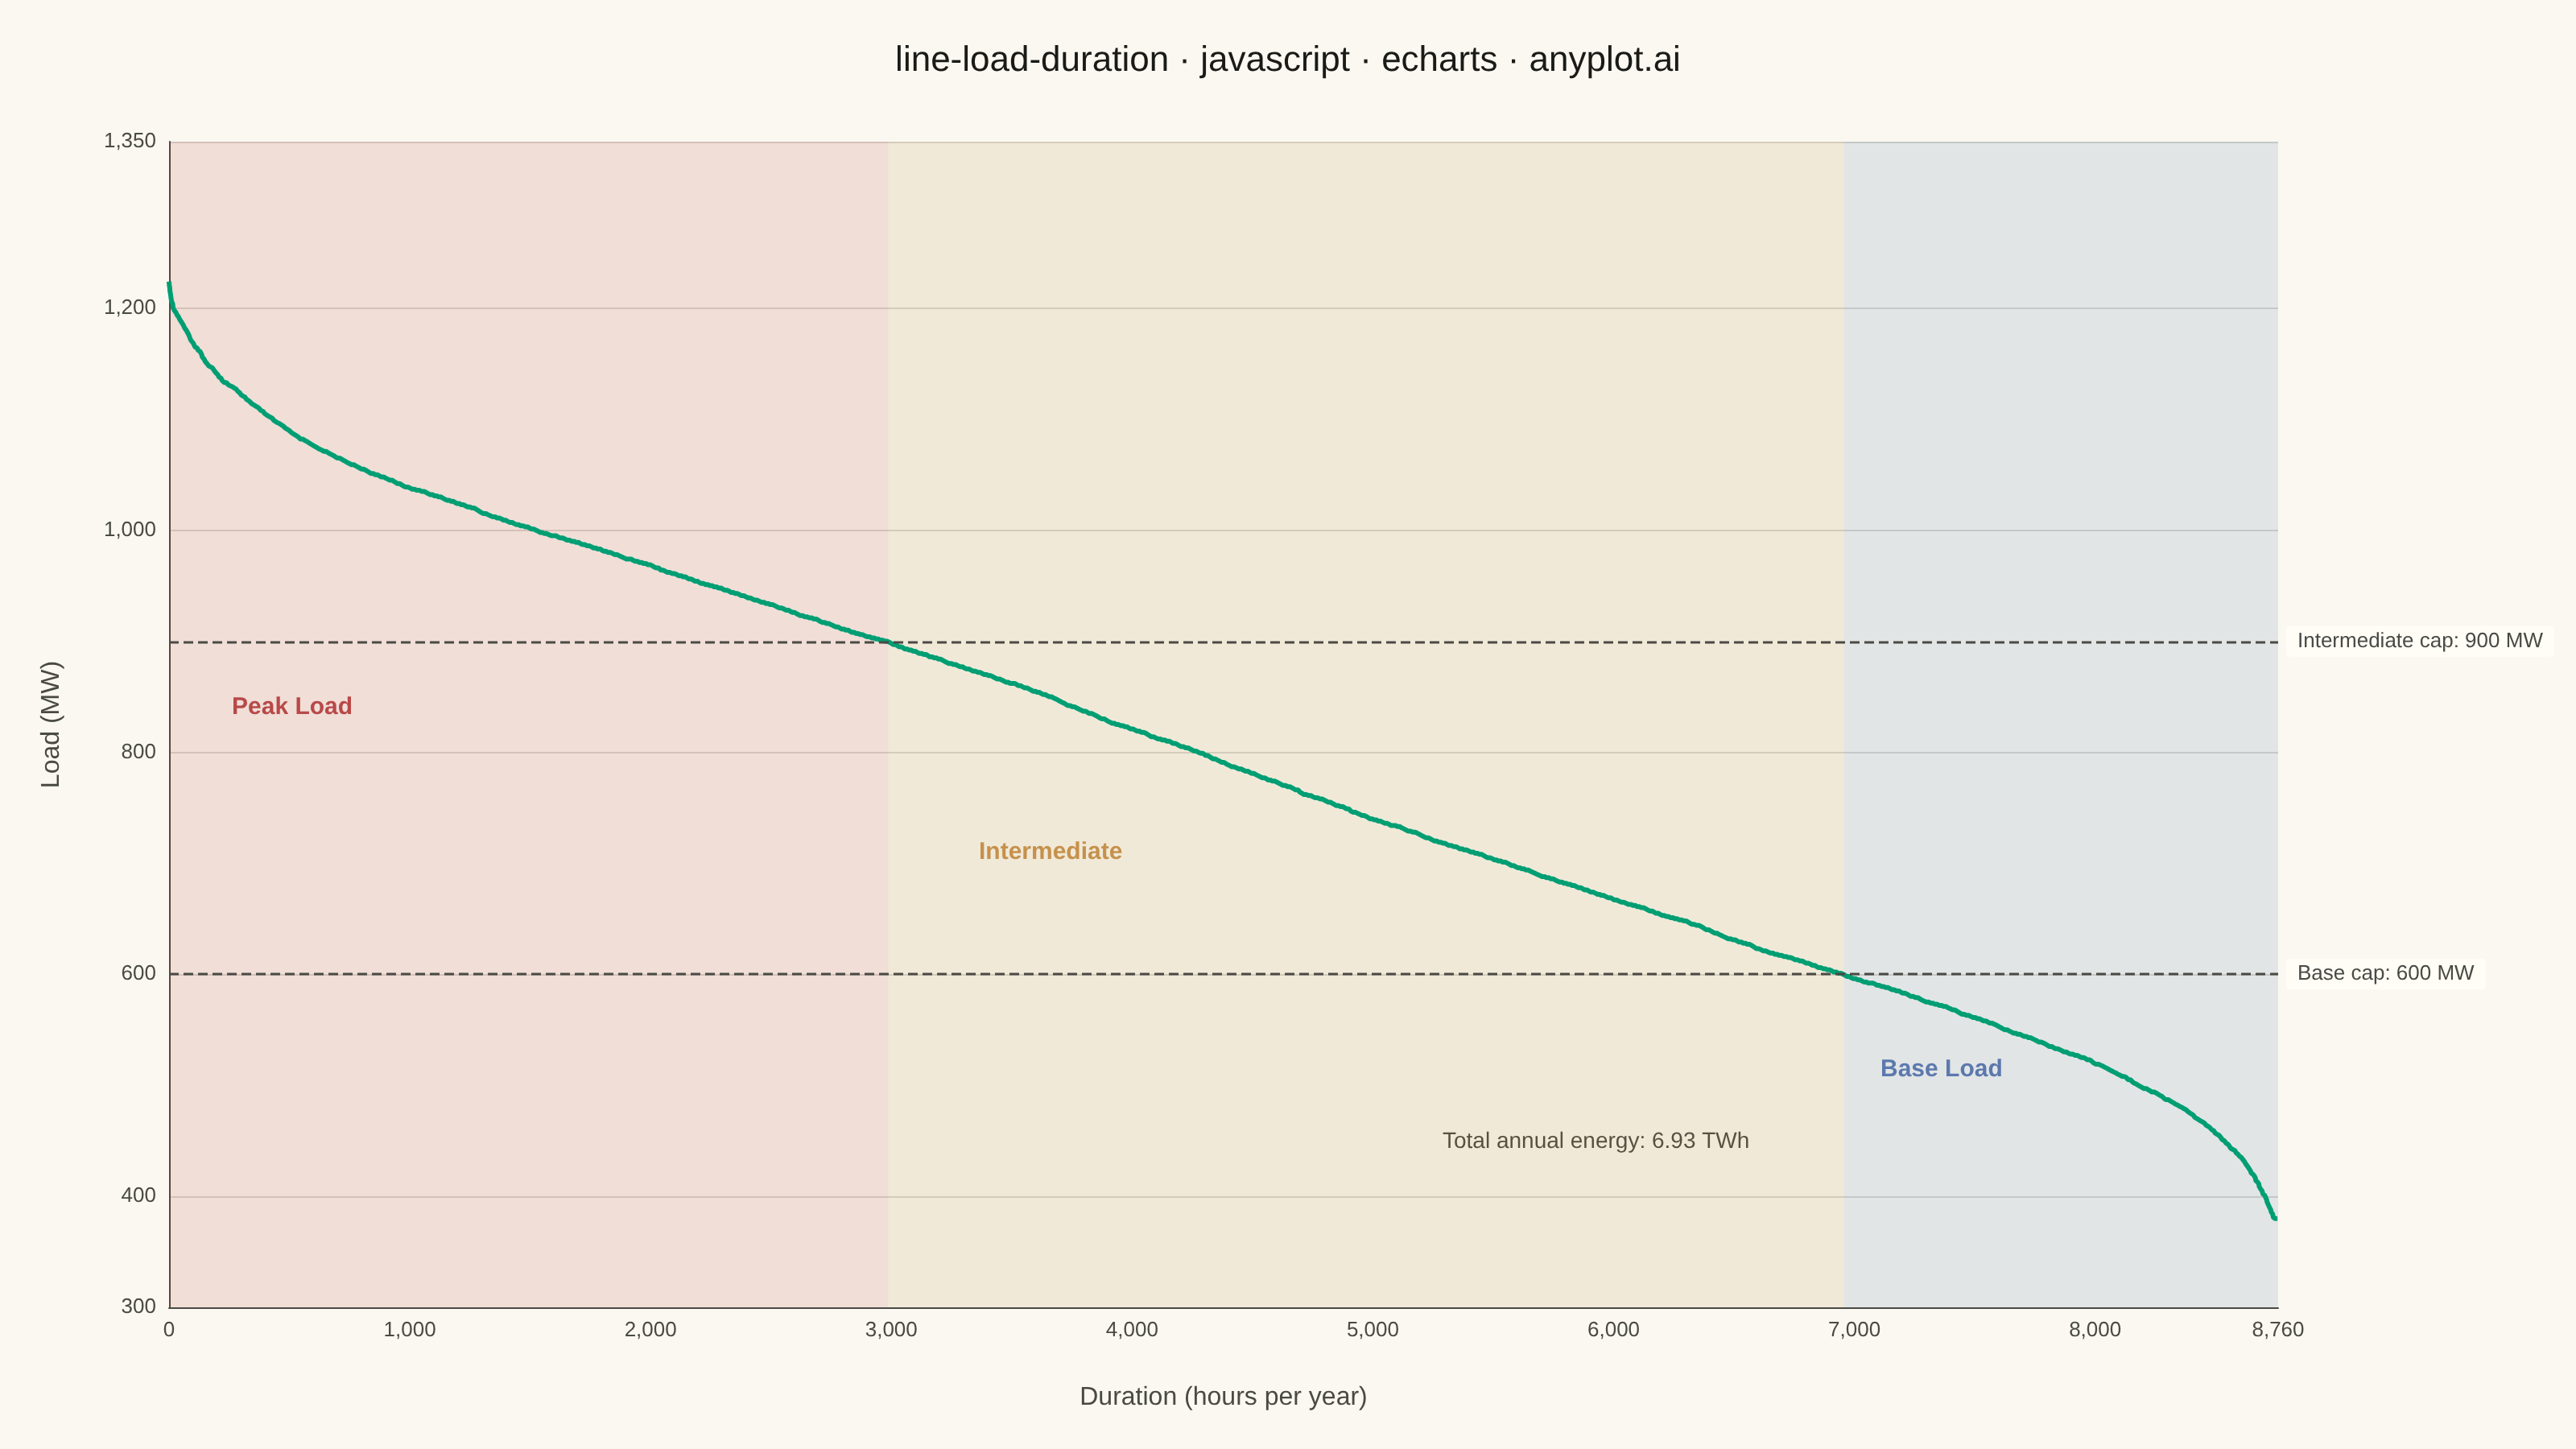
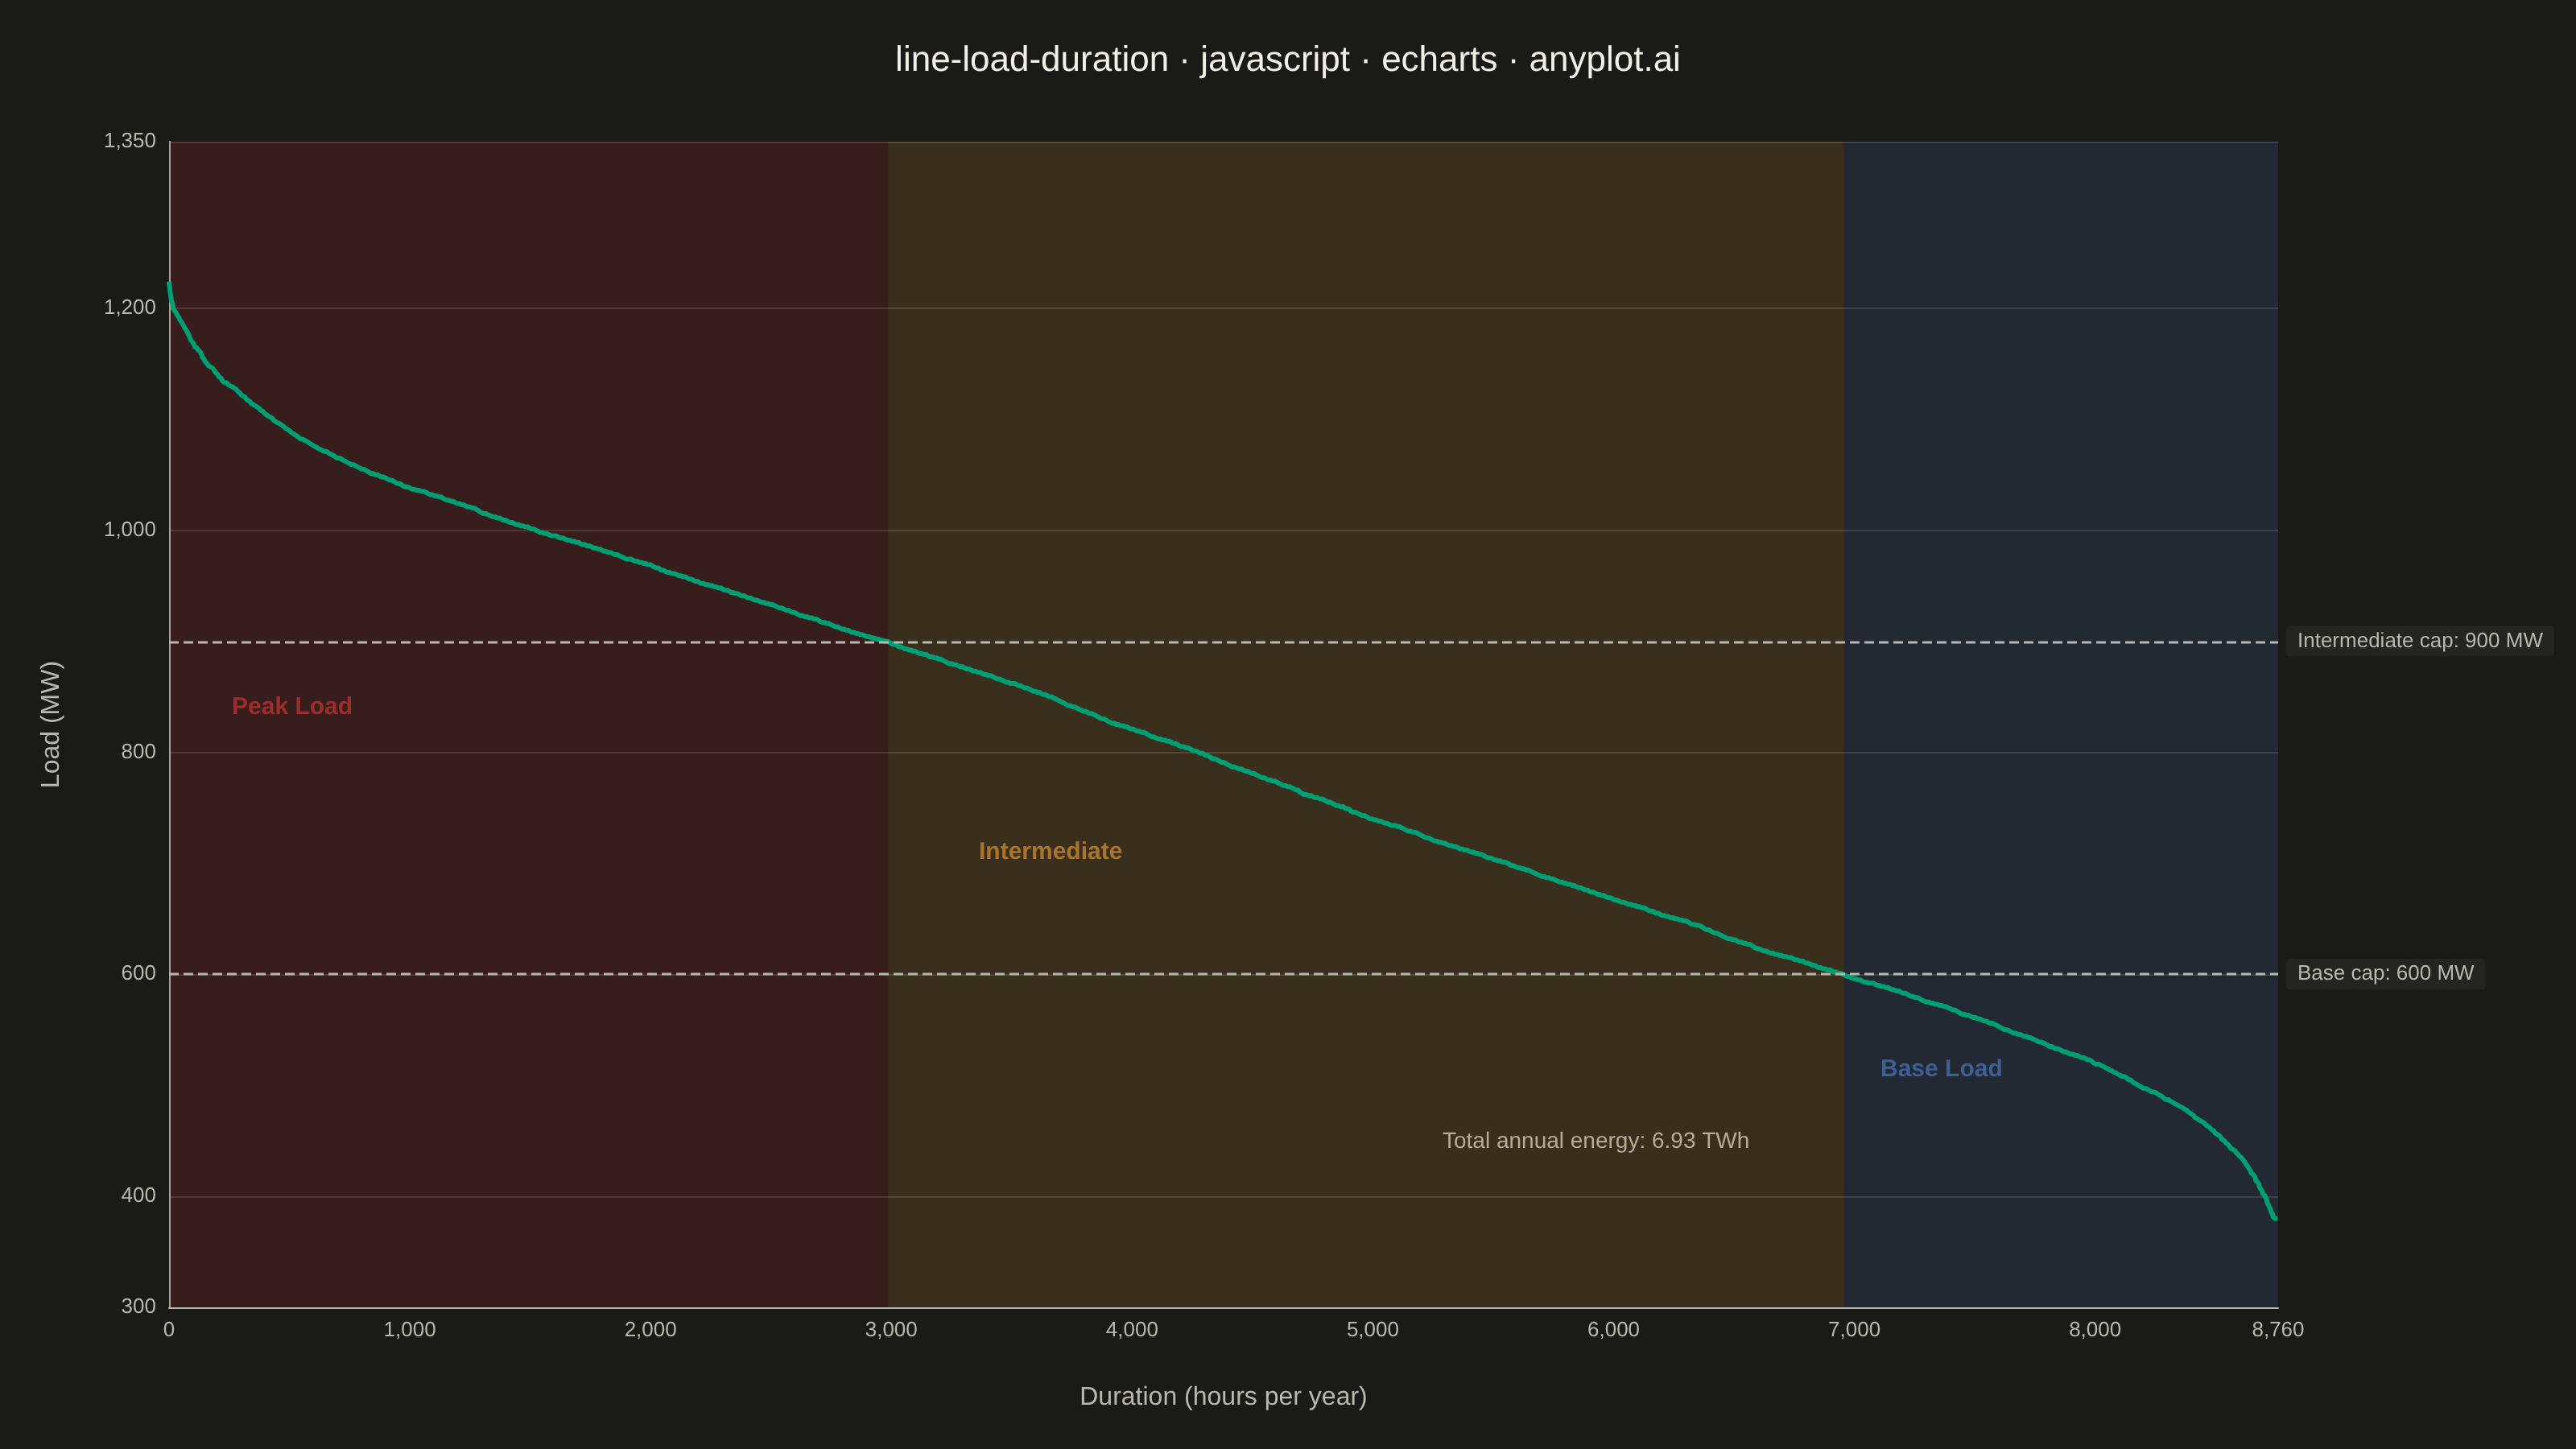
A load duration curve displays electrical power demand (MW) sorted from highest to lowest across all hours of a year (8,760 hours), forming a monotonically decreasing curve. It is a fundamental tool in power system planning, revealing the proportion of time that load exceeds a given level. The curve naturally segments into peak, intermediate, and base load regions, helping utilities determine the optimal generation capacity mix. The area under the curve represents total annual energy consumption.
// anyplot.ai
// line-load-duration: Load Duration Curve for Energy Systems
// Library: echarts 5.5.1 | JavaScript 22.22.3
// Quality: 90/100 | Created: 2026-06-10

const t = window.ANYPLOT_TOKENS;
const isDark = window.ANYPLOT_THEME === "dark";

// Convert hex palette entry to rgba string
function hexAlpha(hex, alpha) {
    const r = parseInt(hex.slice(1, 3), 16);
    const g = parseInt(hex.slice(3, 5), 16);
    const b = parseInt(hex.slice(5, 7), 16);
    return `rgba(${r},${g},${b},${alpha})`;
}

// Region fill alpha — higher in dark mode to preserve contrast
const fillAlpha = isDark ? 0.20 : 0.13;
const peakFill  = hexAlpha(t.palette[4], fillAlpha);   // matte red #AE3030
const interFill = hexAlpha(t.palette[3], fillAlpha);   // ochre     #BD8233
const baseFill  = hexAlpha(t.palette[2], fillAlpha);   // blue      #4467A3

const peakLabel  = hexAlpha(t.palette[4], 0.85);
const interLabel = hexAlpha(t.palette[3], 0.85);
const baseLabel  = hexAlpha(t.palette[2], 0.85);

// Deterministic LCG random number generator (seed 42)
let _s = 42;
function rnd() {
    _s = (Math.imul(_s, 1664525) + 1013904223) >>> 0;
    return _s / 4294967295;
}

// Synthetic annual hourly load: seasonal + daily patterns + noise
const raw = Array.from({length: 8760}, function(_, h) {
    const seasonal = 250 * Math.cos((Math.floor(h / 24) / 365) * 2 * Math.PI);
    const daily    =  90 * Math.sin(((h % 24 - 3) / 24) * 2 * Math.PI);
    return Math.max(380, 790 + seasonal + daily + (rnd() - 0.5) * 190);
});

// Sort descending → load duration curve
raw.sort(function(a, b) { return b - a; });
const load = raw.map(function(v) { return Math.round(v); });

// Total annual energy (MWh — one value per hour)
const totalMWh = load.reduce(function(s, v) { return s + v; }, 0);
const totalTWh = (totalMWh / 1e6).toFixed(2);

// Region boundaries where load crosses generation capacity thresholds
const PEAK_CAP = 900;   // MW — peaking plant threshold
const BASE_CAP = 600;   // MW — base-load plant threshold
const peakEnd  = load.findIndex(function(v) { return v < PEAK_CAP; });
const interEnd = load.findIndex(function(v) { return v < BASE_CAP; });

const chart = echarts.init(document.getElementById("container"));

chart.setOption({
    animation: false,
    color: t.palette,
    backgroundColor: "transparent",

    title: {
        text: "line-load-duration · javascript · echarts · anyplot.ai",
        left: "center",
        top: 22,
        textStyle: { color: t.ink, fontSize: 22, fontWeight: "500" }
    },

    grid: { left: 105, right: 185, top: 88, bottom: 88 },

    xAxis: {
        type: "value",
        name: "Duration (hours per year)",
        nameLocation: "middle",
        nameGap: 48,
        min: 0,
        max: 8760,
        interval: 1000,
        nameTextStyle: { color: t.inkSoft, fontSize: 16 },
        axisLabel:  { color: t.inkSoft, fontSize: 13 },
        axisLine:   { lineStyle: { color: t.inkSoft } },
        axisTick:   { show: false },
        splitLine:  { show: false },
    },

    yAxis: {
        type: "value",
        name: "Load (MW)",
        nameLocation: "middle",
        nameGap: 65,
        min: 300,
        max: 1350,
        nameTextStyle: { color: t.inkSoft, fontSize: 16 },
        axisLabel:  { color: t.inkSoft, fontSize: 13 },
        axisLine:   { lineStyle: { color: t.inkSoft } },
        axisTick:   { show: false },
        splitLine:  { lineStyle: { color: t.grid, width: 1 } },
    },

    series: [{
        type: "line",
        data: load.map(function(v, i) { return [i, v]; }),
        showSymbol: false,
        lineStyle: { color: t.palette[0], width: 3 },

        markLine: {
            silent: true,
            symbol: "none",
            lineStyle: { type: "dashed", color: t.inkSoft, width: 1.5 },
            label: {
                show: true,
                position: "end",
                fontSize: 13,
                color: t.inkSoft,
                backgroundColor: t.elevatedBg,
                padding: [3, 7],
                borderRadius: 2,
            },
            data: [
                { yAxis: PEAK_CAP, label: { formatter: "Intermediate cap: " + PEAK_CAP + " MW" } },
                { yAxis: BASE_CAP, label: { formatter: "Base cap: "         + BASE_CAP + " MW" } },
            ]
        },

        markArea: {
            silent: true,
            data: [
                [
                    { xAxis: 0,        itemStyle: { color: peakFill  } },
                    { xAxis: peakEnd }
                ],
                [
                    { xAxis: peakEnd,  itemStyle: { color: interFill } },
                    { xAxis: interEnd }
                ],
                [
                    { xAxis: interEnd, itemStyle: { color: baseFill  } },
                    { xAxis: 8760 }
                ],
            ]
        },
    }],

    graphic: [
        {
            type: "text",
            left: "9%",
            top: "48%",
            style: { text: "Peak Load",    fontSize: 15, fontWeight: "bold", fill: peakLabel  }
        },
        {
            type: "text",
            left: "38%",
            top: "58%",
            style: { text: "Intermediate", fontSize: 15, fontWeight: "bold", fill: interLabel }
        },
        {
            type: "text",
            left: "73%",
            top: "73%",
            style: { text: "Base Load",    fontSize: 15, fontWeight: "bold", fill: baseLabel  }
        },
        {
            type: "text",
            left: "56%",
            top: "78%",
            style: { text: "Total annual energy: " + totalTWh + " TWh", fontSize: 14, fill: t.inkSoft }
        },
    ],
});
Runnable source as JSON, for any HTTP client: https://api.anyplot.ai/specs/line-load-duration/echarts/code. Any spec id and library id listed in llms-full.txt fit the same URL shape; every URL below is complete and callable.
{
  "spec_id": "line-load-duration",
  "language": "javascript",
  "library": "echarts",
  "page": "https://anyplot.ai/line-load-duration/javascript/echarts",
  "hub": "https://anyplot.ai/line-load-duration",
  "code_json": "https://api.anyplot.ai/specs/line-load-duration/echarts/code",
  "spec_json": "https://api.anyplot.ai/specs/line-load-duration",
  "render_light_png": "https://storage.googleapis.com/anyplot-images/plots/line-load-duration/javascript/echarts/plot-light.png",
  "render_dark_png": "https://storage.googleapis.com/anyplot-images/plots/line-load-duration/javascript/echarts/plot-dark.png",
  "interactive_light_html": "https://storage.googleapis.com/anyplot-images/plots/line-load-duration/javascript/echarts/plot-light.html",
  "interactive_dark_html": "https://storage.googleapis.com/anyplot-images/plots/line-load-duration/javascript/echarts/plot-dark.html",
  "quality_score": 90.0,
  "license": "MIT",
  "guide": "https://anyplot.ai/llms.txt"
}
Part of Load Duration Curve for Energy Systems on anyplot.ai.