The same plot in 14 other libraries — JavaScript: D3.js, Apache ECharts, Highcharts, MUI X Charts; Python: Altair, Bokeh, lets-plot, Matplotlib, Plotly, plotnine, Pygal, Seaborn; R: ggplot2; Julia: Makie.jl. Compare all 15 side by side: Load Duration Curve for Energy Systems in Python, R, Julia and JavaScript.
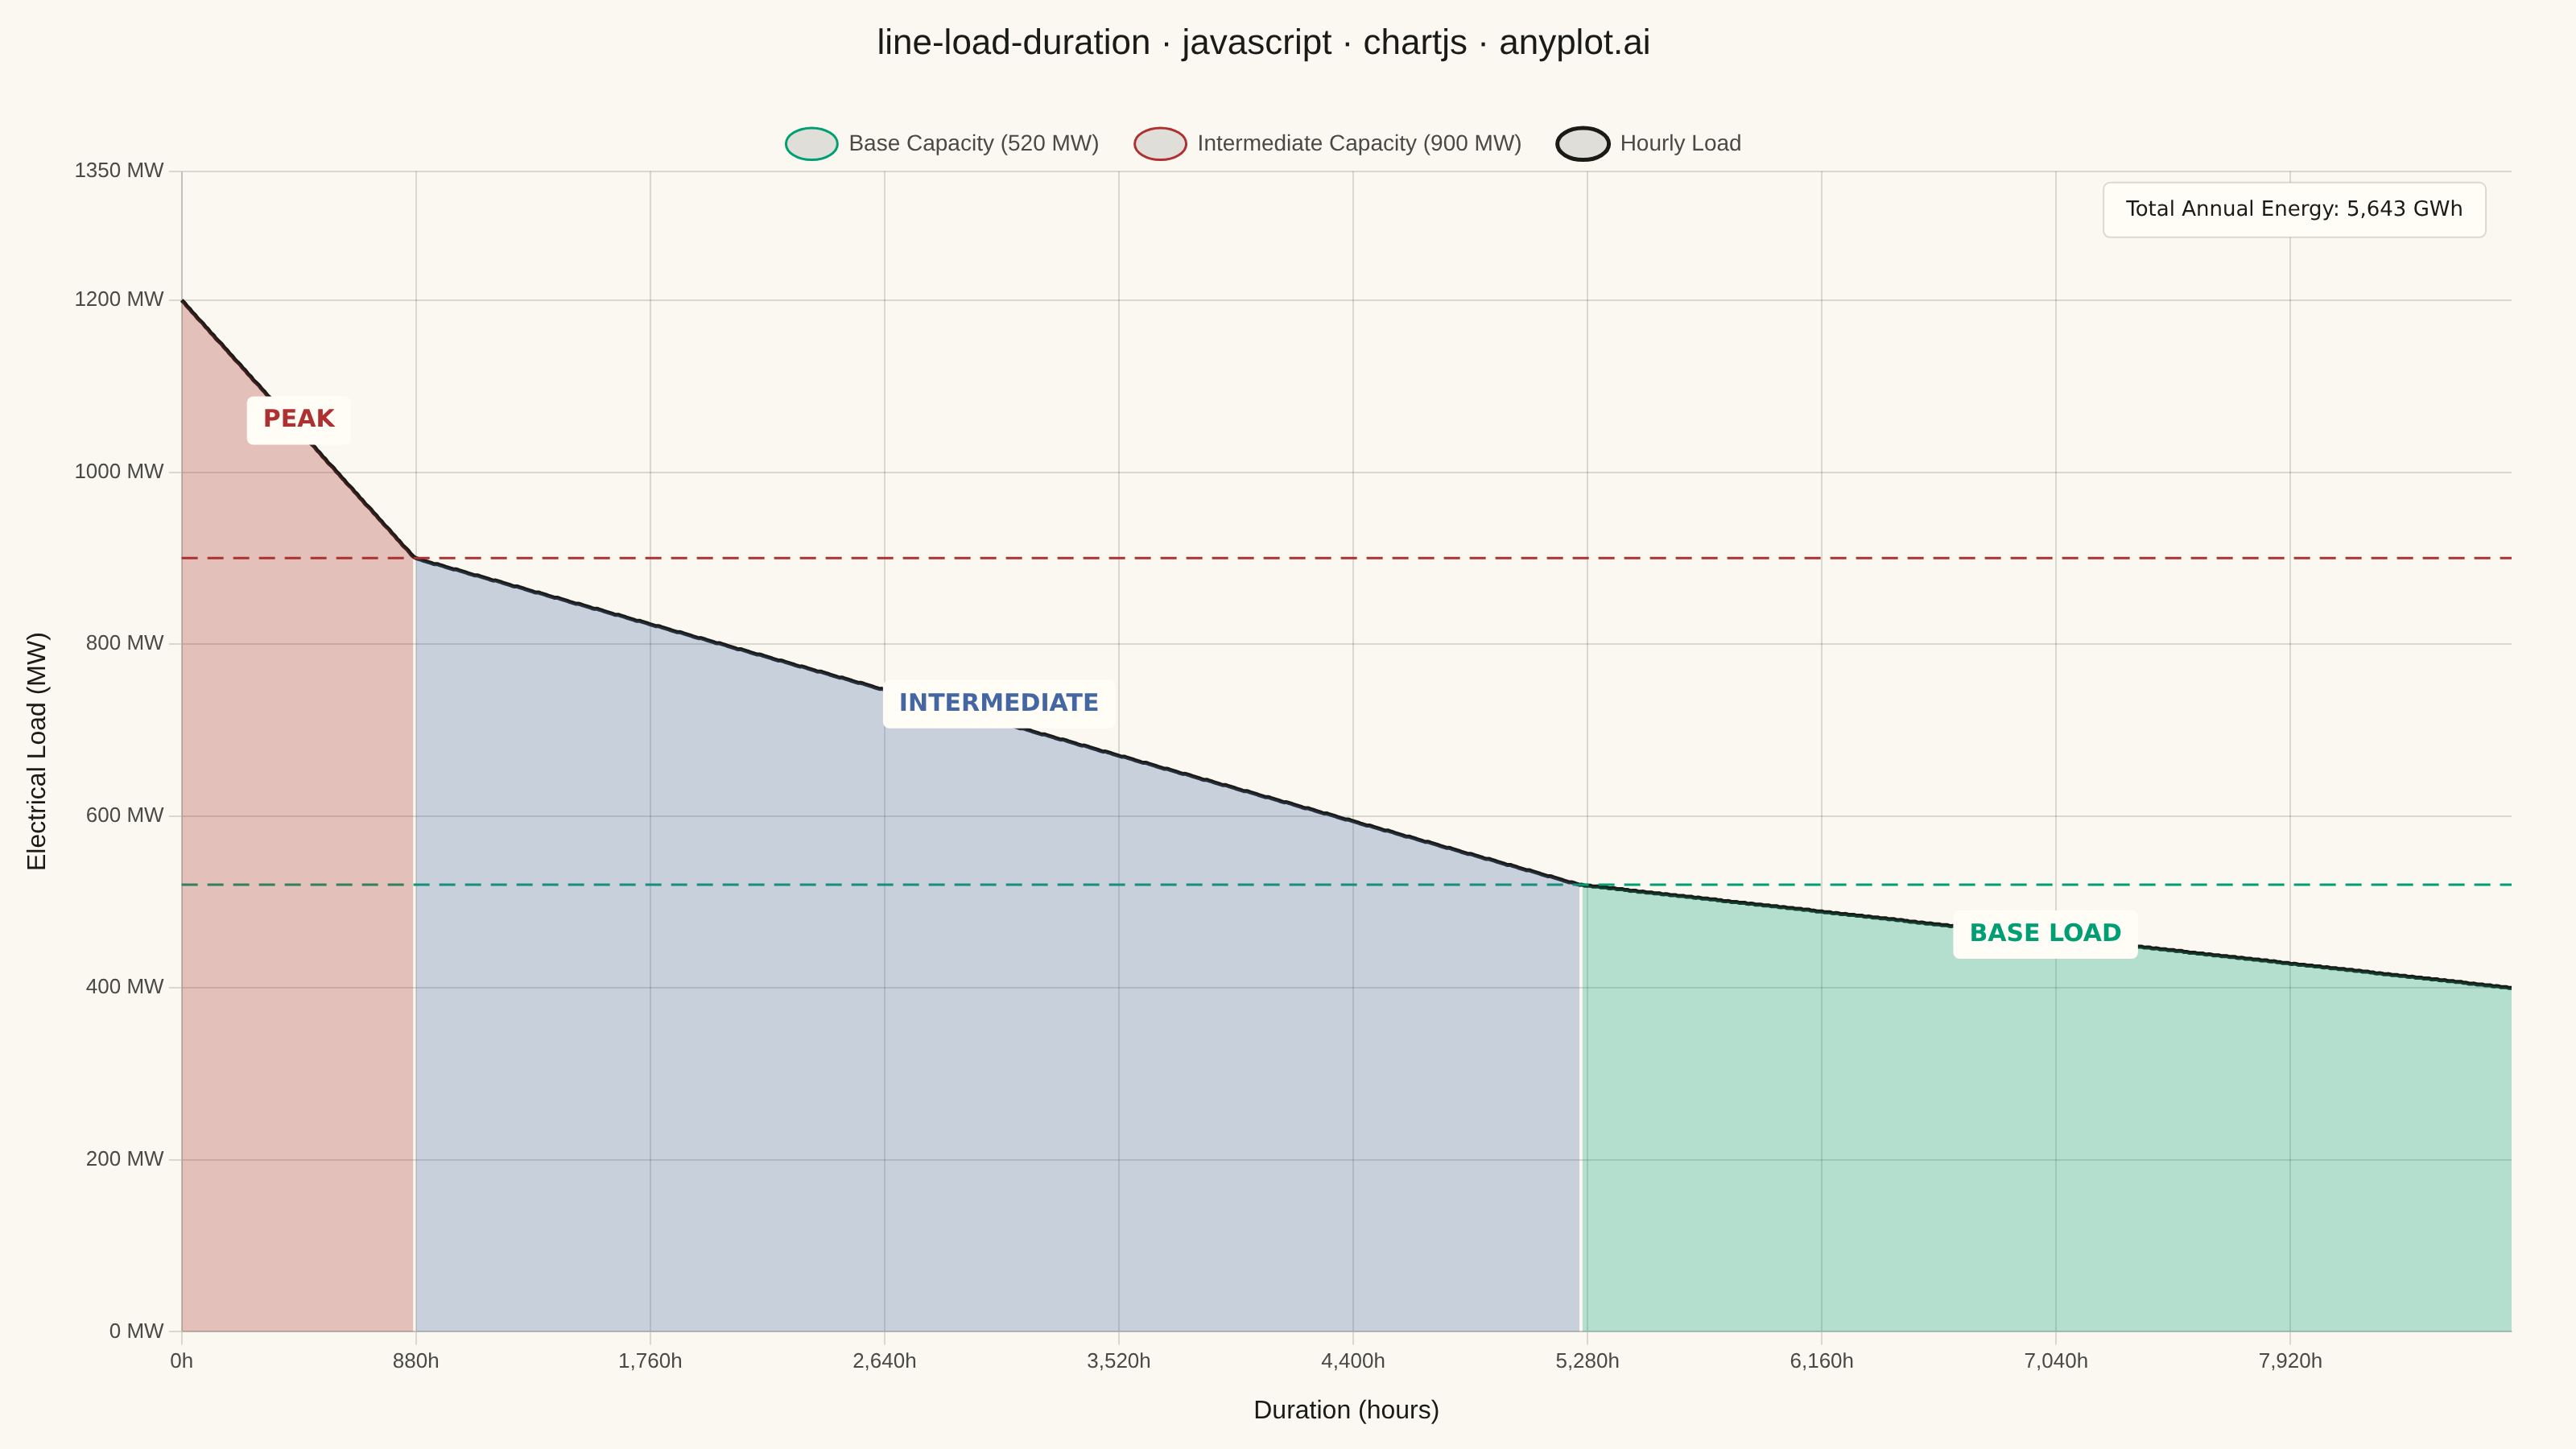
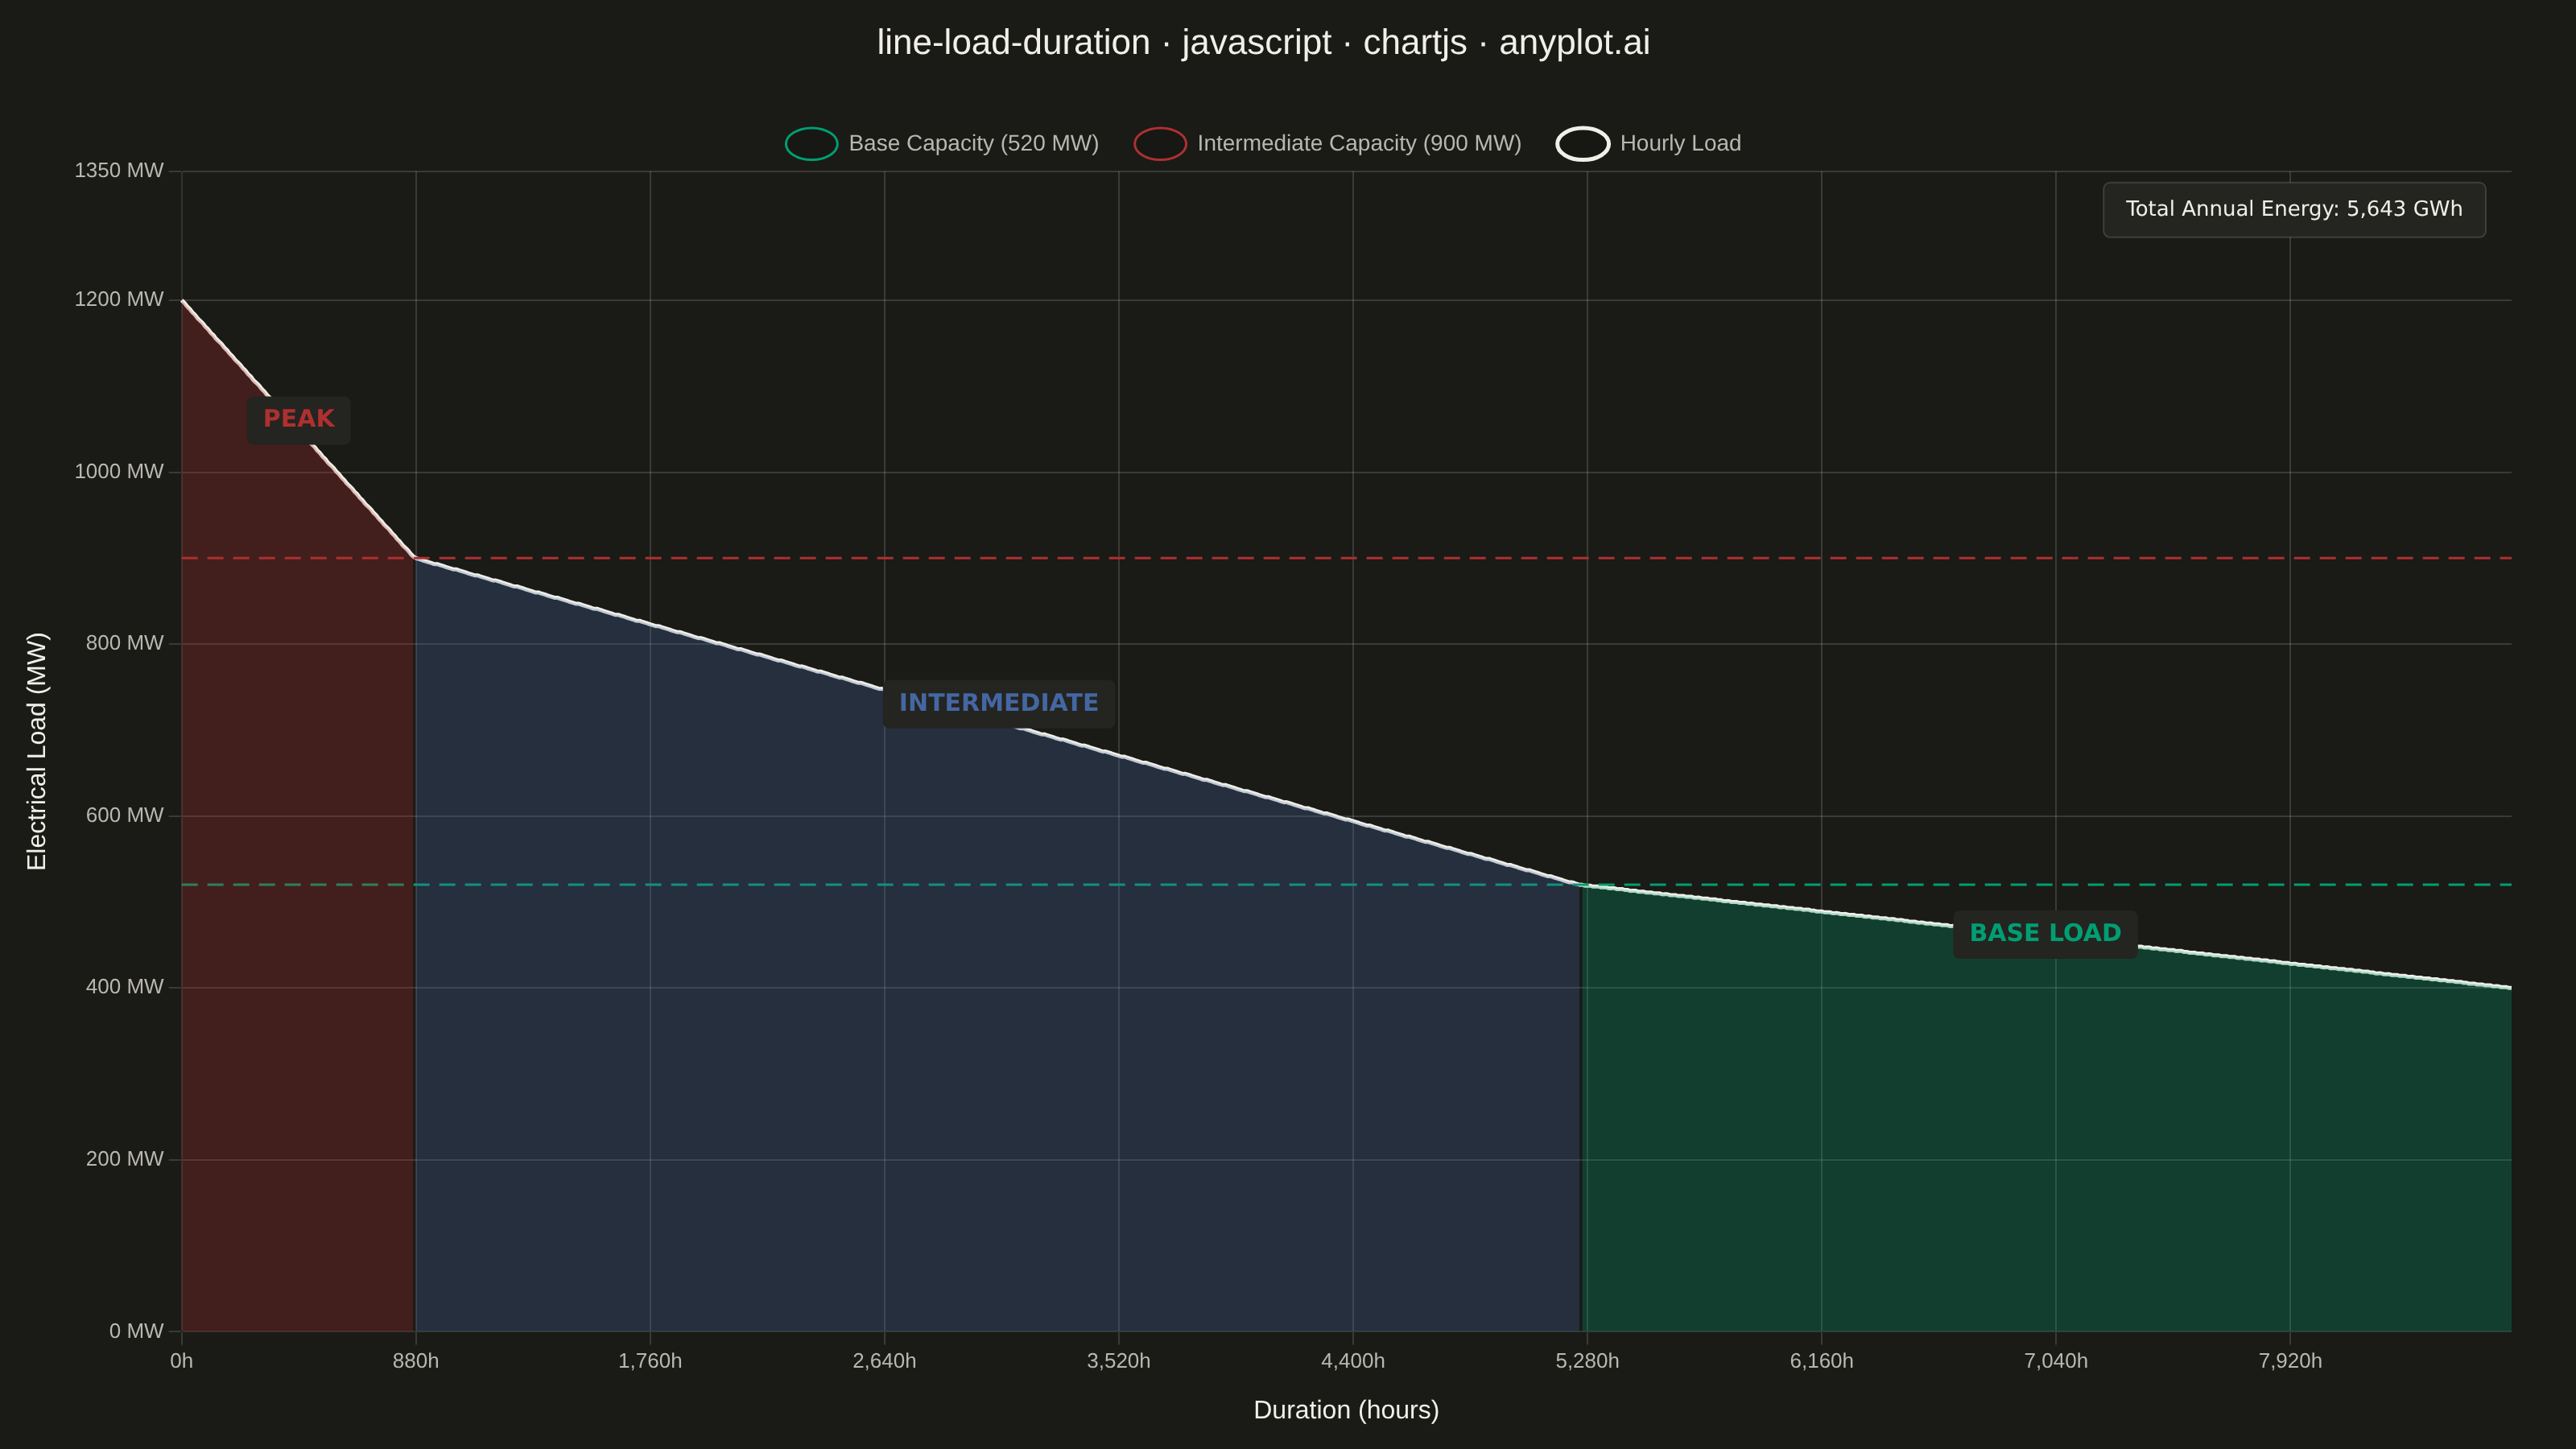
A load duration curve displays electrical power demand (MW) sorted from highest to lowest across all hours of a year (8,760 hours), forming a monotonically decreasing curve. It is a fundamental tool in power system planning, revealing the proportion of time that load exceeds a given level. The curve naturally segments into peak, intermediate, and base load regions, helping utilities determine the optimal generation capacity mix. The area under the curve represents total annual energy consumption.
// anyplot.ai
// line-load-duration: Load Duration Curve for Energy Systems
// Library: chartjs 4.4.7 | JavaScript 22.22.3
// Quality: 91/100 | Created: 2026-06-10

const t = window.ANYPLOT_TOKENS;

// --- Data (deterministic synthetic annual load profile) ---
const N = 876; // 876 points, each representing 10 hours (876 × 10 = 8,760 h/year)
const hours = Array.from({ length: N }, (_, i) => i * 10);

const loads = hours.map((_, i) => {
  const r = i / (N - 1); // normalized 0–1
  let mw;
  if (r < 0.1) {
    mw = 1200 - 300 * (r / 0.1);          // Peak:         1200 → 900 MW
  } else if (r < 0.6) {
    mw = 900 - 380 * ((r - 0.1) / 0.5);   // Intermediate:  900 → 520 MW
  } else {
    mw = 520 - 120 * ((r - 0.6) / 0.4);   // Base:          520 → 400 MW
  }
  return Math.round(mw);
});

// Region boundary indices (load sorted descending, hours rank-ordered)
const PEAK_END  = 88;   // hours 0–870  (top 10 %)
const INTER_END = 526;  // hours 880–5250 (middle 50 %)
                        // hours 5260–8750 (bottom 40 %) = base load

// Total annual energy (area under curve, GWh)
const totalGWh = Math.round(loads.reduce((s, v) => s + v * 10, 0) / 1000);

// Region fill arrays — null outside each region so Chart.js creates clean fill gaps
const fillPeak  = loads.map((v, i) => (i < PEAK_END                    ? v : null));
const fillInter = loads.map((v, i) => (i >= PEAK_END && i < INTER_END  ? v : null));
const fillBase  = loads.map((v, i) => (i >= INTER_END                  ? v : null));

// Horizontal dashed capacity-tier lines (constant value across all hours)
const cap520 = Array(N).fill(520);  // base / intermediate boundary
const cap900 = Array(N).fill(900);  // intermediate / peak boundary

// Rgba helper — avoids 8-char hex, safe in all Chromium builds
const rgba = (hex, a) => {
  const r = parseInt(hex.slice(1, 3), 16);
  const g = parseInt(hex.slice(3, 5), 16);
  const b = parseInt(hex.slice(5, 7), 16);
  return `rgba(${r},${g},${b},${a})`;
};

// --- Mount ---
const canvas = document.createElement("canvas");
document.getElementById("container").appendChild(canvas);

// --- Chart ---
const title = "line-load-duration · javascript · chartjs · anyplot.ai";

new Chart(canvas, {
  type: "line",
  data: {
    labels: hours,
    datasets: [
      // Region fills — base first so palette[0] = #009E73 is the first dataset
      {
        label: "Base Load",
        data: fillBase,
        backgroundColor: rgba(t.palette[0], 0.28),
        borderColor: "transparent",
        borderWidth: 0,
        fill: "origin",
        pointRadius: 0,
        spanGaps: false,
        tension: 0,
      },
      {
        label: "Intermediate Load",
        data: fillInter,
        backgroundColor: rgba(t.palette[2], 0.28),
        borderColor: "transparent",
        borderWidth: 0,
        fill: "origin",
        pointRadius: 0,
        spanGaps: false,
        tension: 0,
      },
      {
        label: "Peak Load",
        data: fillPeak,
        backgroundColor: rgba(t.palette[4], 0.28),  // matte red — semantic: peak/critical
        borderColor: "transparent",
        borderWidth: 0,
        fill: "origin",
        pointRadius: 0,
        spanGaps: false,
        tension: 0,
      },
      // Horizontal capacity-tier dashed lines
      {
        label: "Base Capacity (520 MW)",
        data: cap520,
        borderColor: t.palette[0],
        borderWidth: 1.5,
        borderDash: [10, 6],
        pointRadius: 0,
        fill: false,
        tension: 0,
      },
      {
        label: "Intermediate Capacity (900 MW)",
        data: cap900,
        borderColor: t.palette[4],
        borderWidth: 1.5,
        borderDash: [10, 6],
        pointRadius: 0,
        fill: false,
        tension: 0,
      },
      // Main load duration curve
      {
        label: "Hourly Load",
        data: loads,
        borderColor: t.ink,
        borderWidth: 2.5,
        pointRadius: 0,
        fill: false,
        tension: 0.25,
      },
    ],
  },
  options: {
    responsive: true,
    maintainAspectRatio: false,
    animation: false,
    plugins: {
      title: {
        display: true,
        text: title,
        color: t.ink,
        font: { size: 22, weight: "500" },
        padding: { top: 4, bottom: 20 },
      },
      legend: {
        display: true,
        labels: {
          color: t.inkSoft,
          font: { size: 14 },
          // Show only capacity lines + main load curve; hide fill-only datasets
          filter: (item) => item.datasetIndex >= 3,
          usePointStyle: true,
          pointStyleWidth: 32,
          padding: 22,
        },
      },
    },
    scales: {
      x: {
        title: {
          display: true,
          text: "Duration (hours)",
          color: t.ink,
          font: { size: 16, weight: "500" },
          padding: { top: 10 },
        },
        ticks: {
          color: t.inkSoft,
          font: { size: 13 },
          maxTicksLimit: 10,
          callback: (val, idx) => `${hours[idx] !== undefined ? hours[idx].toLocaleString() : val}h`,
        },
        grid: { color: t.grid },
      },
      y: {
        title: {
          display: true,
          text: "Electrical Load (MW)",
          color: t.ink,
          font: { size: 16, weight: "500" },
          padding: { bottom: 10 },
        },
        ticks: {
          color: t.inkSoft,
          font: { size: 13 },
          callback: (v) => `${v} MW`,
          maxTicksLimit: 8,
        },
        grid: { color: t.grid },
        min: 0,
        max: 1350,
      },
    },
    layout: {
      padding: { left: 10, right: 40, top: 10, bottom: 10 },
    },
  },
  plugins: [
    {
      id: "regionAnnotations",
      afterDraw(chart) {
        const ctx = chart.ctx;
        const { chartArea, scales } = chart;
        const xScale = scales.x;
        const yScale = scales.y;

        ctx.save();

        // Clip to chart area to keep annotations inside the plot
        ctx.beginPath();
        ctx.rect(
          chartArea.left,
          chartArea.top,
          chartArea.right - chartArea.left,
          chartArea.bottom - chartArea.top
        );
        ctx.clip();

        // Region label pills (centered in each time + load range)
        const regions = [
          { text: "PEAK",         dataX: 440,  dataY: 1060, color: t.palette[4] },
          { text: "INTERMEDIATE", dataX: 3070, dataY:  730, color: t.palette[2] },
          { text: "BASE LOAD",    dataX: 7000, dataY:  462, color: t.palette[0] },
        ];

        ctx.font = "bold 15px system-ui, -apple-system, sans-serif";
        ctx.textAlign = "center";
        ctx.textBaseline = "middle";

        regions.forEach(({ text, dataX, dataY, color }) => {
          // Category scale uses indices (0–875), not raw hour values
          const px = xScale.getPixelForValue(Math.round(dataX / 10));
          const py = yScale.getPixelForValue(dataY);
          const m = ctx.measureText(text);
          const padX = 10;
          const bw = m.width + padX * 2;
          const bh = 30;

          ctx.fillStyle = t.elevatedBg;
          ctx.beginPath();
          ctx.roundRect(px - bw / 2, py - bh / 2, bw, bh, 4);
          ctx.fill();

          ctx.fillStyle = color;
          ctx.fillText(text, px, py);
        });

        ctx.restore();

        // Energy annotation — upper-right, outside clip
        ctx.save();

        const annotText = `Total Annual Energy: ${totalGWh.toLocaleString()} GWh`;
        ctx.font = "500 13px system-ui, -apple-system, sans-serif";
        ctx.textAlign = "right";
        ctx.textBaseline = "middle";

        const am = ctx.measureText(annotText);
        const apX = 14;
        const apY = 8;
        const abw = am.width + apX * 2;
        const abh = 34;
        const ax = chartArea.right - 16;
        const ay = chartArea.top + 24;

        ctx.fillStyle = t.elevatedBg;
        ctx.strokeStyle = t.grid;
        ctx.lineWidth = 1;
        ctx.beginPath();
        ctx.roundRect(ax - abw, ay - abh / 2, abw, abh, 4);
        ctx.fill();
        ctx.stroke();

        ctx.fillStyle = t.ink;
        ctx.fillText(annotText, ax - apX, ay);

        ctx.restore();
      },
    },
  ],
});
Runnable source as JSON, for any HTTP client: https://api.anyplot.ai/specs/line-load-duration/chartjs/code. Any spec id and library id listed in llms-full.txt fit the same URL shape; every URL below is complete and callable.
{
  "spec_id": "line-load-duration",
  "language": "javascript",
  "library": "chartjs",
  "page": "https://anyplot.ai/line-load-duration/javascript/chartjs",
  "hub": "https://anyplot.ai/line-load-duration",
  "code_json": "https://api.anyplot.ai/specs/line-load-duration/chartjs/code",
  "spec_json": "https://api.anyplot.ai/specs/line-load-duration",
  "render_light_png": "https://storage.googleapis.com/anyplot-images/plots/line-load-duration/javascript/chartjs/plot-light.png",
  "render_dark_png": "https://storage.googleapis.com/anyplot-images/plots/line-load-duration/javascript/chartjs/plot-dark.png",
  "interactive_light_html": "https://storage.googleapis.com/anyplot-images/plots/line-load-duration/javascript/chartjs/plot-light.html",
  "interactive_dark_html": "https://storage.googleapis.com/anyplot-images/plots/line-load-duration/javascript/chartjs/plot-dark.html",
  "quality_score": 91.0,
  "license": "MIT",
  "guide": "https://anyplot.ai/llms.txt"
}
Part of Load Duration Curve for Energy Systems on anyplot.ai.