Source code in 15 libraries — Python: Altair, Bokeh, lets-plot, Matplotlib, Plotly, plotnine, Pygal, Seaborn; R: ggplot2; Julia: Makie.jl; JavaScript: Chart.js, D3.js, Apache ECharts, Highcharts, MUI X Charts.
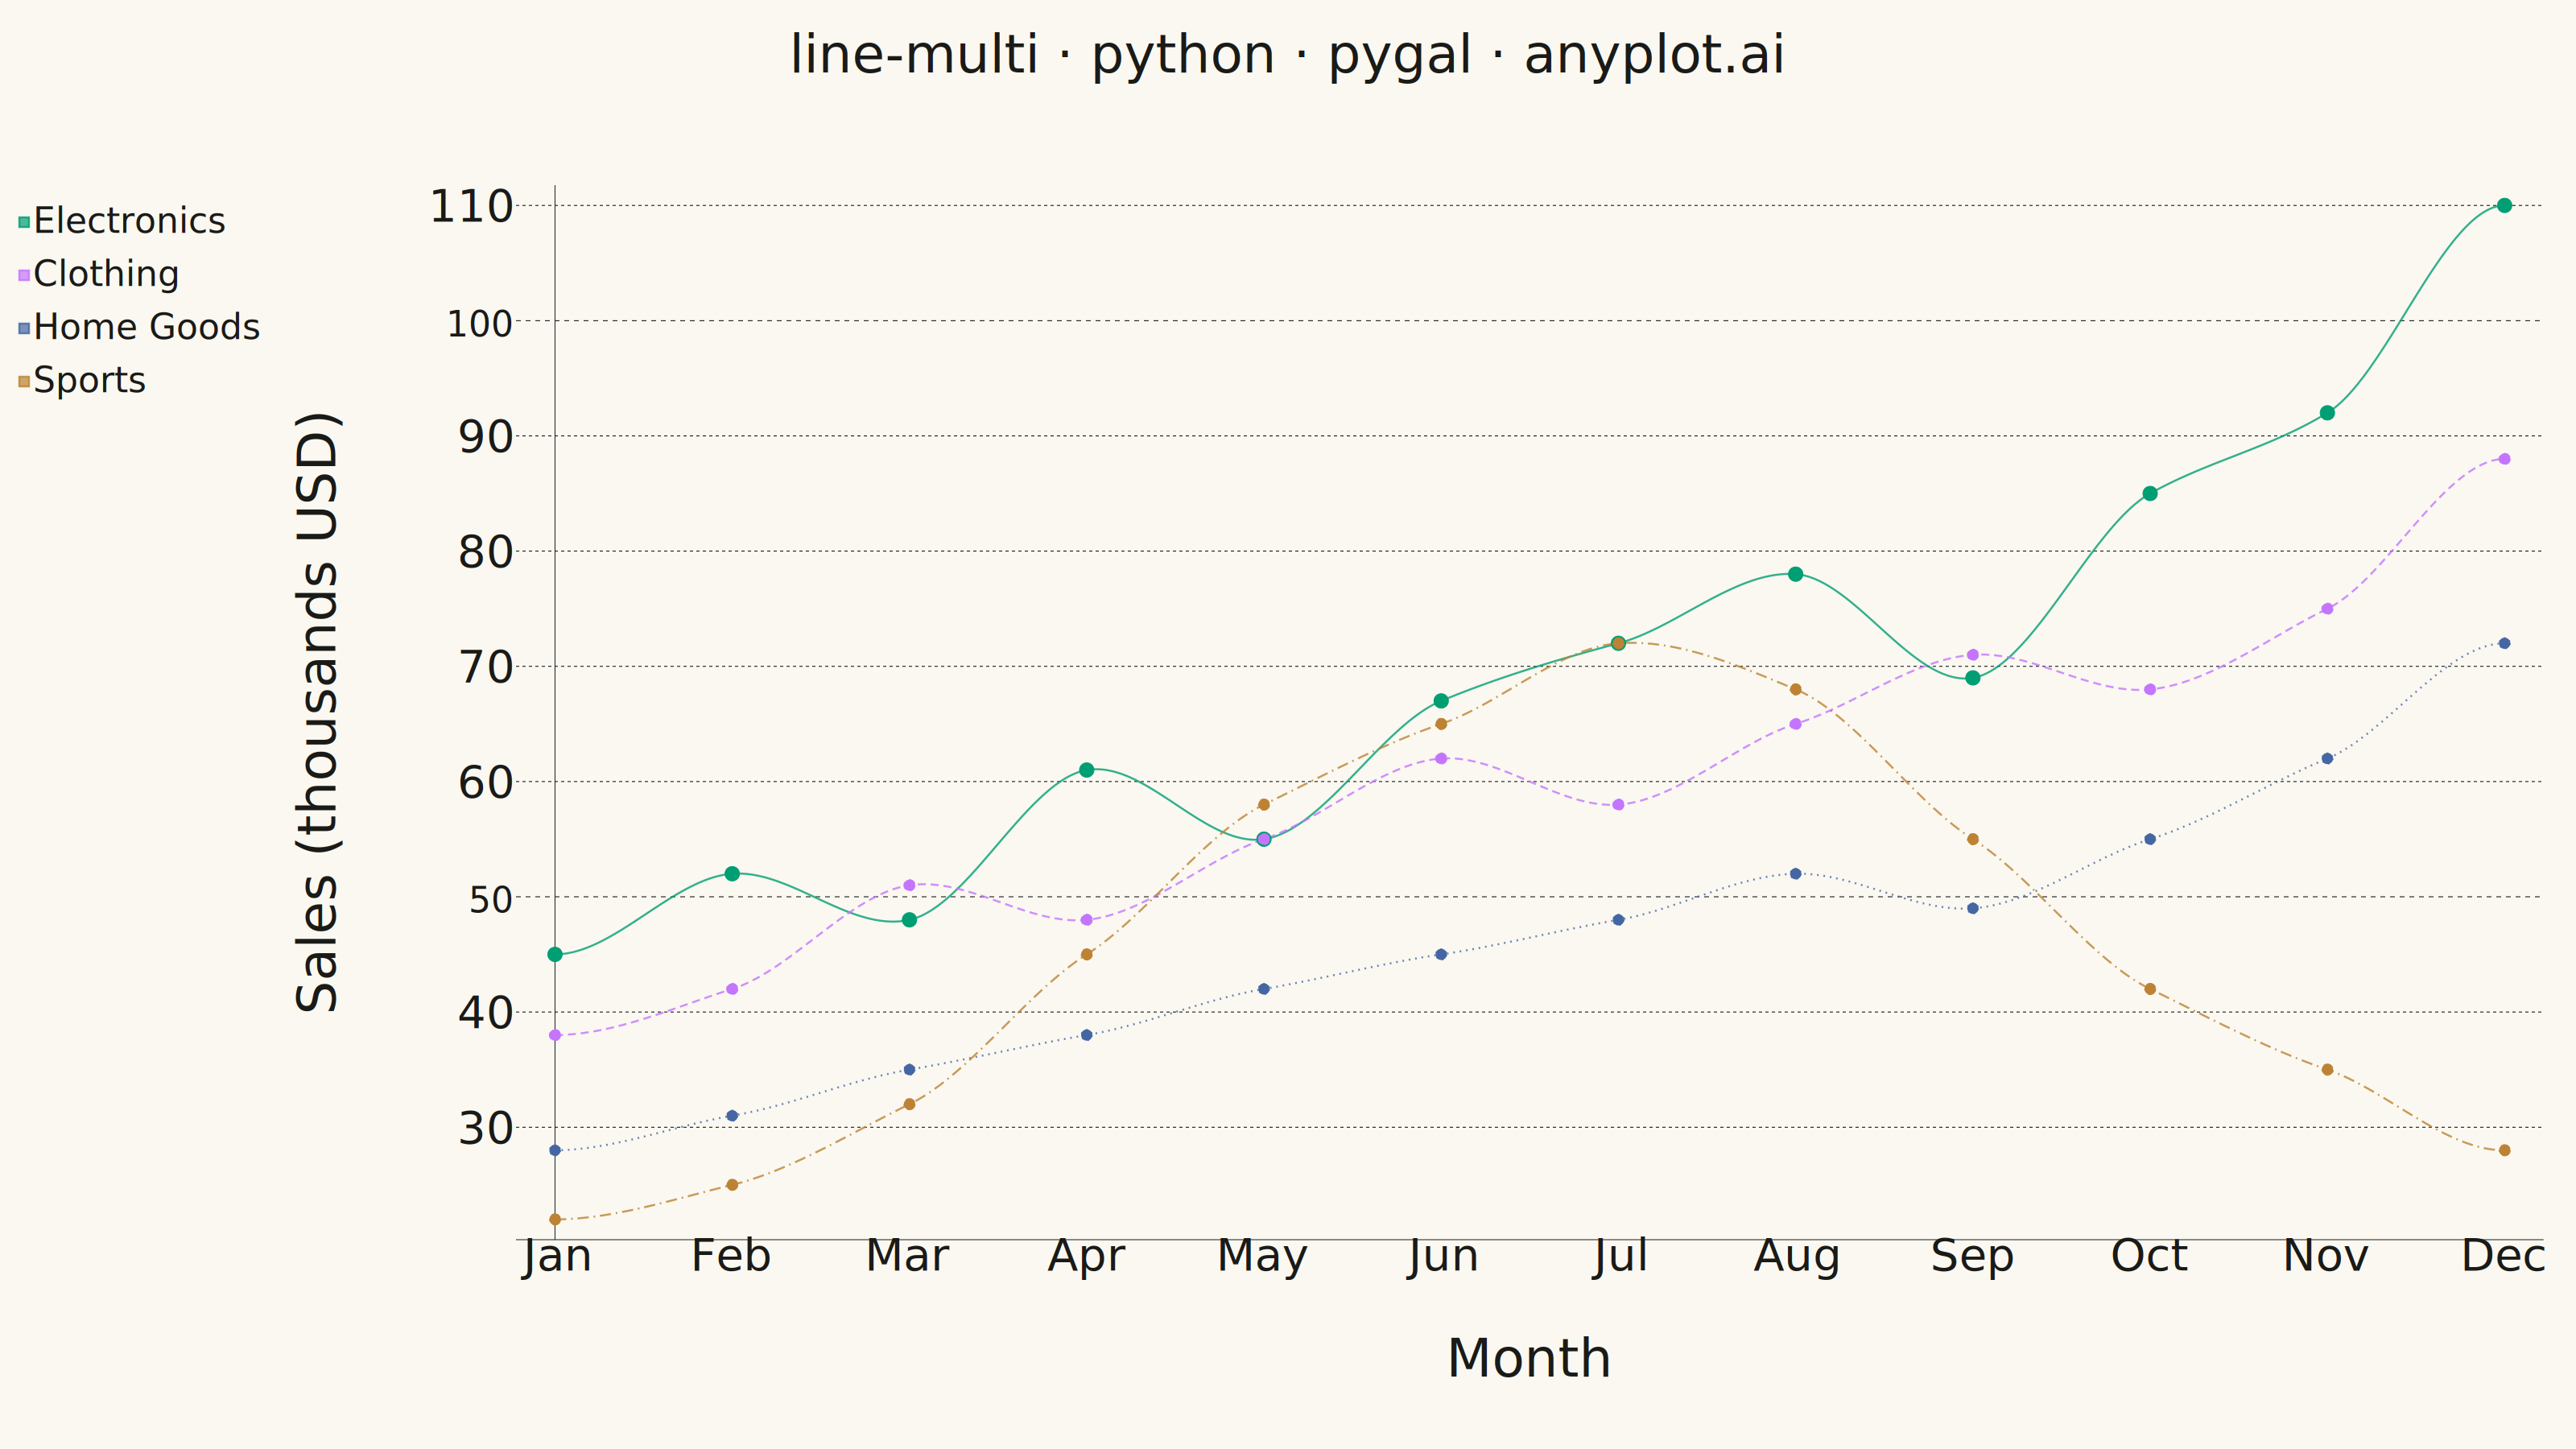
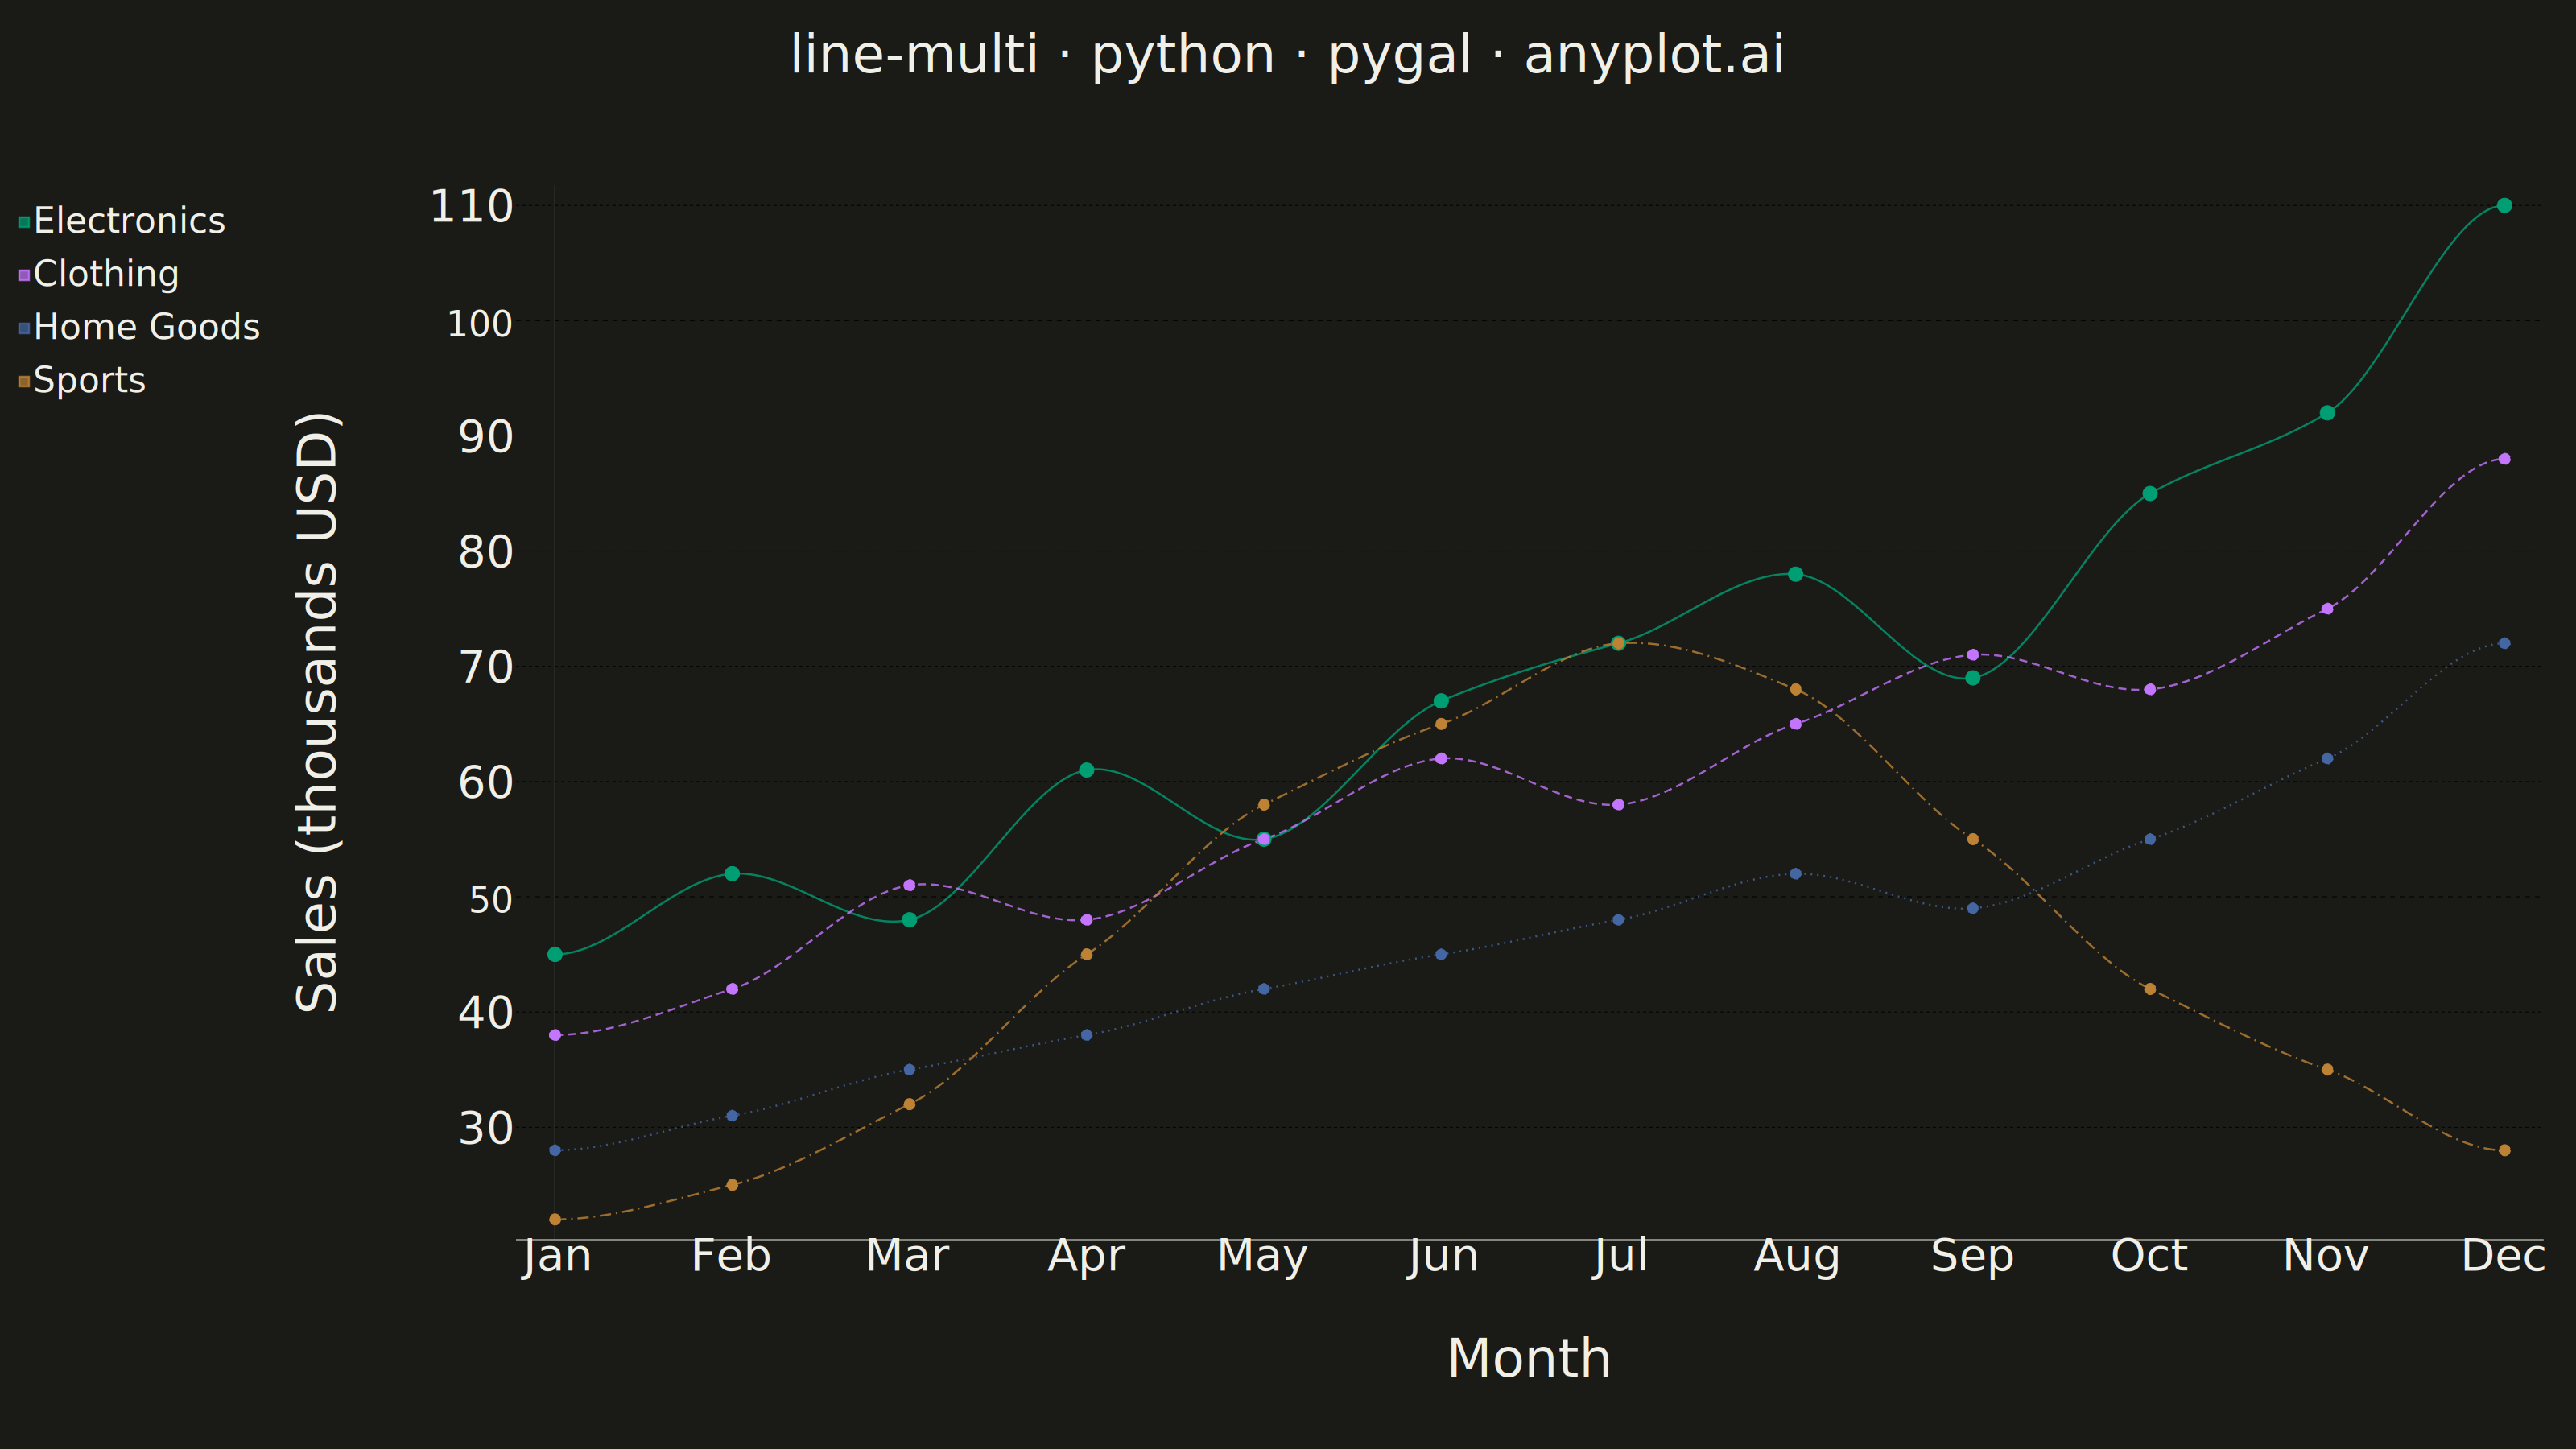
A multi-line plot displays multiple data series on the same axes for direct comparison. Each series is represented by a distinct line with its own color and optional style, making it easy to identify trends, correlations, and divergences between variables. This visualization is essential for comparing related metrics over a common sequence or time period.
Preview render from the Pygal implementation.