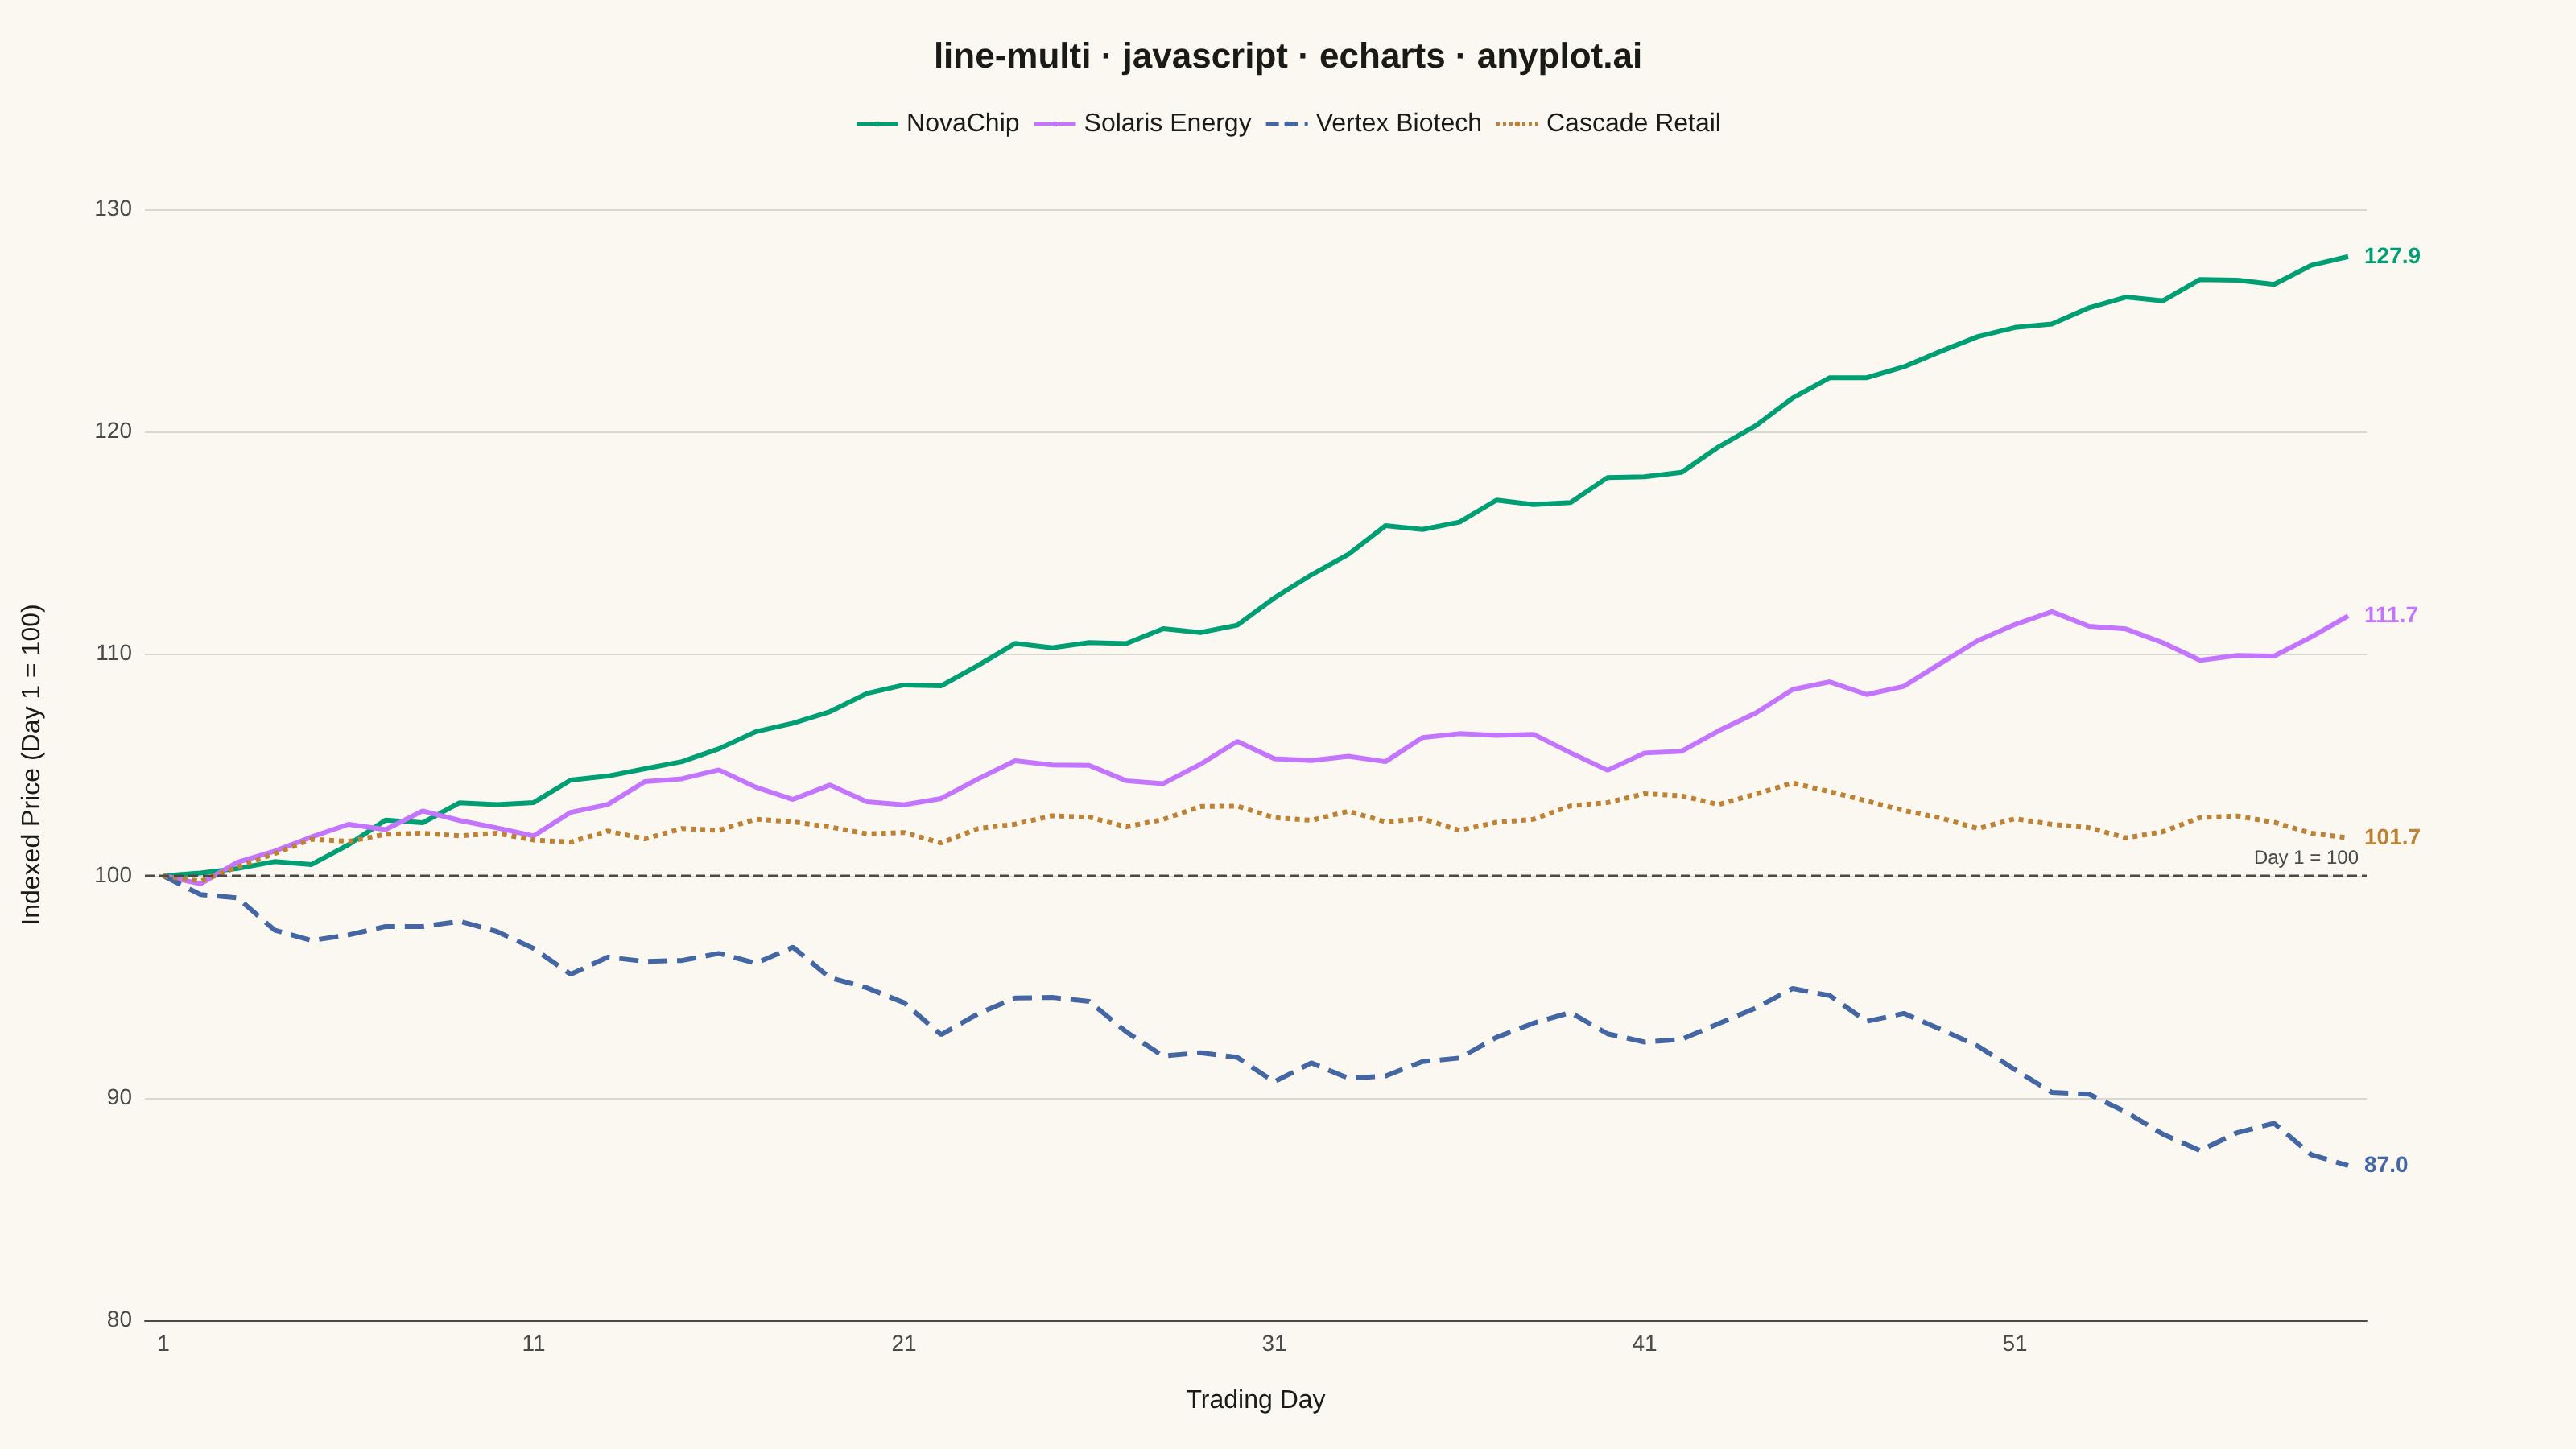
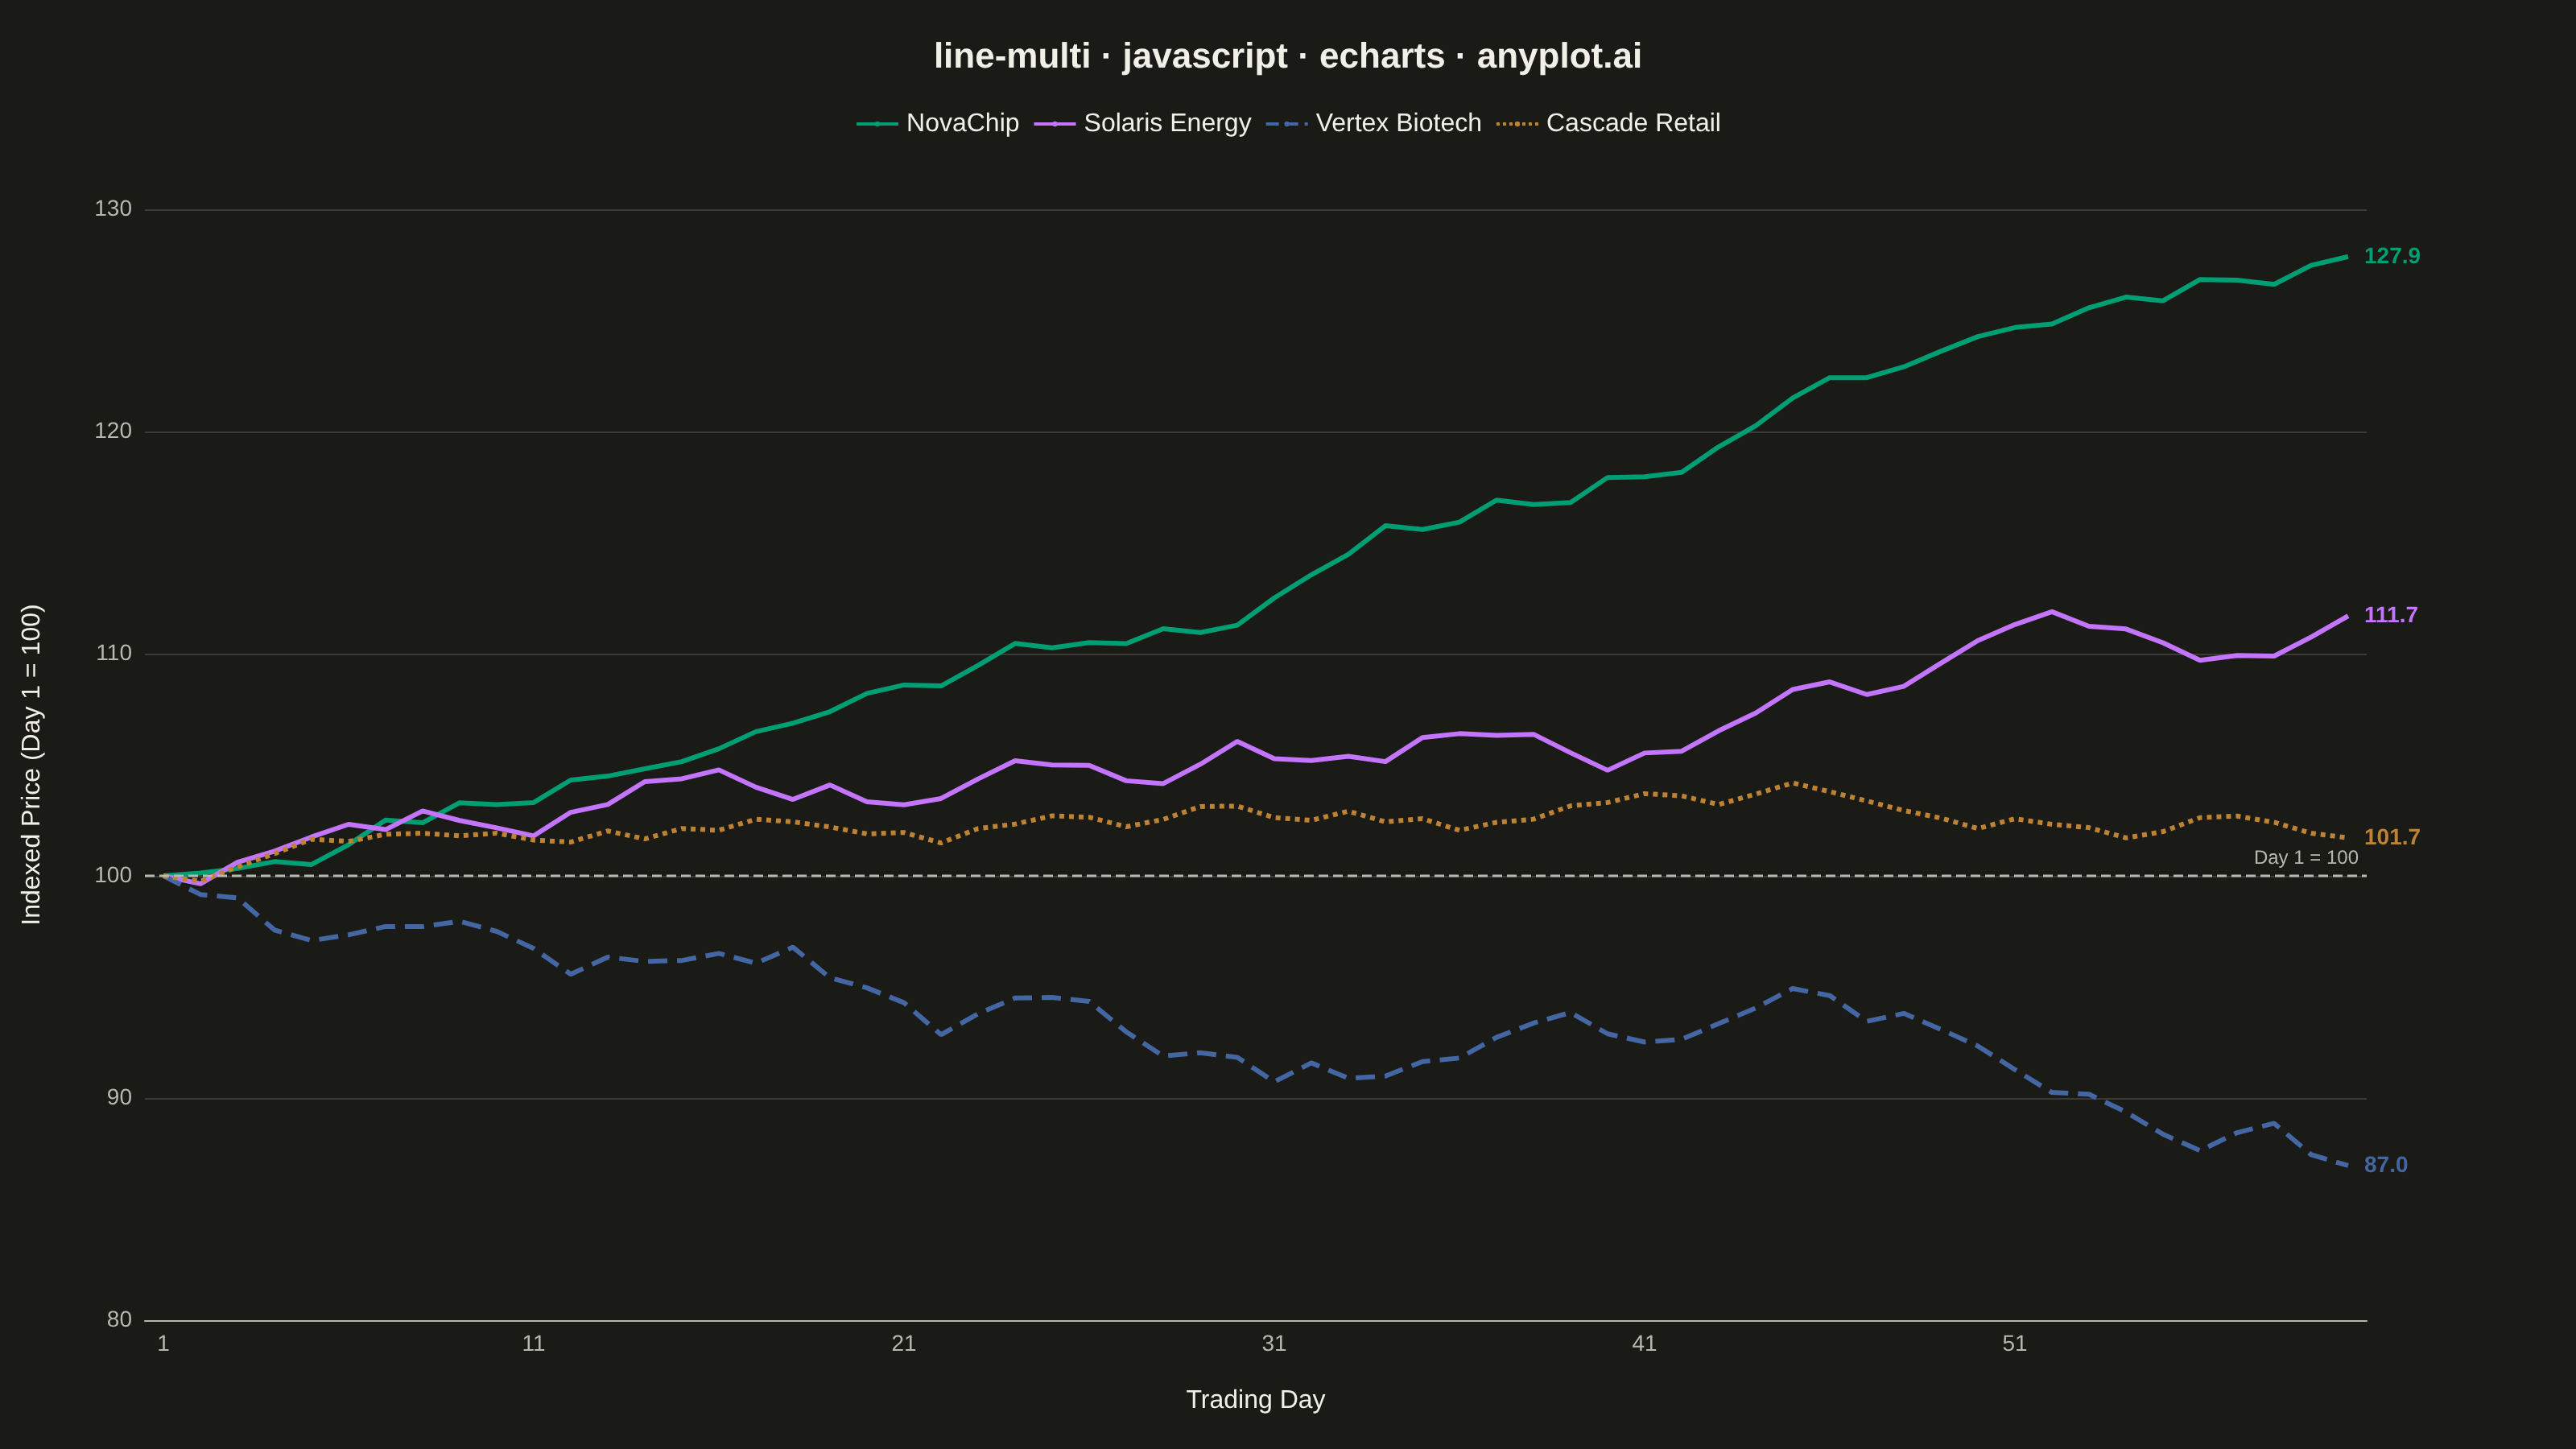
The same plot in 14 other libraries — JavaScript: Chart.js, D3.js, Highcharts, MUI X Charts; Python: Altair, Bokeh, lets-plot, Matplotlib, Plotly, plotnine, Pygal, Seaborn; R: ggplot2; Julia: Makie.jl. Compare all 15 side by side: Multi-Line Comparison Plot in Python, R, Julia and JavaScript.
A multi-line plot displays multiple data series on the same axes for direct comparison. Each series is represented by a distinct line with its own color and optional style, making it easy to identify trends, correlations, and divergences between variables. This visualization is essential for comparing related metrics over a common sequence or time period.
// anyplot.ai
// line-multi: Multi-Line Comparison Plot
// Library: echarts 6.1.0 | JavaScript 22.23.1
// Quality: 93/100 | Created: 2026-08-05

const t = window.ANYPLOT_TOKENS;

// --- Data (in-memory, deterministic) ---------------------------------------
// Indexed closing price (start = 100) for 4 tech companies over 60 trading days.
// A tiny fixed-seed LCG drives a random-walk-with-drift per company so the
// series diverge in both level and trend, which is the point of the chart.
function makeLcg(seed) {
  let s = seed >>> 0;
  return () => {
    s = (s * 1664525 + 1013904223) >>> 0;
    return s / 4294967296;
  };
}

const NUM_DAYS = 60;
const days = Array.from({ length: NUM_DAYS }, (_, i) => i + 1);

const companies = [
  { name: "NovaChip", seed: 11, drift: 0.55, vol: 1.6 },
  { name: "Solaris Energy", seed: 29, drift: 0.15, vol: 2.0 },
  { name: "Vertex Biotech", seed: 47, drift: -0.25, vol: 2.4 },
  { name: "Cascade Retail", seed: 63, drift: 0.05, vol: 1.2 },
];

const series = companies.map((c) => {
  const rand = makeLcg(c.seed);
  let price = 100;
  const data = [price];
  for (let i = 1; i < NUM_DAYS; i++) {
    price += c.drift + (rand() - 0.5) * c.vol;
    data.push(+price.toFixed(2));
  }
  return { name: c.name, data };
});

const lineStyles = ["solid", "solid", "dashed", "dotted"];

// --- Init -------------------------------------------------------------------
const chart = echarts.init(document.getElementById("container"));

// --- Option -----------------------------------------------------------------
chart.setOption({
  animation: false,
  color: t.palette,
  backgroundColor: "transparent",
  title: {
    text: "line-multi · javascript · echarts · anyplot.ai",
    left: "center",
    top: 20,
    textStyle: { color: t.ink, fontSize: 22, fontWeight: "bold" },
  },
  legend: {
    top: 64,
    textStyle: { color: t.ink, fontSize: 16 },
    itemWidth: 26,
    itemHeight: 4,
  },
  grid: { left: 90, right: 130, top: 130, bottom: 80 },
  tooltip: { trigger: "axis" },
  labelLayout: { moveOverlap: "shiftY" },
  xAxis: {
    type: "category",
    data: days,
    name: "Trading Day",
    nameLocation: "middle",
    nameGap: 42,
    nameTextStyle: { color: t.ink, fontSize: 16 },
    axisLabel: { color: t.inkSoft, fontSize: 14, interval: 9 },
    axisLine: { lineStyle: { color: t.inkSoft } },
    axisTick: { show: false },
    splitLine: { show: false },
  },
  yAxis: {
    type: "value",
    scale: true,
    name: "Indexed Price (Day 1 = 100)",
    nameLocation: "middle",
    nameGap: 62,
    nameTextStyle: { color: t.ink, fontSize: 16 },
    axisLabel: { color: t.inkSoft, fontSize: 14 },
    axisLine: { show: false },
    axisTick: { show: false },
    splitLine: { lineStyle: { color: t.grid } },
  },
  series: series.map((s, i) => ({
    name: s.name,
    type: "line",
    data: s.data,
    symbol: "none",
    smooth: false,
    lineStyle: { color: t.palette[i], width: 3, type: lineStyles[i] },
    itemStyle: { color: t.palette[i] },
    emphasis: { focus: "series" },
    endLabel: {
      show: true,
      formatter: (p) => Number(p.value).toFixed(1),
      color: t.palette[i],
      fontSize: 14,
      fontWeight: "bold",
      distance: 10,
    },
    markLine:
      i === 0
        ? {
            symbol: "none",
            silent: true,
            animation: false,
            label: {
              show: true,
              formatter: "Day 1 = 100",
              position: "insideEndTop",
              color: t.inkSoft,
              fontSize: 12,
            },
            lineStyle: { color: t.inkSoft, type: "dashed", width: 1.5 },
            data: [{ yAxis: 100 }],
          }
        : undefined,
  })),
});
Runnable source as JSON, for any HTTP client: https://api.anyplot.ai/specs/line-multi/echarts/code. Any spec id and library id listed in llms-full.txt fit the same URL shape; every URL below is complete and callable.
{
  "spec_id": "line-multi",
  "language": "javascript",
  "library": "echarts",
  "page": "https://anyplot.ai/line-multi/javascript/echarts",
  "hub": "https://anyplot.ai/line-multi",
  "code_json": "https://api.anyplot.ai/specs/line-multi/echarts/code",
  "spec_json": "https://api.anyplot.ai/specs/line-multi",
  "render_light_png": "https://storage.googleapis.com/anyplot-images/plots/line-multi/javascript/echarts/plot-light.png",
  "render_dark_png": "https://storage.googleapis.com/anyplot-images/plots/line-multi/javascript/echarts/plot-dark.png",
  "interactive_light_html": "https://storage.googleapis.com/anyplot-images/plots/line-multi/javascript/echarts/plot-light.html",
  "interactive_dark_html": "https://storage.googleapis.com/anyplot-images/plots/line-multi/javascript/echarts/plot-dark.html",
  "quality_score": 93.0,
  "license": "MIT",
  "guide": "https://anyplot.ai/llms.txt"
}
Part of Multi-Line Comparison Plot on anyplot.ai.