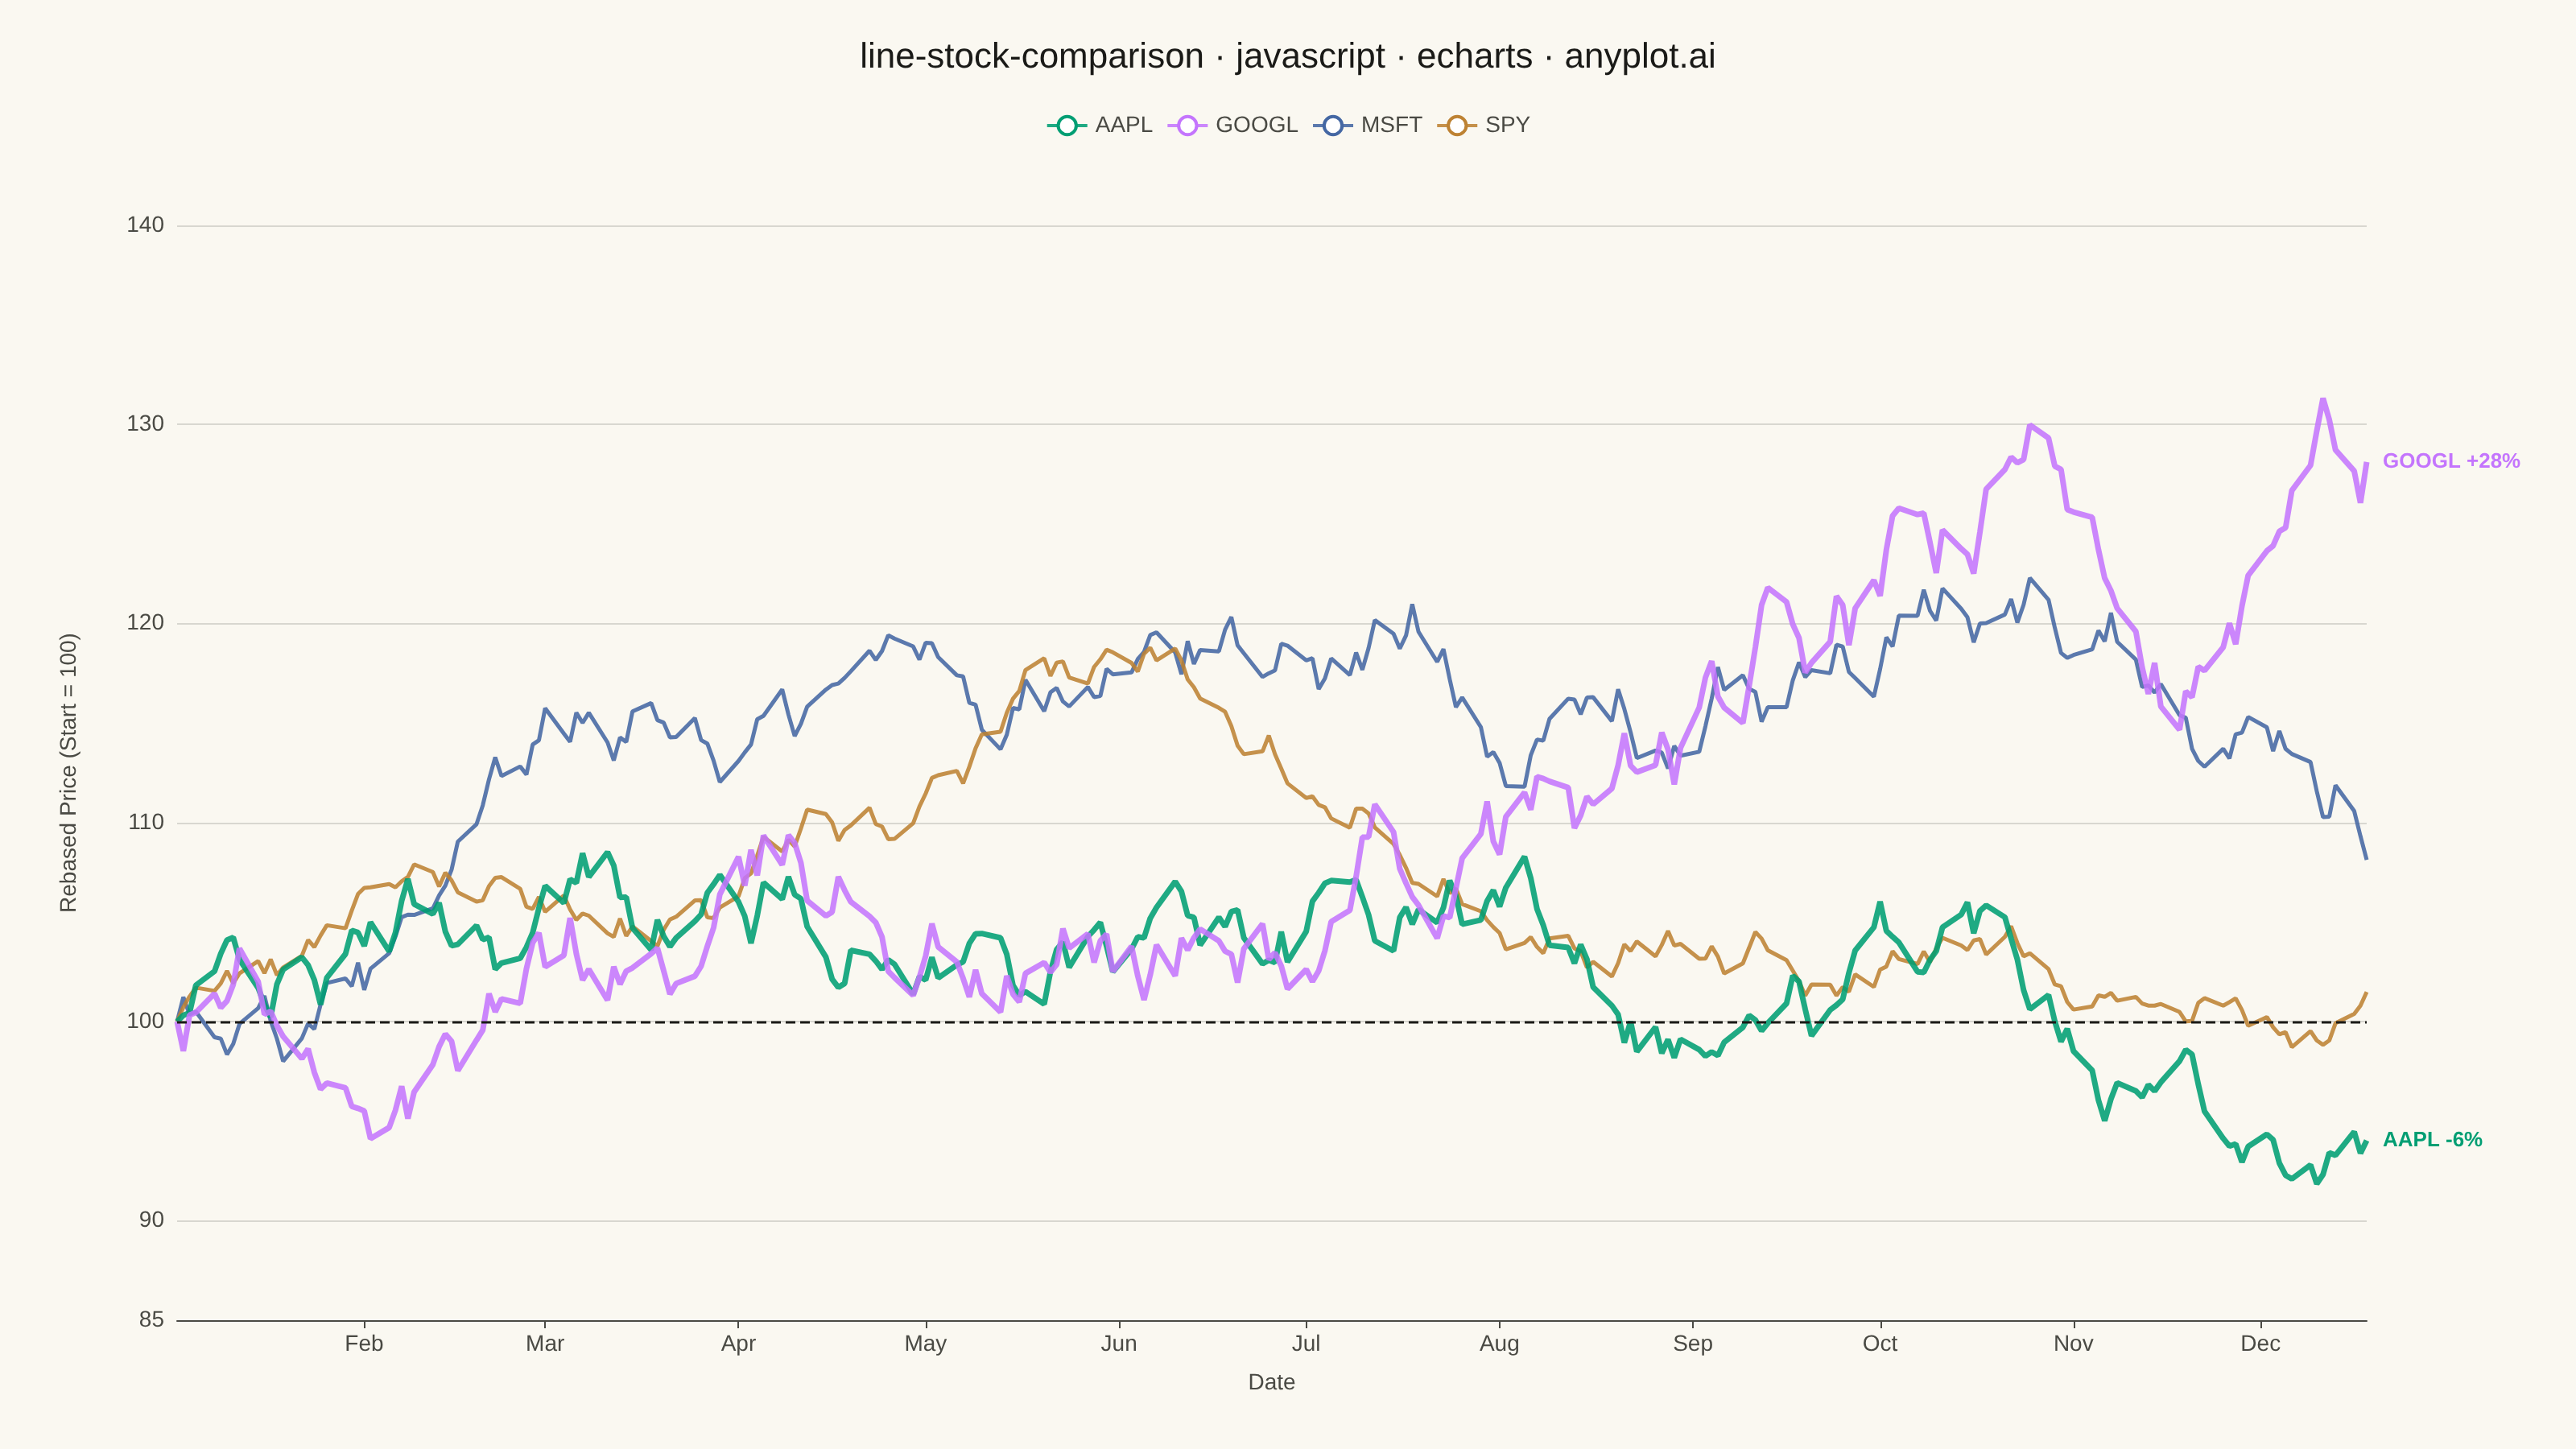
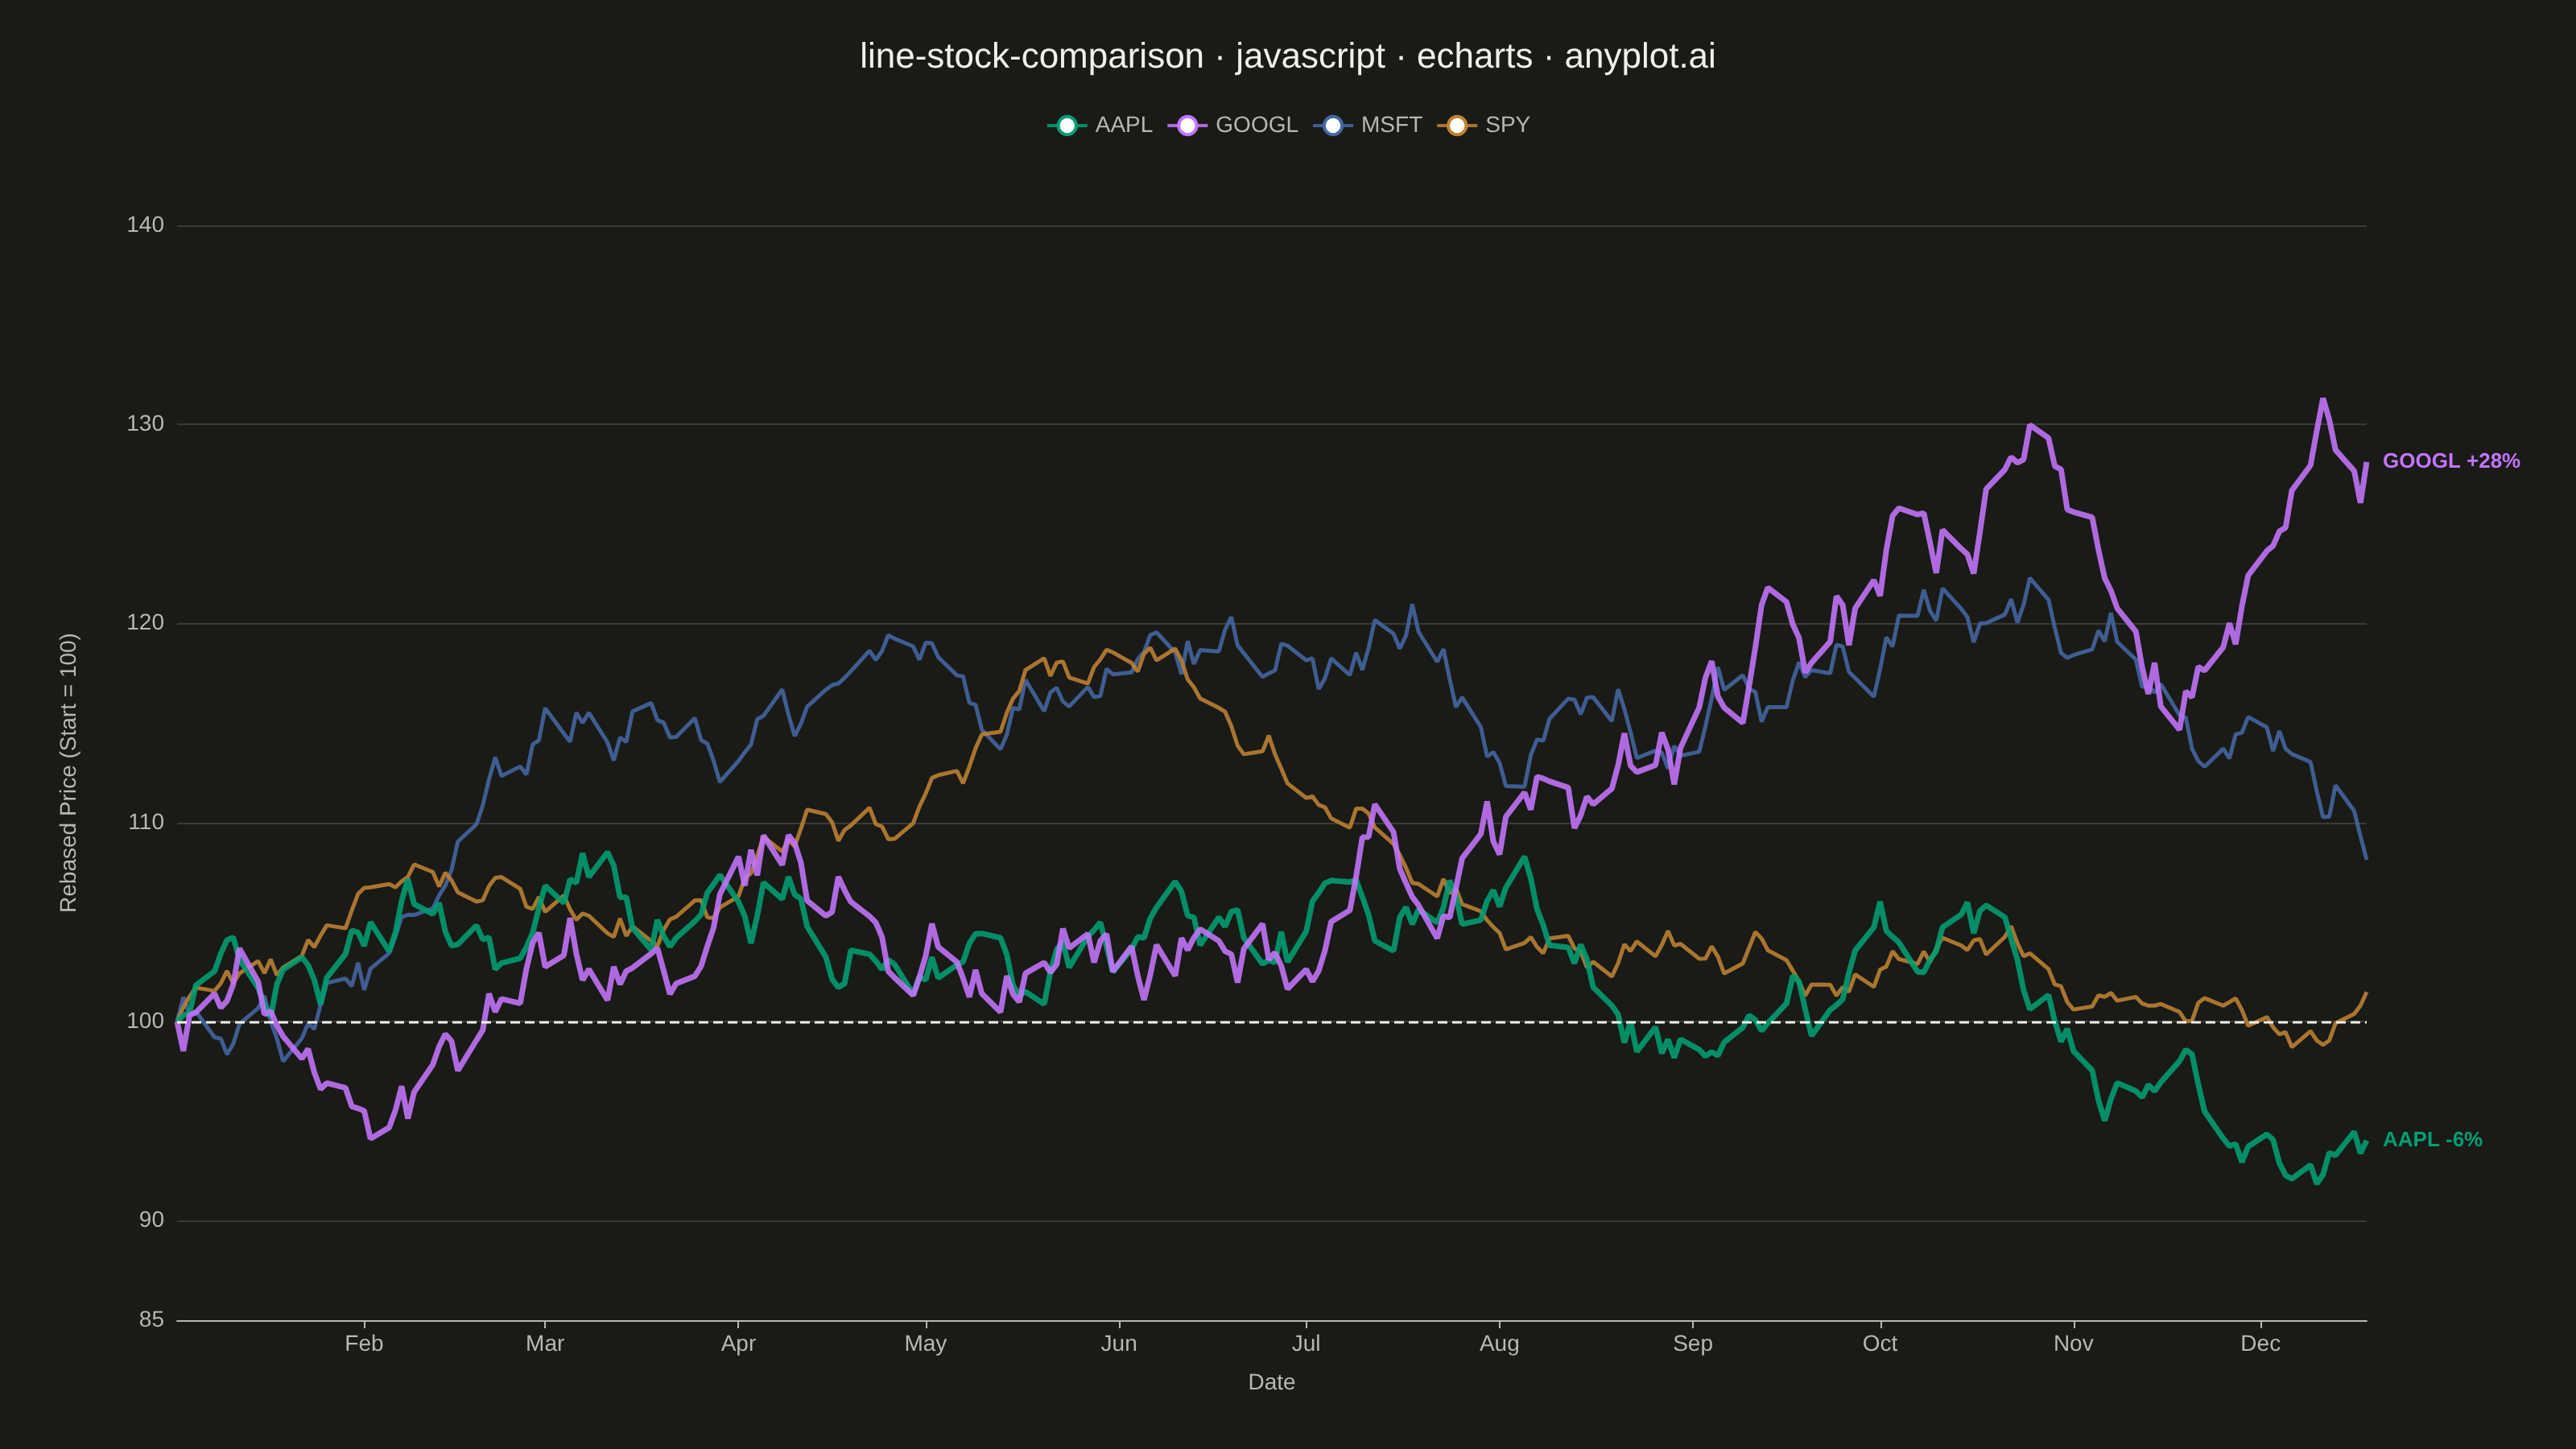
A multi-line chart comparing multiple stock price series normalized to a common starting point (rebased to 100) for direct performance comparison over time. By rebasing all series to the same initial value, investors can easily compare relative returns regardless of absolute price differences. This visualization reveals which stocks outperformed or underperformed relative to each other, making it essential for portfolio analysis and benchmark comparisons.
Preview render from the Apache ECharts implementation.