The same plot in 14 other libraries — JavaScript: Chart.js, Apache ECharts, Highcharts, MUI X Charts; Python: Altair, Bokeh, lets-plot, Matplotlib, Plotly, plotnine, Pygal, Seaborn; R: ggplot2; Julia: Makie.jl. Compare all 15 side by side: Stock Price Comparison Chart in Python, R, Julia and JavaScript.
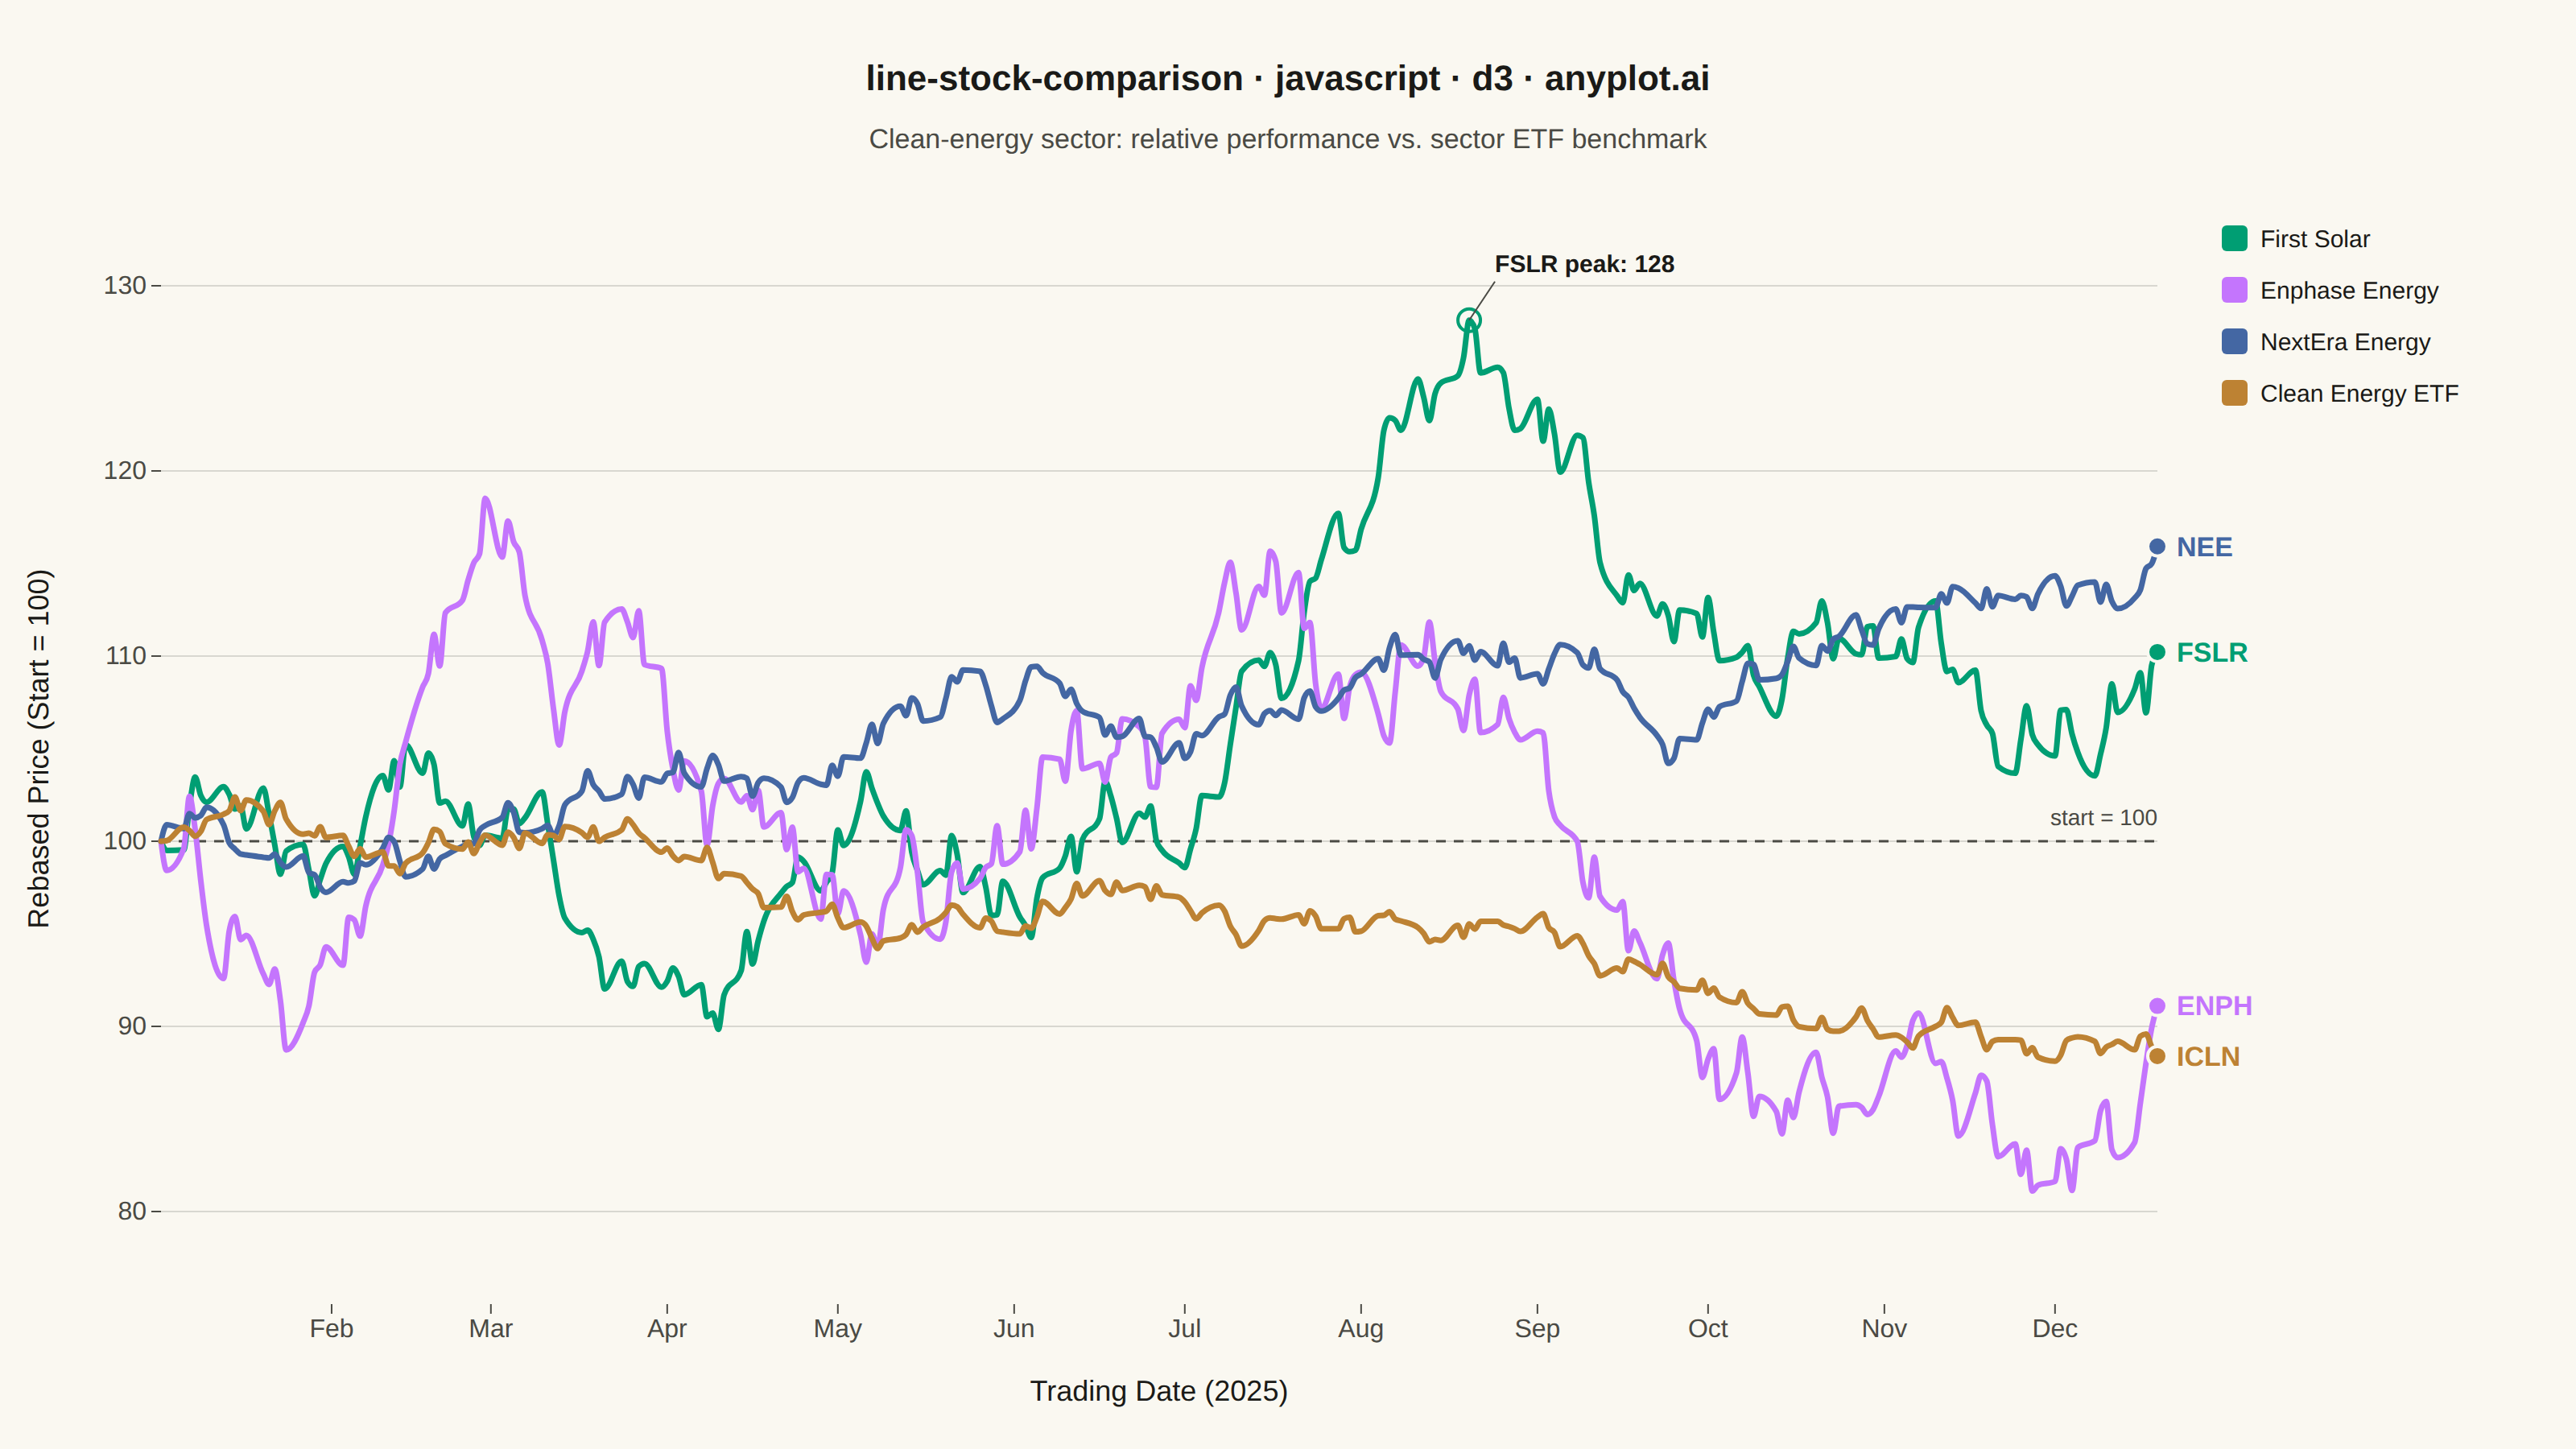
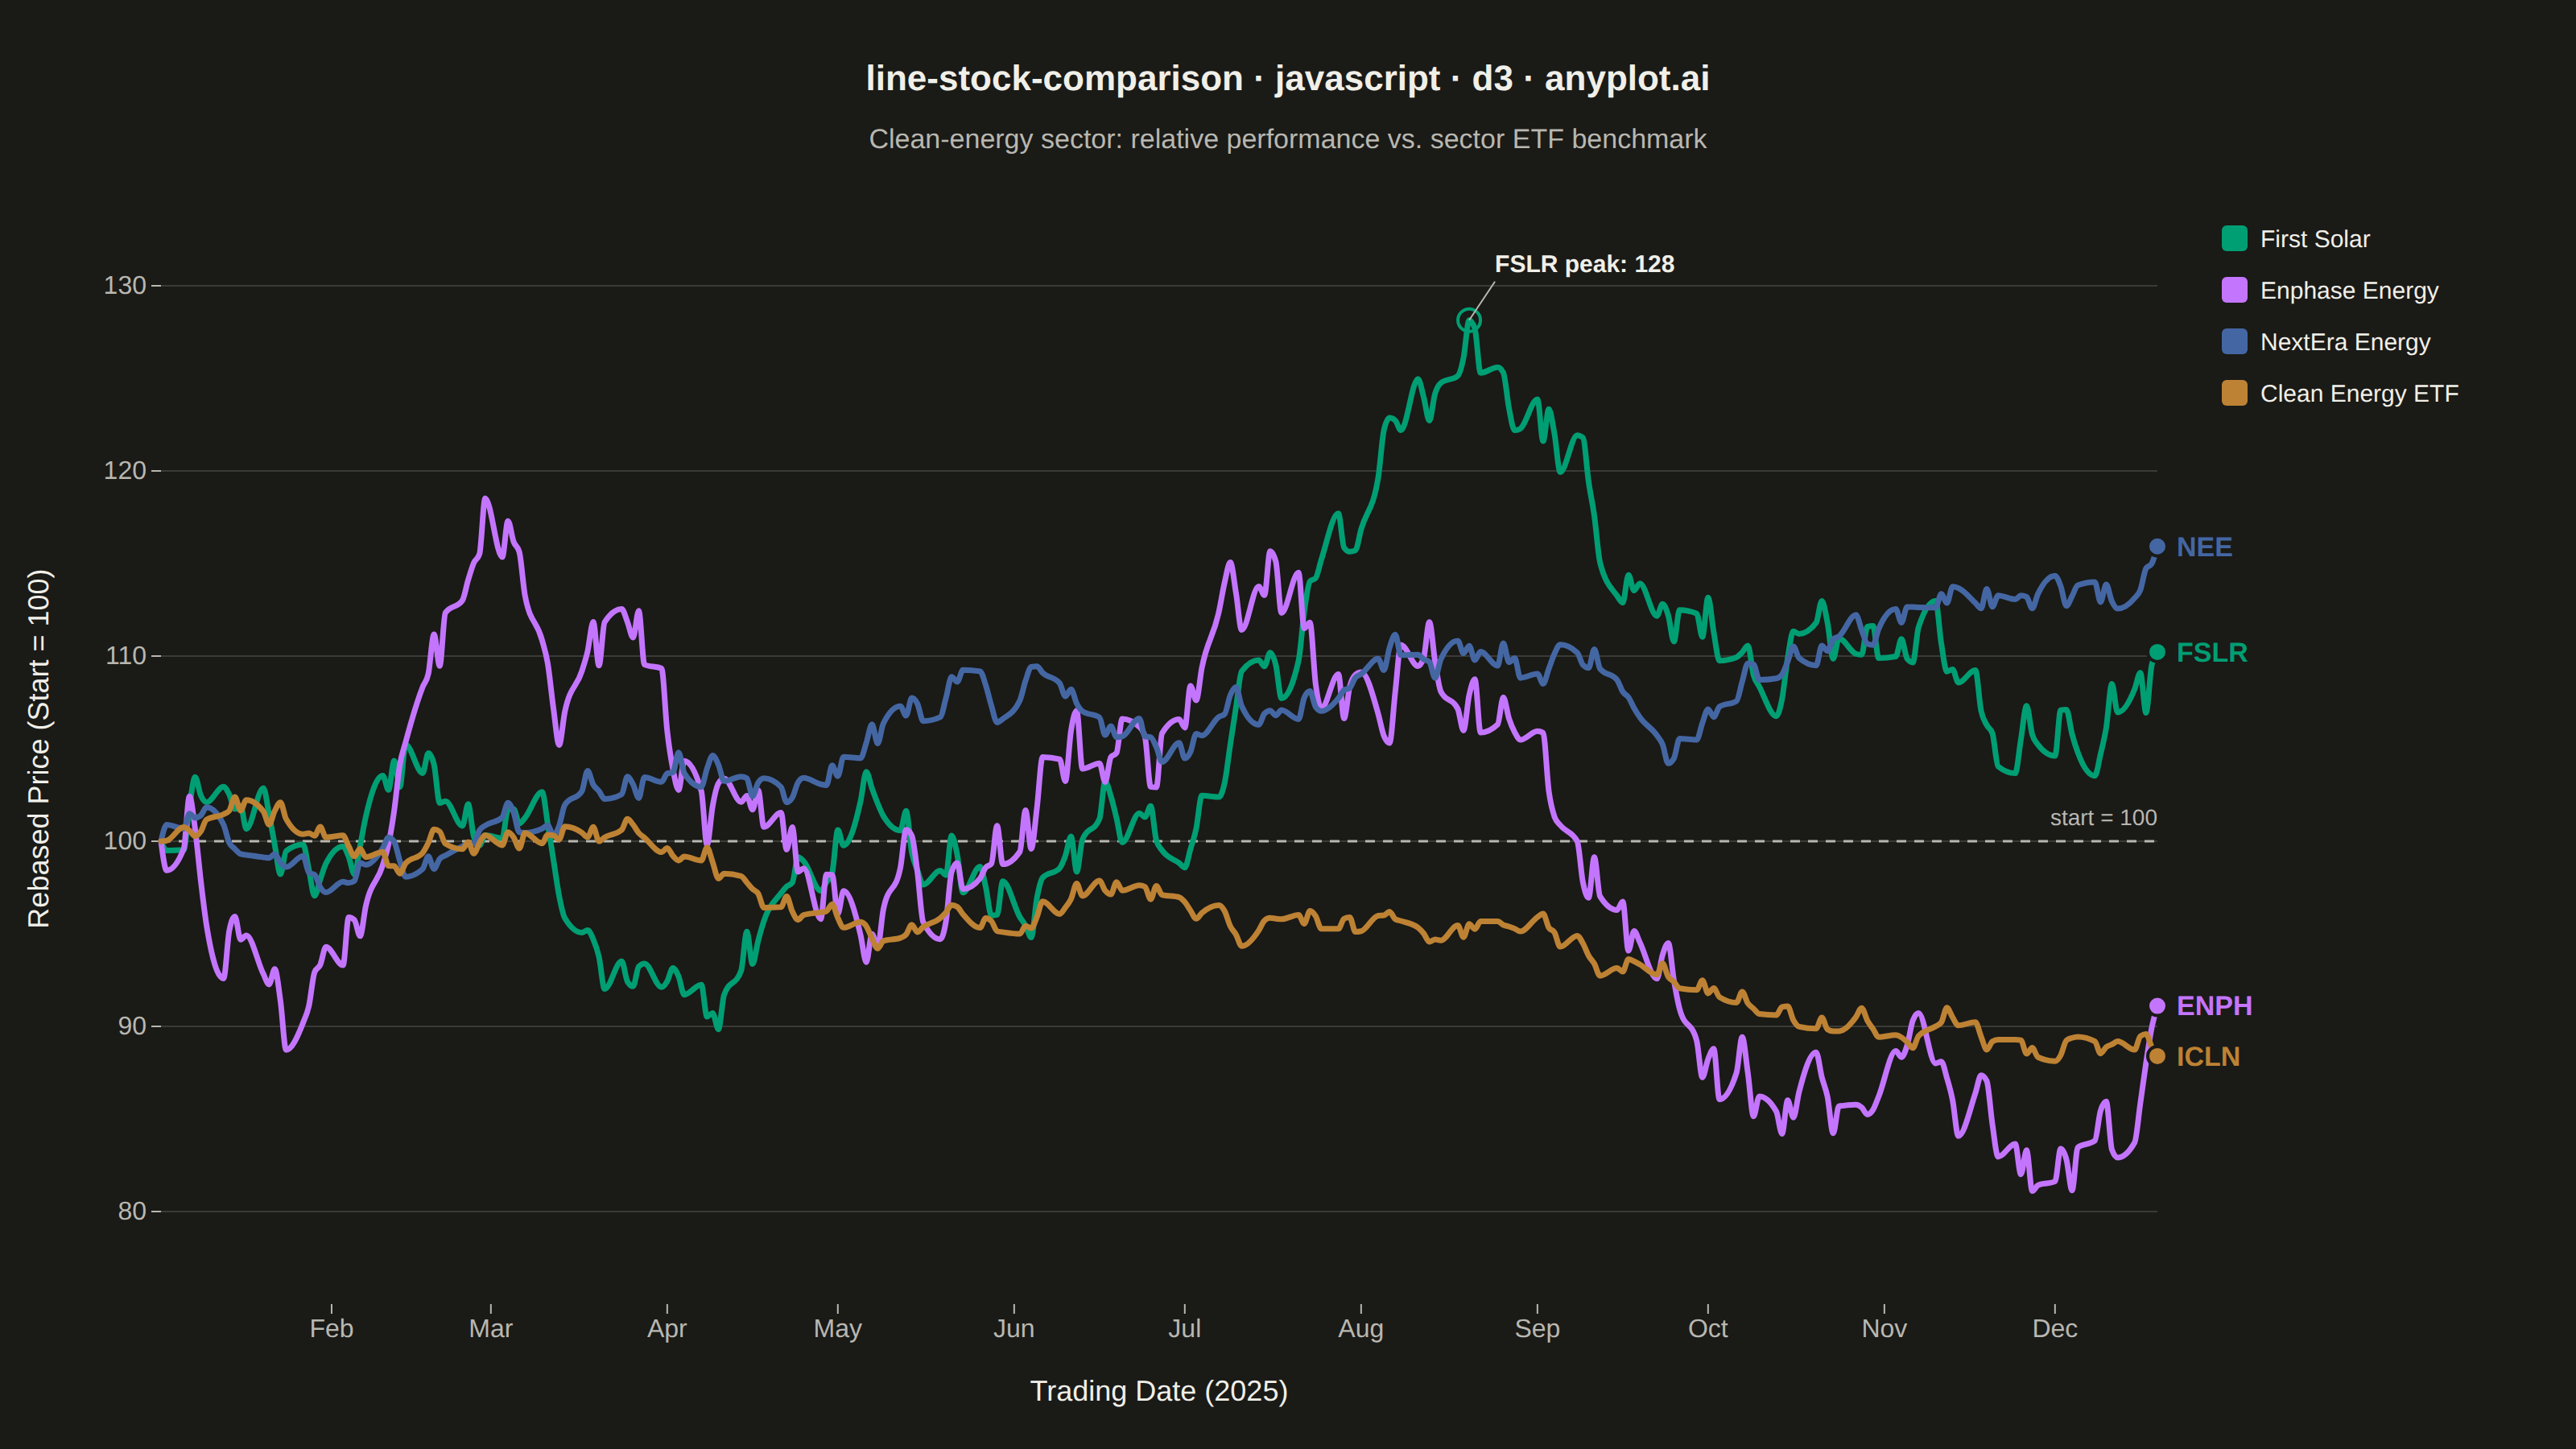
A multi-line chart comparing multiple stock price series normalized to a common starting point (rebased to 100) for direct performance comparison over time. By rebasing all series to the same initial value, investors can easily compare relative returns regardless of absolute price differences. This visualization reveals which stocks outperformed or underperformed relative to each other, making it essential for portfolio analysis and benchmark comparisons.
// anyplot.ai
// line-stock-comparison: Stock Price Comparison Chart
// Library: d3 7.9.0 | JavaScript 22.23.2
// Quality: 92/100 | Created: 2026-08-26

const t = window.ANYPLOT_TOKENS;
const { width, height } = window.ANYPLOT_SIZE;
const margin = { top: 120, right: 260, bottom: 90, left: 100 };
const iw = width - margin.left - margin.right;
const ih = height - margin.top - margin.bottom;

// --- Data (in-memory, deterministic random walk, rebased to 100) -----------
function lcg(seed) {
  let s = seed;
  return () => {
    s = (s * 1664525 + 1013904223) % 4294967296;
    return s / 4294967296;
  };
}
const rand = lcg(20260826);

const numDays = 252; // one trading year (weekdays only)
const startDate = new Date(2025, 0, 2);
const dates = [];
for (let d = new Date(startDate); dates.length < numDays; d.setDate(d.getDate() + 1)) {
  const weekday = d.getDay();
  if (weekday !== 0 && weekday !== 6) dates.push(new Date(d));
}

// Clean-energy sector comparison: three constituents vs. a sector ETF benchmark
const stocks = [
  { symbol: "FSLR", name: "First Solar", startPrice: 210, drift: 0.0011, vol: 0.023 },
  { symbol: "ENPH", name: "Enphase Energy", startPrice: 95, drift: -0.0009, vol: 0.03 },
  { symbol: "NEE", name: "NextEra Energy", startPrice: 72, drift: 0.0003, vol: 0.011 },
  { symbol: "ICLN", name: "Clean Energy ETF", startPrice: 14, drift: 0.0001, vol: 0.009 },
];

const series = stocks.map((stock) => {
  const prices = [stock.startPrice];
  for (let i = 1; i < numDays; i++) {
    const shock = (rand() - 0.5) * stock.vol * 2;
    const next = prices[i - 1] * (1 + stock.drift + shock);
    prices.push(Math.max(next, stock.startPrice * 0.15));
  }
  const first = prices[0];
  return {
    symbol: stock.symbol,
    name: stock.name,
    values: prices.map((price, i) => ({ date: dates[i], rebased: (price / first) * 100 })),
  };
});

// --- Scales -------------------------------------------------------------
const x = d3.scaleTime().domain(d3.extent(dates)).range([0, iw]);

const allRebased = series.flatMap((s) => s.values.map((d) => d.rebased));
const yExtent = d3.extent(allRebased);
const yPad = (yExtent[1] - yExtent[0]) * 0.08;
const y = d3
  .scaleLinear()
  .domain([yExtent[0] - yPad, yExtent[1] + yPad])
  .nice()
  .range([ih, 0]);

const color = d3.scaleOrdinal().domain(series.map((s) => s.symbol)).range(t.palette);

const line = d3
  .line()
  .x((d) => x(d.date))
  .y((d) => y(d.rebased))
  .curve(d3.curveMonotoneX);

// --- SVG mount ------------------------------------------------------------
const svg = d3.select("#container").append("svg").attr("width", width).attr("height", height);
const g = svg.append("g").attr("transform", `translate(${margin.left},${margin.top})`);

// --- Gridlines (y-axis only) -----------------------------------------------
g.append("g")
  .attr("class", "grid")
  .call(d3.axisLeft(y).tickSize(-iw).tickFormat("").ticks(6))
  .call((sel) => sel.select(".domain").remove())
  .call((sel) => sel.selectAll("line").attr("stroke", t.grid));

// --- Baseline reference at rebased = 100 -----------------------------------
g.append("line")
  .attr("x1", 0)
  .attr("x2", iw)
  .attr("y1", y(100))
  .attr("y2", y(100))
  .attr("stroke", t.inkSoft)
  .attr("stroke-width", 1.5)
  .attr("stroke-dasharray", "6,5");

g.append("text")
  .attr("x", iw)
  .attr("y", y(100) - 10)
  .attr("text-anchor", "end")
  .attr("fill", t.inkSoft)
  .style("font-size", "14px")
  .text("start = 100");

// --- Axes -------------------------------------------------------------------
const xAxis = g
  .append("g")
  .attr("transform", `translate(0,${ih})`)
  .call(d3.axisBottom(x).ticks(d3.timeMonth.every(1)).tickFormat(d3.timeFormat("%b")));
const yAxis = g.append("g").call(d3.axisLeft(y).ticks(6));
for (const axis of [xAxis, yAxis]) {
  axis.selectAll("text").attr("fill", t.inkSoft).style("font-size", "16px");
  axis.selectAll("line").attr("stroke", t.inkSoft);
  axis.select(".domain").remove();
}

// --- Lines ------------------------------------------------------------------
g.selectAll(".stock-line")
  .data(series)
  .join("path")
  .attr("class", "stock-line")
  .attr("fill", "none")
  .attr("stroke", (d) => color(d.symbol))
  .attr("stroke-width", 3.5)
  .attr("stroke-linejoin", "round")
  .attr("stroke-linecap", "round")
  .attr("d", (d) => line(d.values));

// --- Endpoint markers + inline symbol labels --------------------------------
const endpoints = g
  .selectAll(".endpoint")
  .data(series)
  .join("g")
  .attr("class", "endpoint")
  .attr("transform", (d) => {
    const last = d.values[d.values.length - 1];
    return `translate(${x(last.date)},${y(last.rebased)})`;
  });

endpoints.append("circle").attr("r", 6).attr("fill", (d) => color(d.symbol)).attr("stroke", t.pageBg).attr("stroke-width", 2);

endpoints
  .append("text")
  .attr("x", 12)
  .attr("dy", "0.35em")
  .attr("fill", (d) => color(d.symbol))
  .style("font-size", "17px")
  .style("font-weight", "600")
  .text((d) => d.symbol);

// --- Peak annotation (computed extremum via d3.greatest) -------------------
const flatPoints = series.flatMap((s) => s.values.map((d) => ({ ...d, symbol: s.symbol })));
const peak = d3.greatest(flatPoints, (d) => d.rebased);
const peakX = x(peak.date);
const peakY = y(peak.rebased);
const peakLabelAbove = peakY > 60;
const peakLabelY = peakLabelAbove ? peakY - 30 : peakY + 40;
const peakLabelAnchor = peakX > iw * 0.8 ? "end" : "start";
const peakLabelX = peakX + (peakLabelAnchor === "end" ? -16 : 16);

g.append("circle")
  .attr("cx", peakX)
  .attr("cy", peakY)
  .attr("r", 7)
  .attr("fill", "none")
  .attr("stroke", color(peak.symbol))
  .attr("stroke-width", 2);

g.append("line")
  .attr("x1", peakX)
  .attr("y1", peakY)
  .attr("x2", peakLabelX)
  .attr("y2", peakLabelY + (peakLabelAbove ? 6 : -6))
  .attr("stroke", t.inkSoft)
  .attr("stroke-width", 1);

g.append("text")
  .attr("x", peakLabelX)
  .attr("y", peakLabelY)
  .attr("text-anchor", peakLabelAnchor)
  .attr("fill", t.ink)
  .style("font-size", "15px")
  .style("font-weight", "600")
  .text(`${peak.symbol} peak: ${peak.rebased.toFixed(0)}`);

// --- Axis labels --------------------------------------------------------------
g.append("text")
  .attr("x", iw / 2)
  .attr("y", ih + 60)
  .attr("text-anchor", "middle")
  .attr("fill", t.ink)
  .style("font-size", "18px")
  .text("Trading Date (2025)");

g.append("text")
  .attr("transform", "rotate(-90)")
  .attr("x", -ih / 2)
  .attr("y", -70)
  .attr("text-anchor", "middle")
  .attr("fill", t.ink)
  .style("font-size", "18px")
  .text("Rebased Price (Start = 100)");

// --- Legend -------------------------------------------------------------------
const legend = svg
  .append("g")
  .attr("transform", `translate(${margin.left + iw + 40},${margin.top + 20})`);

const legendRows = legend
  .selectAll(".legend-row")
  .data(series)
  .join("g")
  .attr("class", "legend-row")
  .attr("transform", (d, i) => `translate(0,${i * 32})`);

legendRows
  .append("rect")
  .attr("width", 16)
  .attr("height", 16)
  .attr("rx", 3)
  .attr("fill", (d) => color(d.symbol));

legendRows
  .append("text")
  .attr("x", 24)
  .attr("y", 8)
  .attr("dy", "0.35em")
  .attr("fill", t.ink)
  .style("font-size", "15px")
  .text((d) => d.name);

// --- Title ------------------------------------------------------------------
svg
  .append("text")
  .attr("x", width / 2)
  .attr("y", 56)
  .attr("text-anchor", "middle")
  .attr("fill", t.ink)
  .style("font-size", "22px")
  .style("font-weight", "600")
  .text("line-stock-comparison · javascript · d3 · anyplot.ai");

svg
  .append("text")
  .attr("x", width / 2)
  .attr("y", 92)
  .attr("text-anchor", "middle")
  .attr("fill", t.inkSoft)
  .style("font-size", "17px")
  .text("Clean-energy sector: relative performance vs. sector ETF benchmark");
Runnable source as JSON, for any HTTP client: https://api.anyplot.ai/specs/line-stock-comparison/d3/code. Any spec id and library id listed in llms-full.txt fit the same URL shape; every URL below is complete and callable.
{
  "spec_id": "line-stock-comparison",
  "language": "javascript",
  "library": "d3",
  "page": "https://anyplot.ai/line-stock-comparison/javascript/d3",
  "hub": "https://anyplot.ai/line-stock-comparison",
  "code_json": "https://api.anyplot.ai/specs/line-stock-comparison/d3/code",
  "spec_json": "https://api.anyplot.ai/specs/line-stock-comparison",
  "render_light_png": "https://storage.googleapis.com/anyplot-images/plots/line-stock-comparison/javascript/d3/plot-light.png",
  "render_dark_png": "https://storage.googleapis.com/anyplot-images/plots/line-stock-comparison/javascript/d3/plot-dark.png",
  "interactive_light_html": "https://storage.googleapis.com/anyplot-images/plots/line-stock-comparison/javascript/d3/plot-light.html",
  "interactive_dark_html": "https://storage.googleapis.com/anyplot-images/plots/line-stock-comparison/javascript/d3/plot-dark.html",
  "quality_score": 92.0,
  "license": "MIT",
  "guide": "https://anyplot.ai/llms.txt"
}
Part of Stock Price Comparison Chart on anyplot.ai.