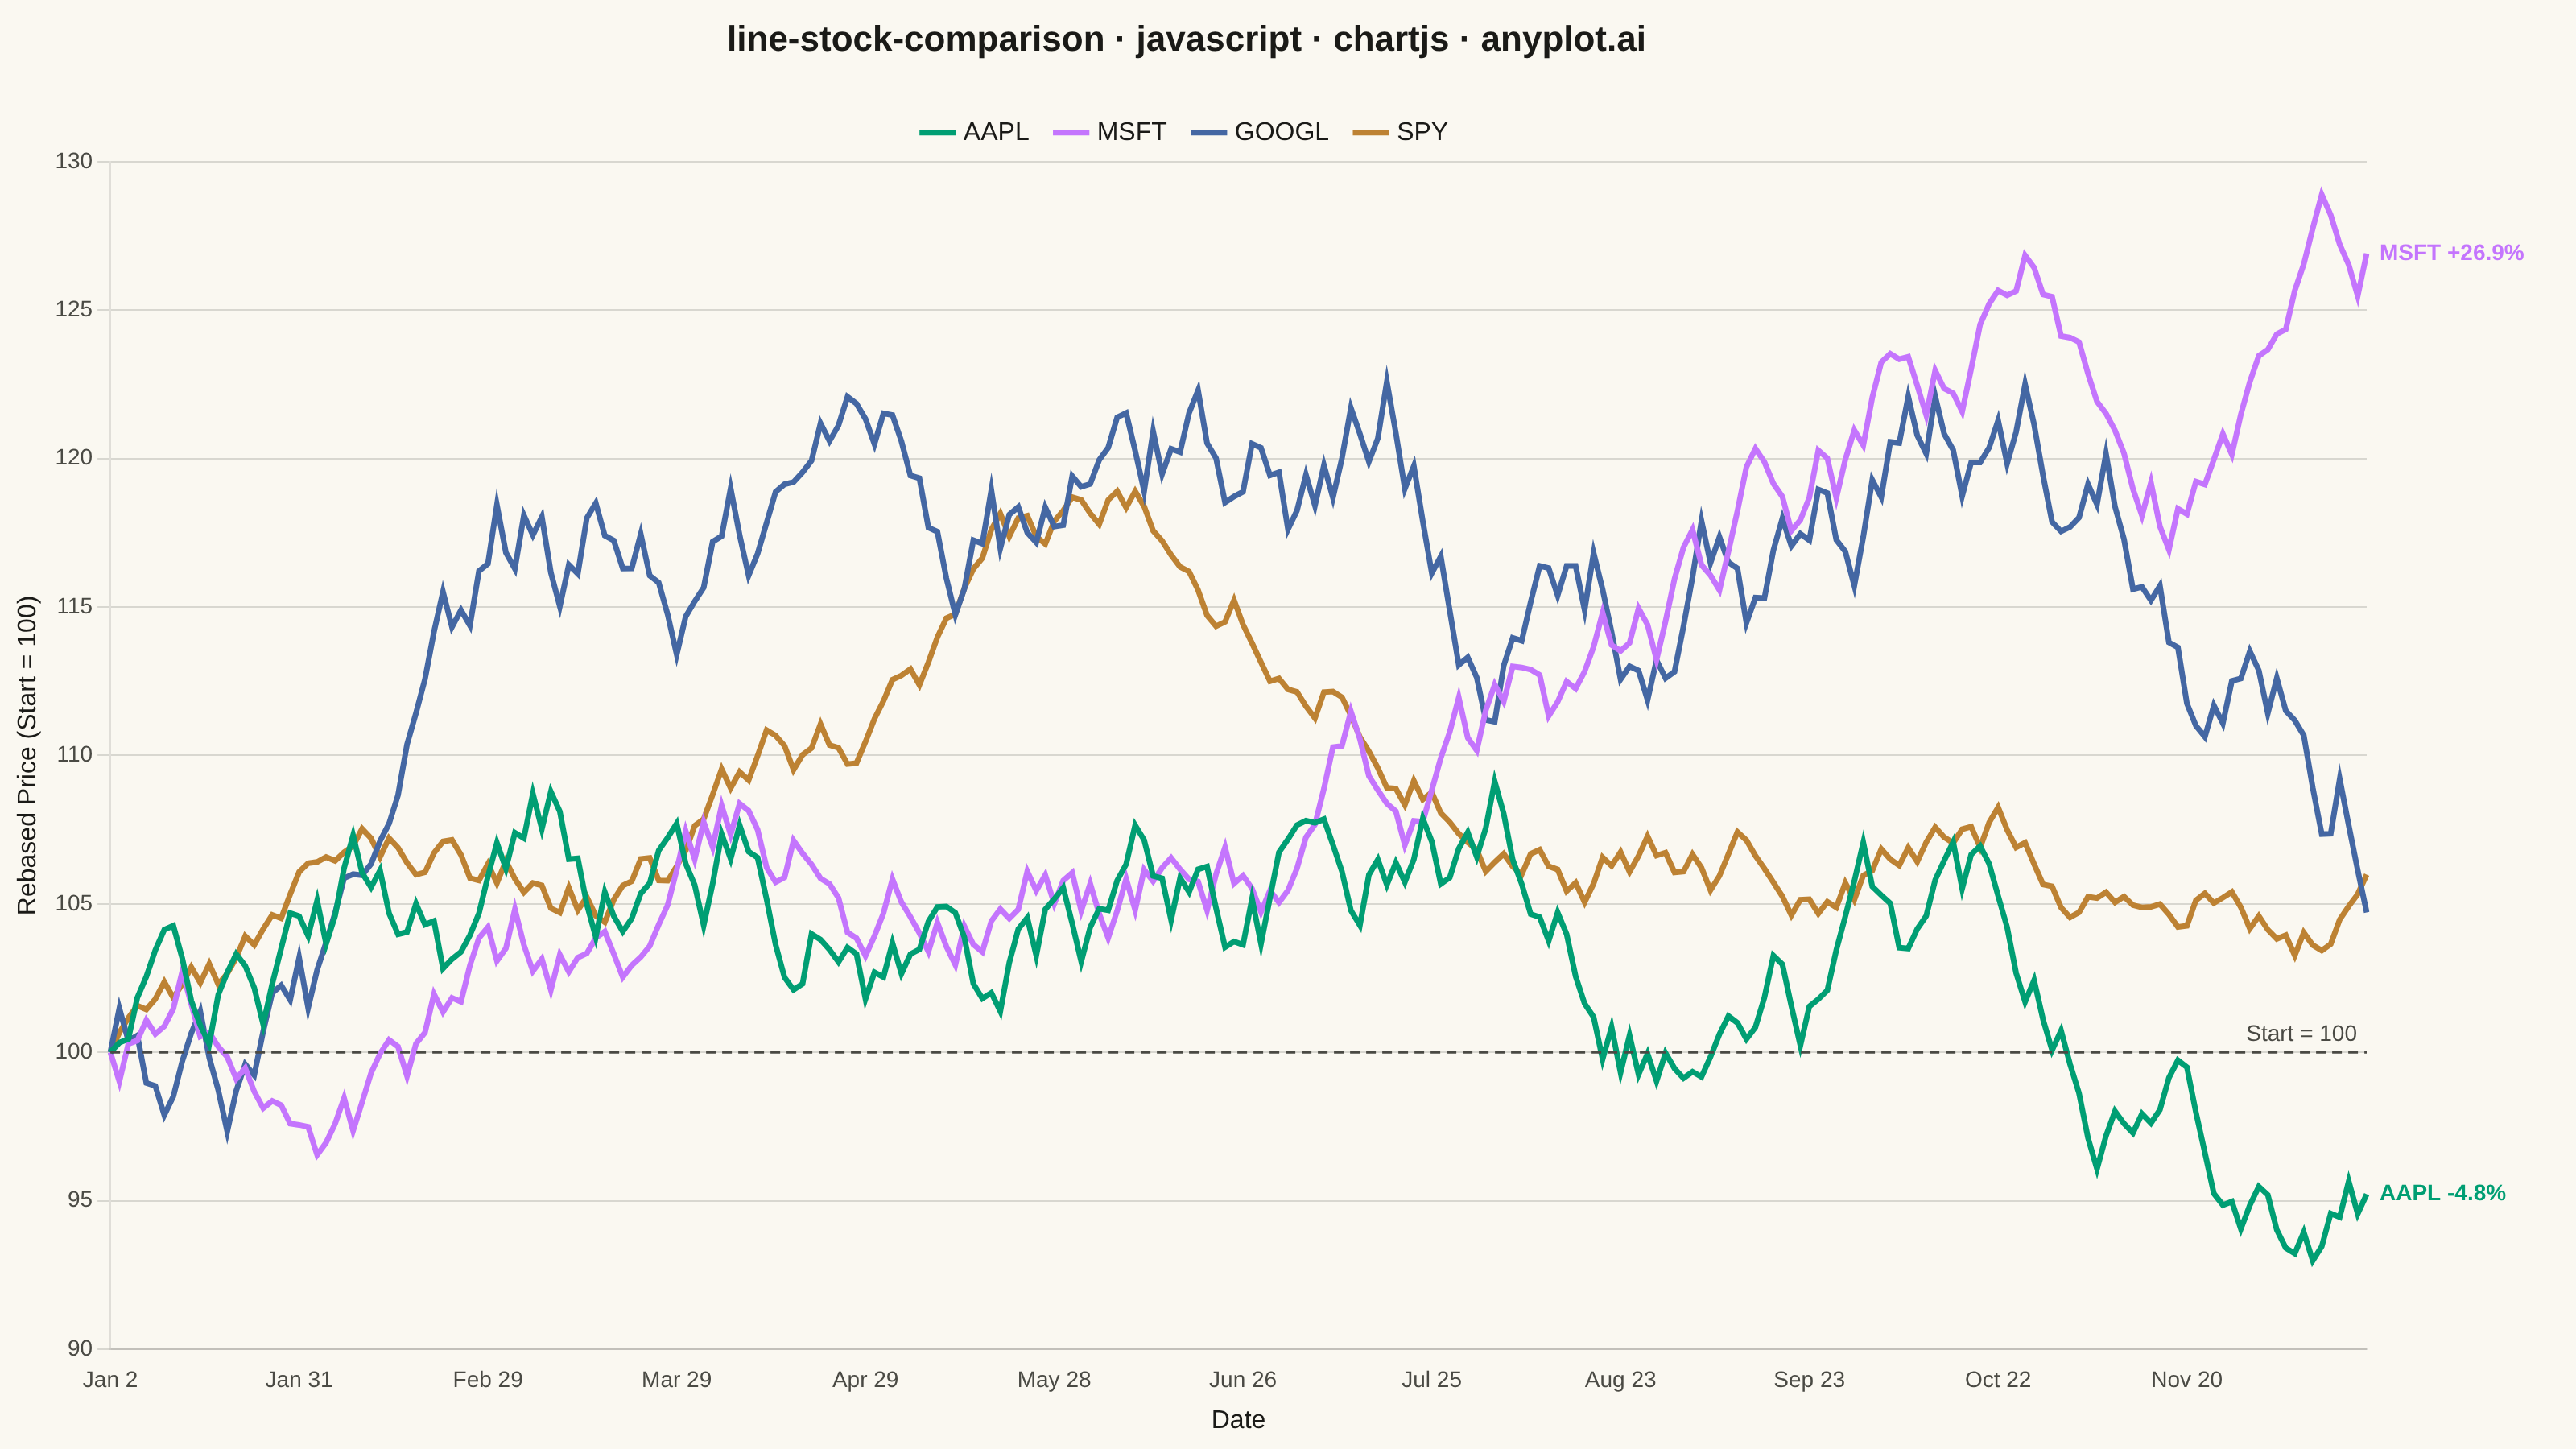
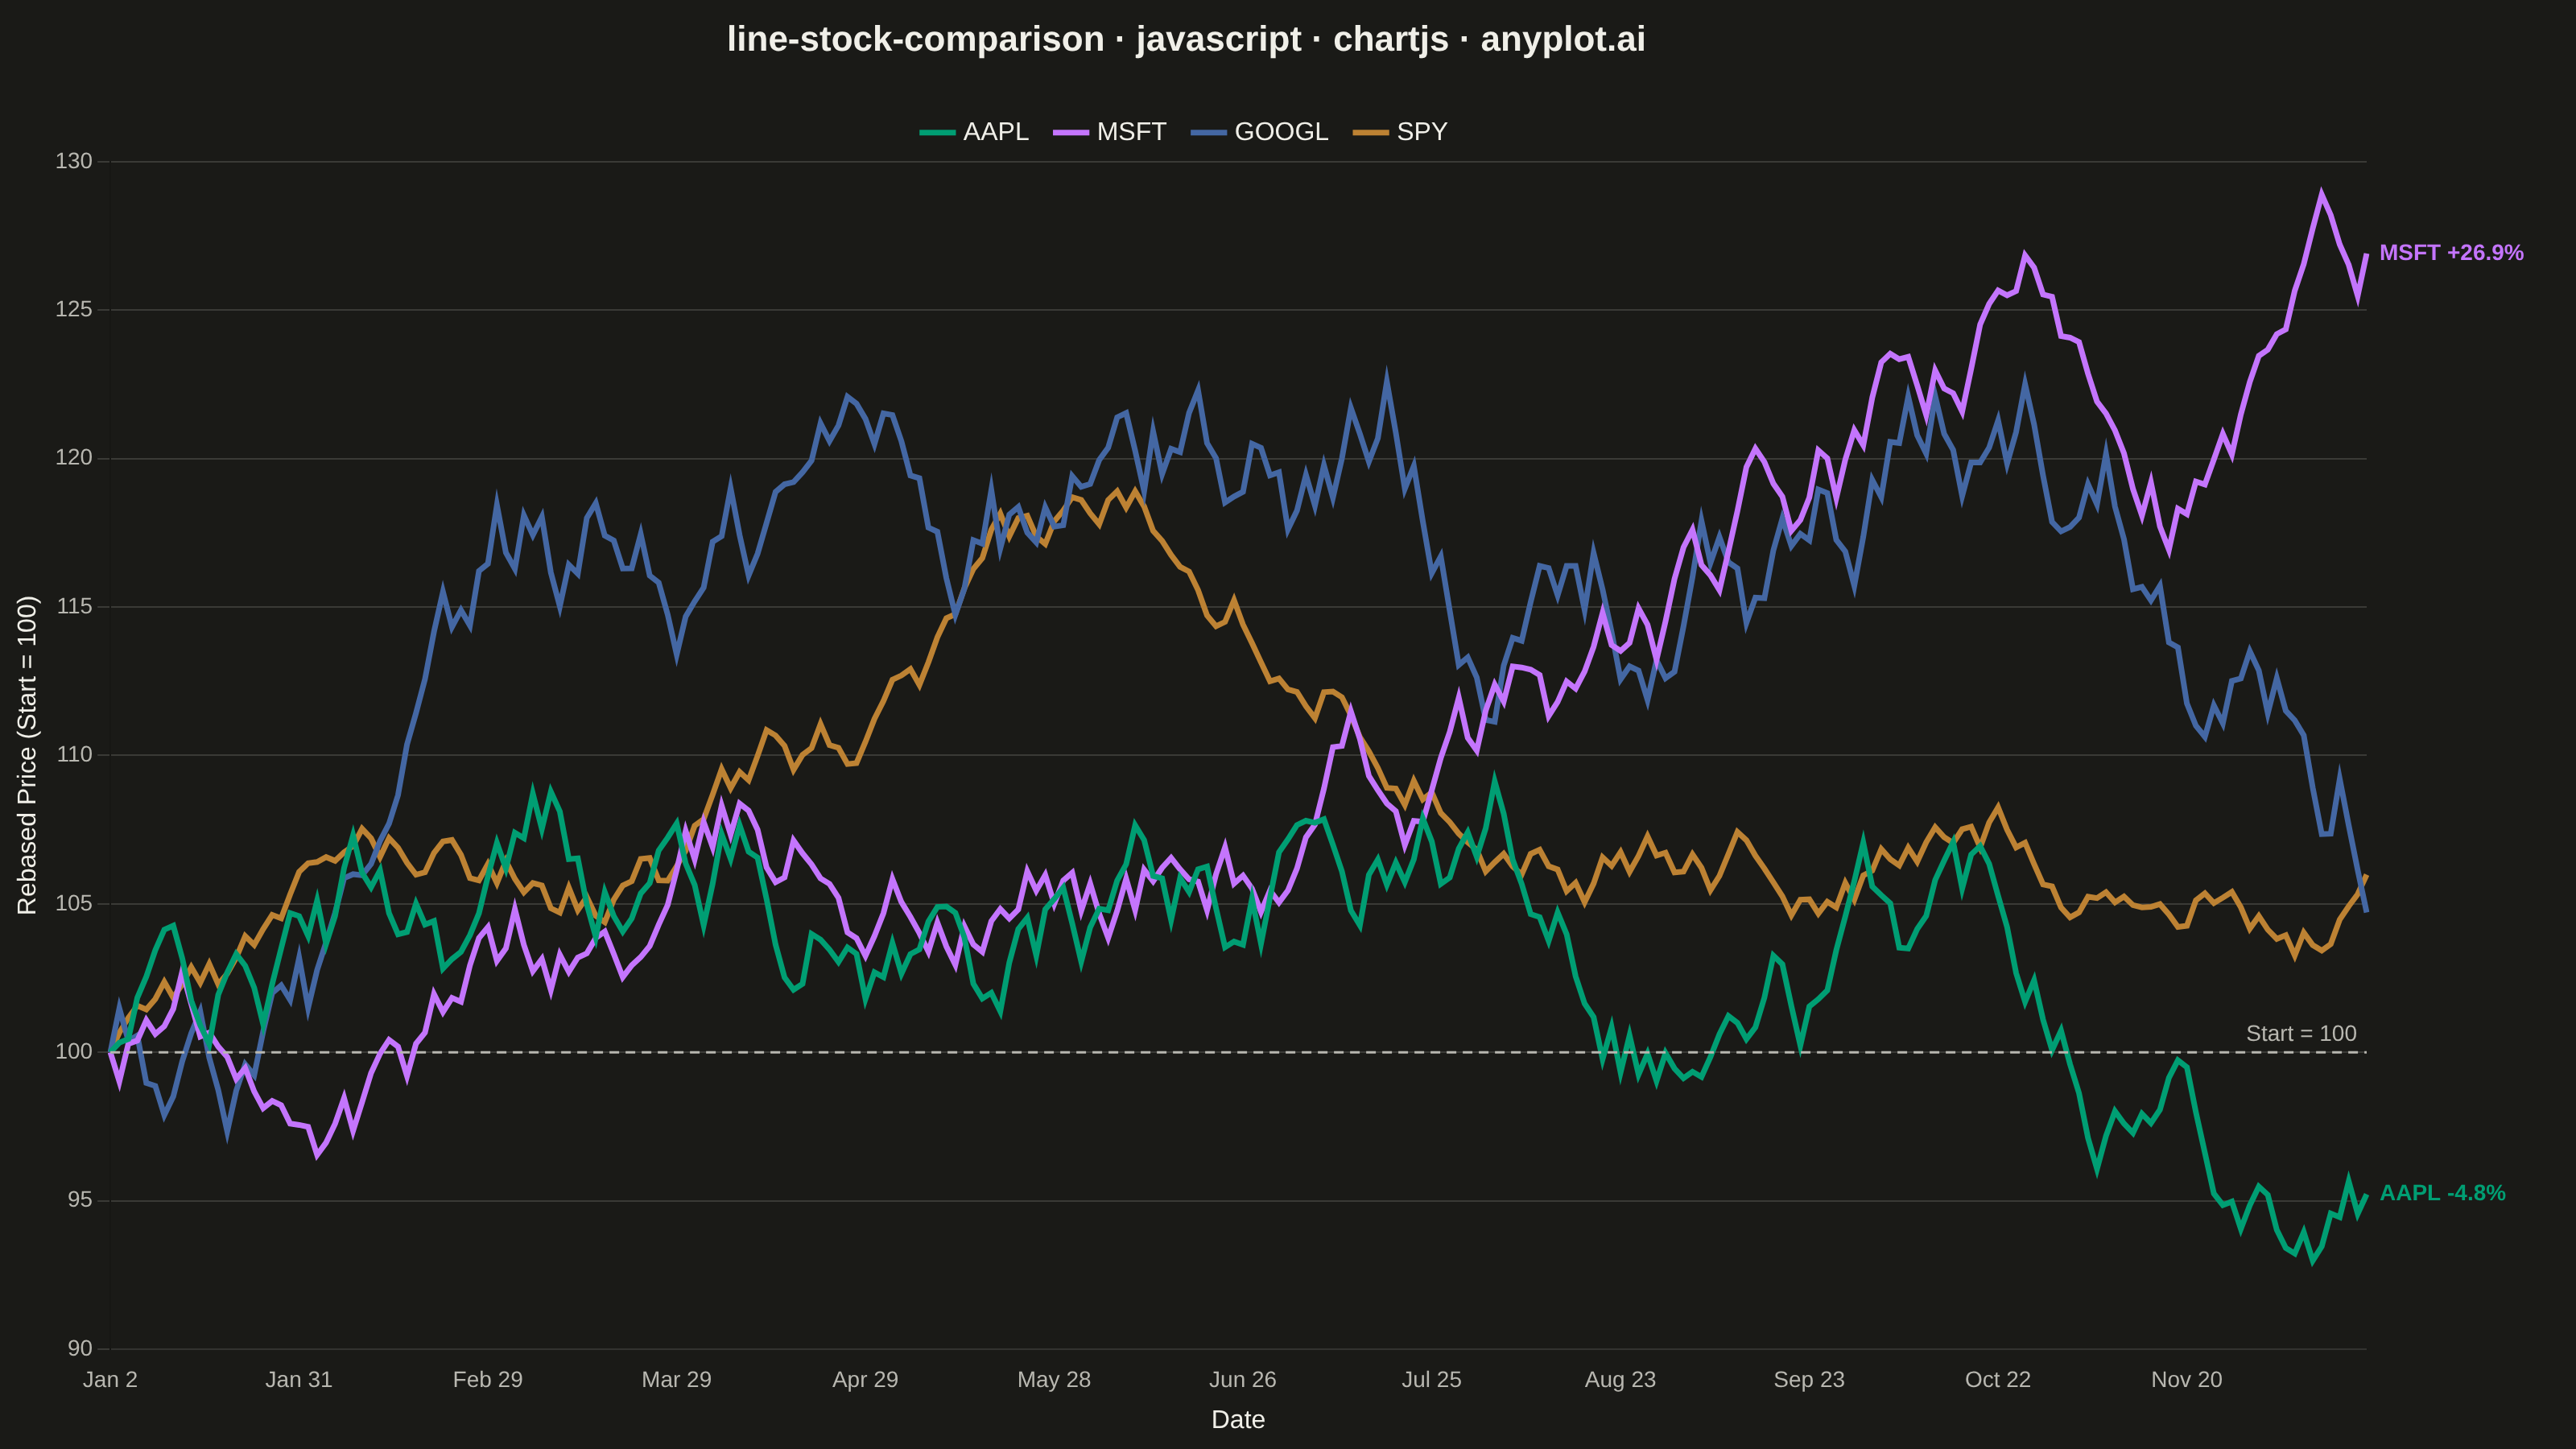
The same plot in 14 other libraries — JavaScript: D3.js, Apache ECharts, Highcharts, MUI X Charts; Python: Altair, Bokeh, lets-plot, Matplotlib, Plotly, plotnine, Pygal, Seaborn; R: ggplot2; Julia: Makie.jl. Compare all 15 side by side: Stock Price Comparison Chart in Python, R, Julia and JavaScript.
A multi-line chart comparing multiple stock price series normalized to a common starting point (rebased to 100) for direct performance comparison over time. By rebasing all series to the same initial value, investors can easily compare relative returns regardless of absolute price differences. This visualization reveals which stocks outperformed or underperformed relative to each other, making it essential for portfolio analysis and benchmark comparisons.
// anyplot.ai
// line-stock-comparison: Stock Price Comparison Chart
// Library: chartjs 4.4.7 | JavaScript 22.23.2
// Quality: 95/100 | Created: 2026-08-26
//# anyplot-orientation: landscape

const t = window.ANYPLOT_TOKENS;

// --- Data (in-memory, deterministic) ----------------------------------------
// One year of simulated daily closes for four tickers, each with its own
// drift/volatility so the rebased comparison shows real divergence between
// winners and laggards. SPY stands in as the lower-volatility benchmark index.
let seed = 42;
const nextRand = () => {
  seed = (seed * 1103515245 + 12345) & 0x7fffffff;
  return seed / 0x7fffffff;
};

const DAYS = 252;
const START_DATE = new Date("2024-01-02T00:00:00Z");
const MONTHS = ["Jan", "Feb", "Mar", "Apr", "May", "Jun", "Jul", "Aug", "Sep", "Oct", "Nov", "Dec"];

const dateLabels = [];
const cursor = new Date(START_DATE);
while (dateLabels.length < DAYS) {
  const weekday = cursor.getUTCDay();
  if (weekday !== 0 && weekday !== 6) {
    dateLabels.push(`${MONTHS[cursor.getUTCMonth()]} ${cursor.getUTCDate()}`);
  }
  cursor.setUTCDate(cursor.getUTCDate() + 1);
}

const STOCKS = [
  { symbol: "AAPL", start: 185, drift: 0.0006, vol: 0.016 },
  { symbol: "MSFT", start: 370, drift: 0.0005, vol: 0.013 },
  { symbol: "GOOGL", start: 140, drift: 0.0003, vol: 0.017 },
  { symbol: "SPY", start: 475, drift: 0.0004, vol: 0.008 },
];

const series = STOCKS.map(({ symbol, start, drift, vol }) => {
  const prices = [start];
  for (let day = 1; day < DAYS; day++) {
    const shock = (nextRand() - 0.5) * 2 * vol;
    prices.push(prices[day - 1] * (1 + drift + shock));
  }
  const firstPrice = prices[0];
  return { symbol, rebased: prices.map((price) => (price / firstPrice) * 100) };
});

// Thin dashed line at the common rebase point, drawn with Chart.js's native
// per-chart plugin hook (no external annotation plugin). Font matches the
// axis tick font (14px, Chart.js default family) instead of a hardcoded value.
const baselinePlugin = {
  id: "baselineMarker",
  afterDraw(chart) {
    const { ctx, chartArea, scales } = chart;
    const y = scales.y.getPixelForValue(100);
    ctx.save();
    ctx.strokeStyle = t.inkSoft;
    ctx.lineWidth = 1.5;
    ctx.setLineDash([6, 4]);
    ctx.beginPath();
    ctx.moveTo(chartArea.left, y);
    ctx.lineTo(chartArea.right, y);
    ctx.stroke();

    ctx.setLineDash([]);
    ctx.fillStyle = t.inkSoft;
    ctx.font = `14px ${Chart.defaults.font.family}`;
    ctx.textAlign = "right";
    ctx.textBaseline = "bottom";
    ctx.fillText("Start = 100", chartArea.right - 6, y - 4);
    ctx.restore();
  },
};

// End-of-series callout: labels the year's best and worst performer directly
// at their final data point, sharpening the takeaway beyond the legend alone.
const bestIdx = series.reduce((best, s, i) => (s.rebased.at(-1) > series[best].rebased.at(-1) ? i : best), 0);
const worstIdx = series.reduce((worst, s, i) => (s.rebased.at(-1) < series[worst].rebased.at(-1) ? i : worst), 0);

const performanceLabelsPlugin = {
  id: "performanceLabels",
  afterDatasetsDraw(chart) {
    const { ctx, chartArea, scales } = chart;
    ctx.save();
    ctx.font = `600 14px ${Chart.defaults.font.family}`;
    ctx.textAlign = "left";
    ctx.textBaseline = "middle";
    [bestIdx, worstIdx].forEach((i) => {
      const finalValue = series[i].rebased.at(-1);
      const change = finalValue - 100;
      const sign = change >= 0 ? "+" : "";
      ctx.fillStyle = t.palette[i];
      ctx.fillText(
        `${series[i].symbol} ${sign}${change.toFixed(1)}%`,
        chartArea.right + 8,
        scales.y.getPixelForValue(finalValue),
      );
    });
    ctx.restore();
  },
};

// --- Mount -------------------------------------------------------------------
const canvas = document.createElement("canvas");
document.getElementById("container").appendChild(canvas);

// --- Chart -------------------------------------------------------------------
new Chart(canvas, {
  type: "line",
  data: {
    labels: dateLabels,
    datasets: series.map((s, i) => ({
      label: s.symbol,
      data: s.rebased,
      borderColor: t.palette[i],
      backgroundColor: t.palette[i],
      borderWidth: 3.5,
      pointRadius: 0,
      pointHoverRadius: 4,
      tension: 0,
    })),
  },
  plugins: [baselinePlugin, performanceLabelsPlugin],
  options: {
    responsive: true,
    maintainAspectRatio: false,
    animation: false,
    interaction: { intersect: false, mode: "index" },
    layout: { padding: { top: 8, right: 130, bottom: 4, left: 4 } },
    plugins: {
      title: {
        display: true,
        text: "line-stock-comparison · javascript · chartjs · anyplot.ai",
        color: t.ink,
        font: { size: 22, weight: "bold" },
        padding: { top: 4, bottom: 18 },
      },
      legend: {
        labels: { color: t.ink, font: { size: 16 }, usePointStyle: true, pointStyle: "line", padding: 18 },
      },
    },
    scales: {
      x: {
        ticks: { color: t.inkSoft, font: { size: 14 }, maxTicksLimit: 12, maxRotation: 0 },
        grid: { display: false },
        title: { display: true, text: "Date", color: t.ink, font: { size: 16 } },
      },
      y: {
        ticks: { color: t.inkSoft, font: { size: 14 } },
        grid: { color: t.grid },
        title: { display: true, text: "Rebased Price (Start = 100)", color: t.ink, font: { size: 16 } },
      },
    },
  },
});
Runnable source as JSON, for any HTTP client: https://api.anyplot.ai/specs/line-stock-comparison/chartjs/code. Any spec id and library id listed in llms-full.txt fit the same URL shape; every URL below is complete and callable.
{
  "spec_id": "line-stock-comparison",
  "language": "javascript",
  "library": "chartjs",
  "page": "https://anyplot.ai/line-stock-comparison/javascript/chartjs",
  "hub": "https://anyplot.ai/line-stock-comparison",
  "code_json": "https://api.anyplot.ai/specs/line-stock-comparison/chartjs/code",
  "spec_json": "https://api.anyplot.ai/specs/line-stock-comparison",
  "render_light_png": "https://storage.googleapis.com/anyplot-images/plots/line-stock-comparison/javascript/chartjs/plot-light.png",
  "render_dark_png": "https://storage.googleapis.com/anyplot-images/plots/line-stock-comparison/javascript/chartjs/plot-dark.png",
  "interactive_light_html": "https://storage.googleapis.com/anyplot-images/plots/line-stock-comparison/javascript/chartjs/plot-light.html",
  "interactive_dark_html": "https://storage.googleapis.com/anyplot-images/plots/line-stock-comparison/javascript/chartjs/plot-dark.html",
  "quality_score": 95.0,
  "license": "MIT",
  "guide": "https://anyplot.ai/llms.txt"
}
Part of Stock Price Comparison Chart on anyplot.ai.