The same plot in 14 other libraries — Python: Altair, Bokeh, lets-plot, Matplotlib, Plotly, plotnine, Pygal, Seaborn; R: ggplot2; JavaScript: Chart.js, D3.js, Apache ECharts, Highcharts, MUI X Charts. Compare all 15 side by side: Stock Price Comparison Chart in Python, R, Julia and JavaScript.
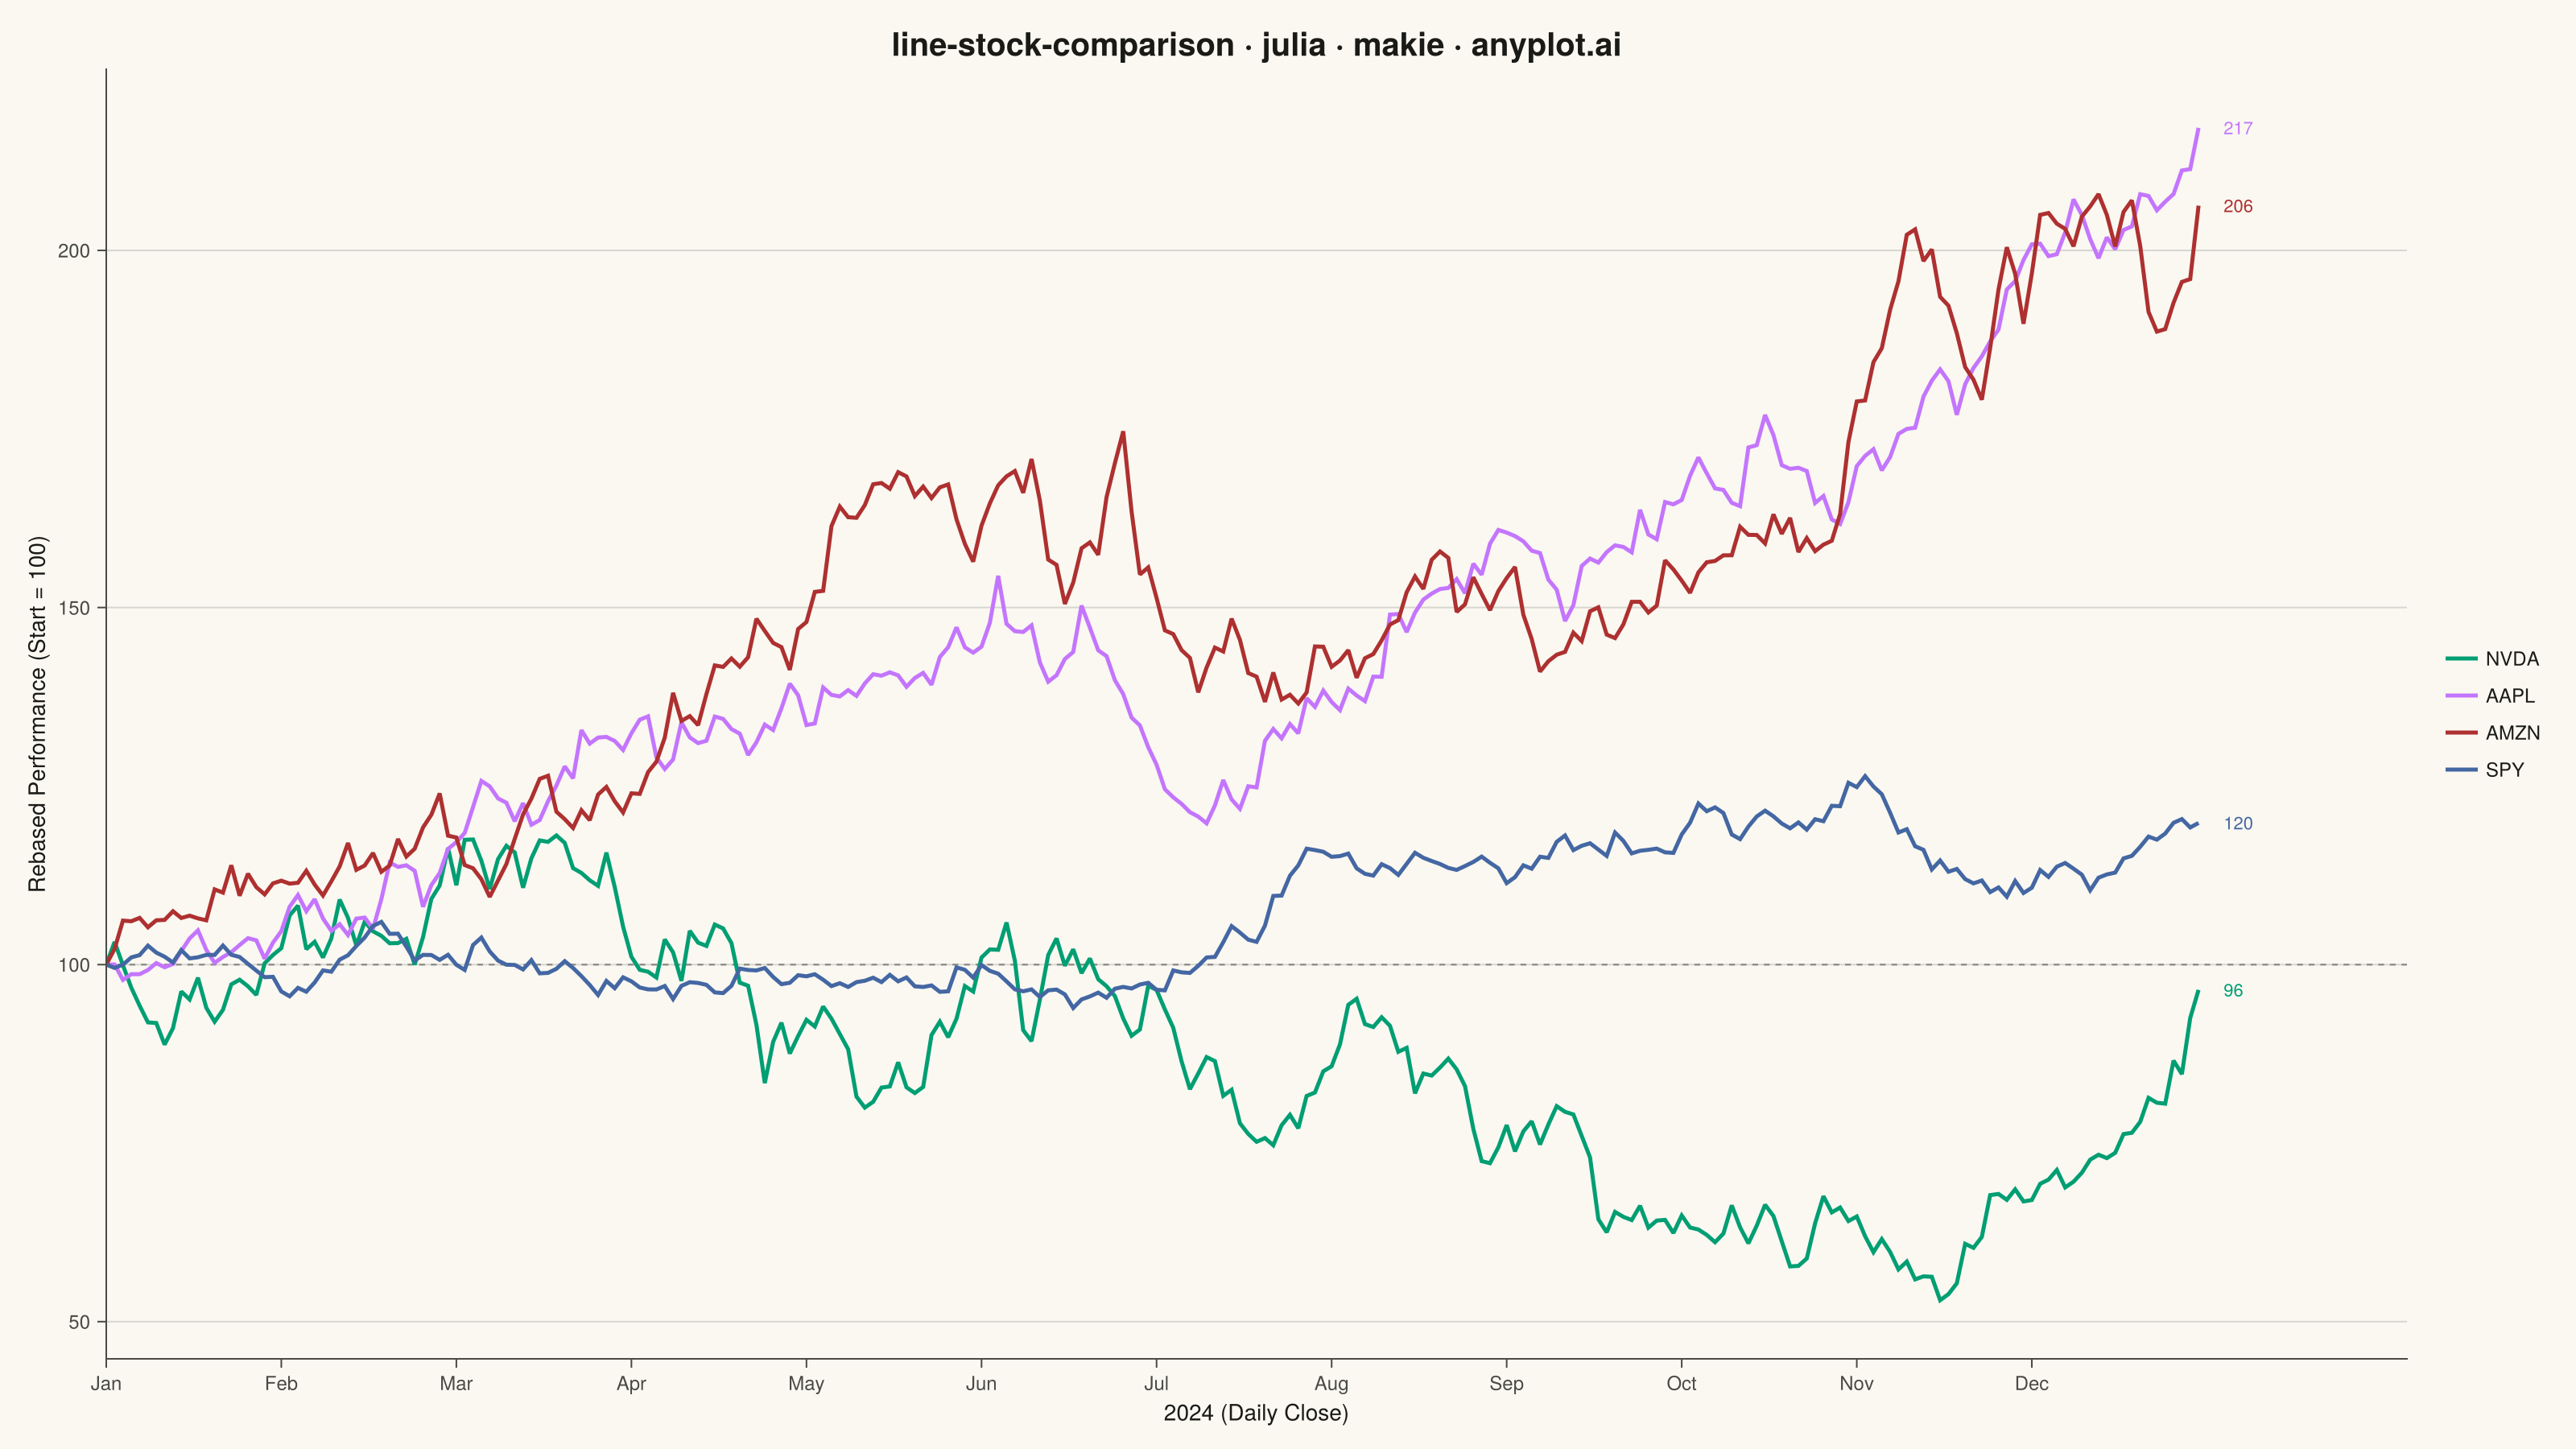
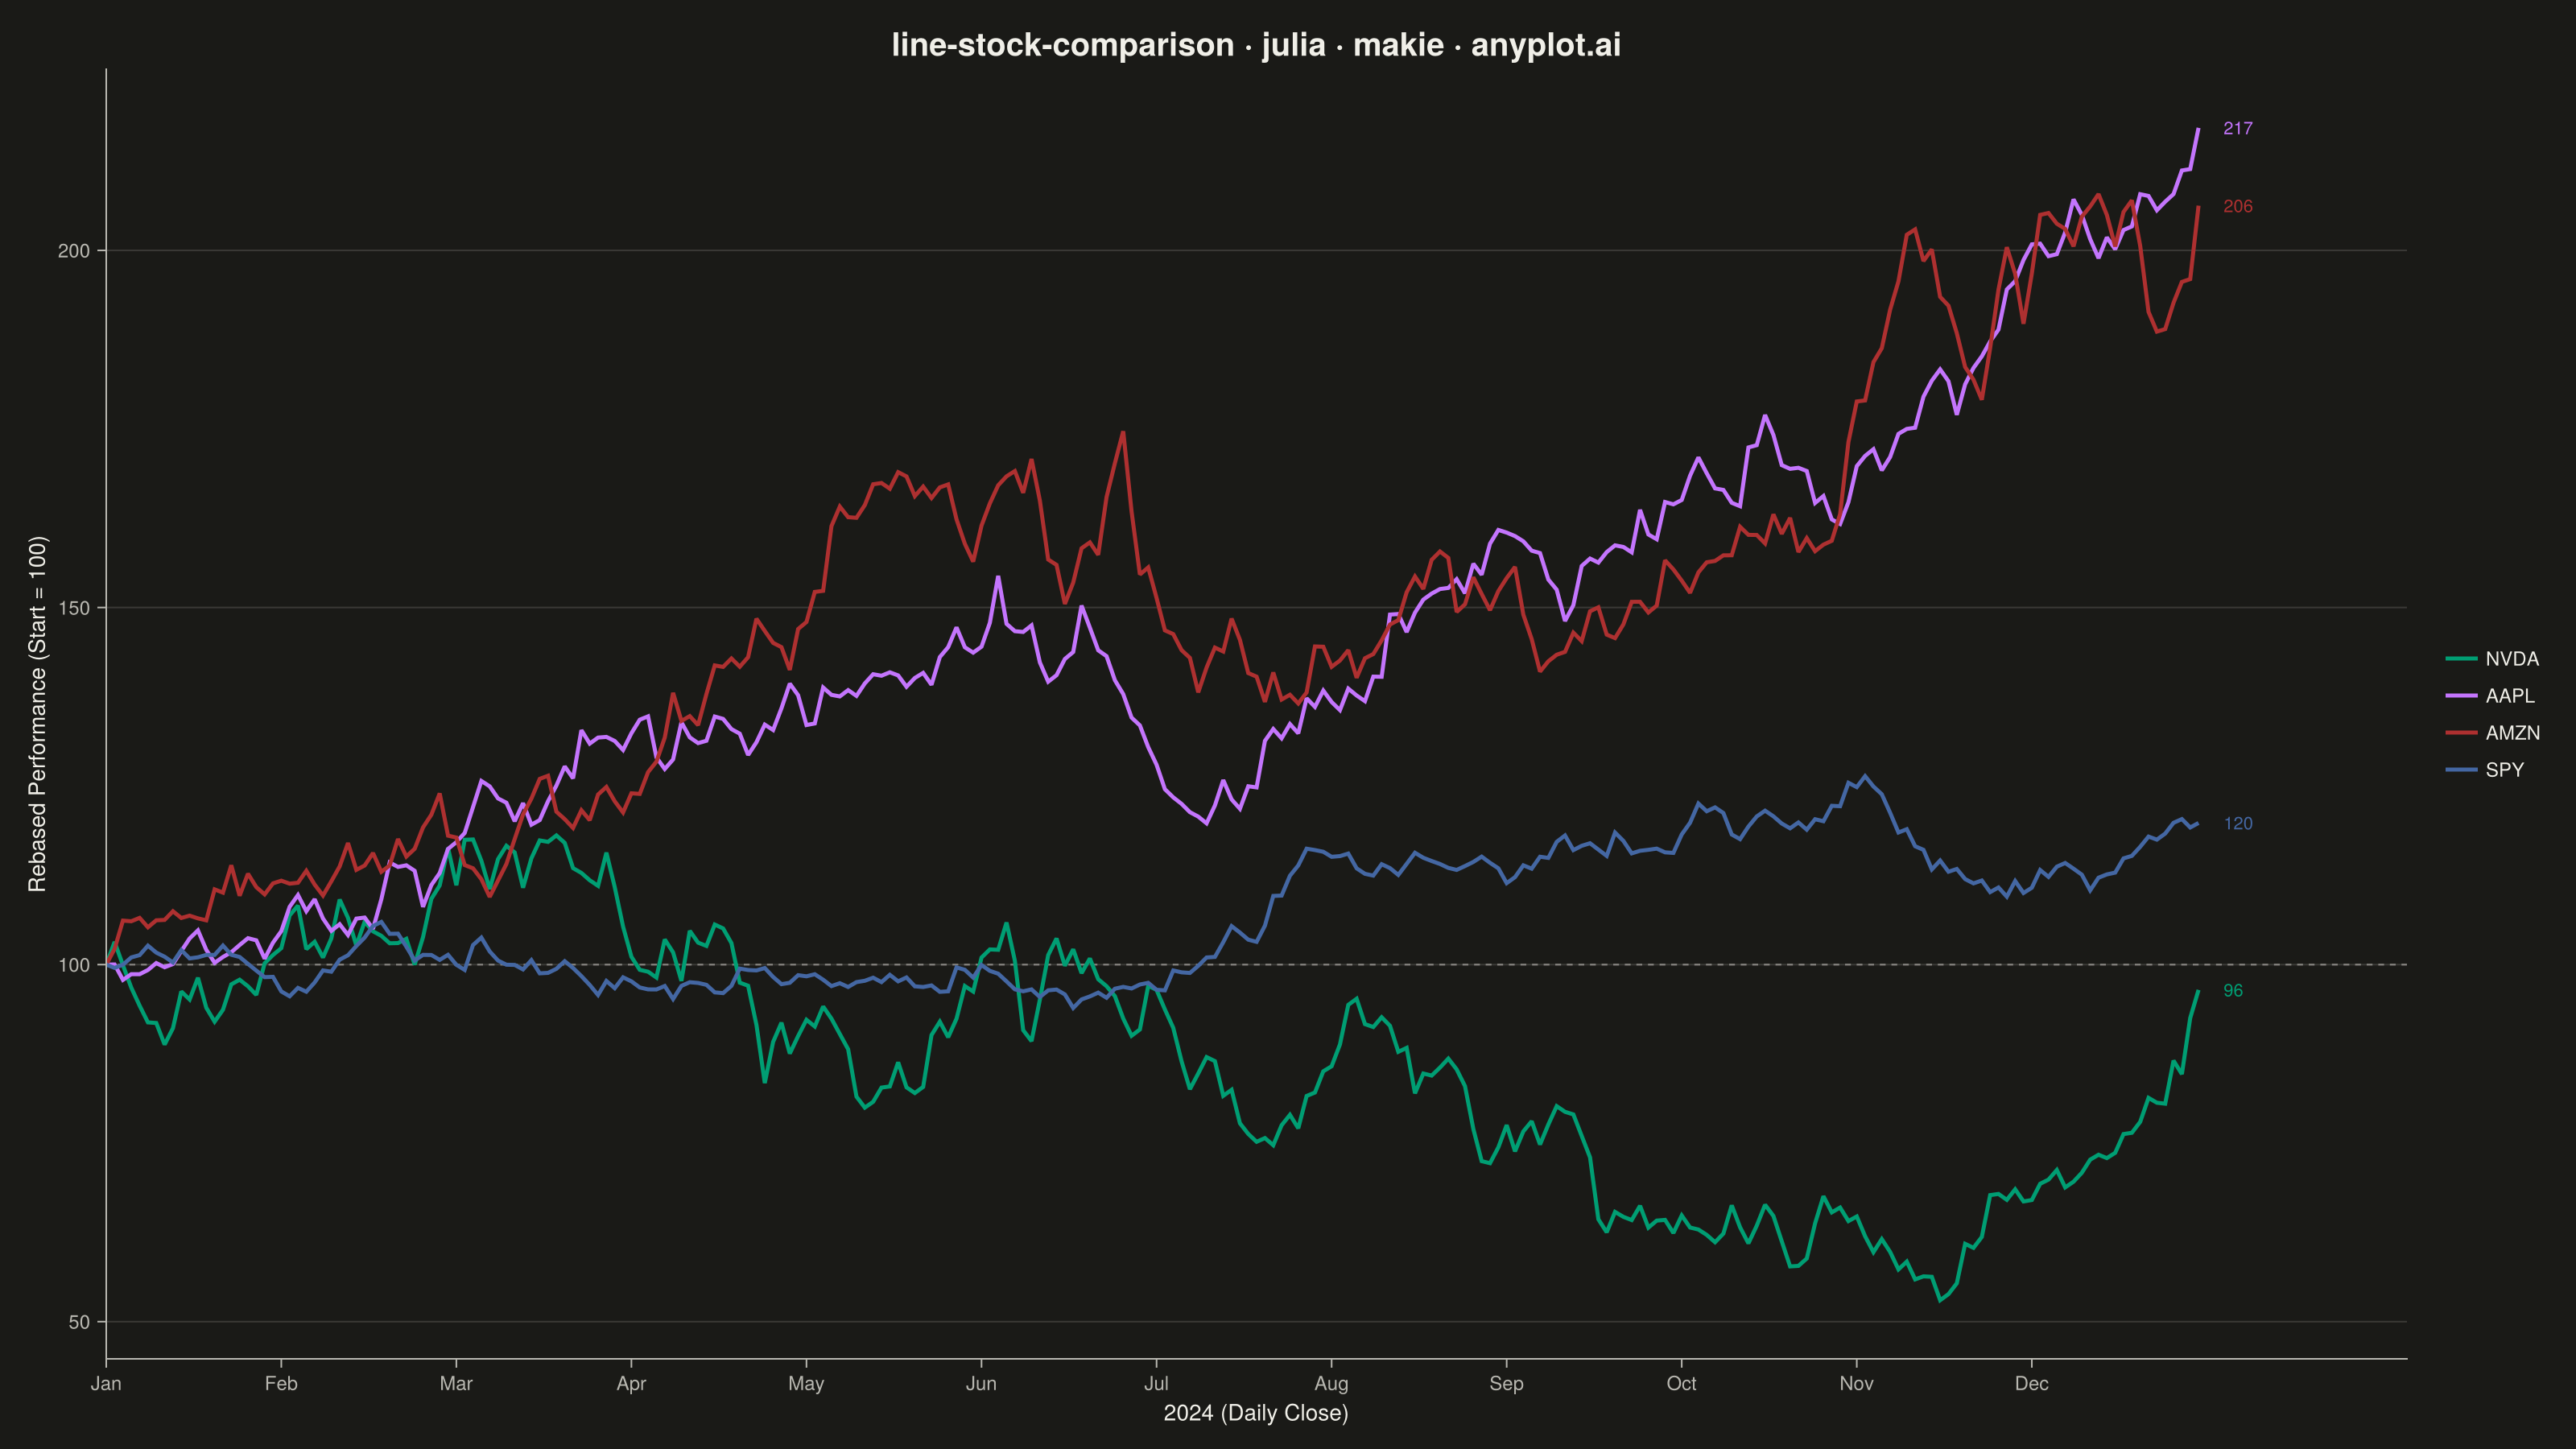
A multi-line chart comparing multiple stock price series normalized to a common starting point (rebased to 100) for direct performance comparison over time. By rebasing all series to the same initial value, investors can easily compare relative returns regardless of absolute price differences. This visualization reveals which stocks outperformed or underperformed relative to each other, making it essential for portfolio analysis and benchmark comparisons.
# anyplot.ai
# line-stock-comparison: Stock Price Comparison Chart
# Library: makie 0.22.10 | Julia 1.11.9
# Quality: 89/100 | Created: 2026-05-23

using CairoMakie
using Colors
using Random

Random.seed!(42)

# Theme tokens
const THEME       = get(ENV, "ANYPLOT_THEME", "light")
const PAGE_BG     = THEME == "light" ? colorant"#FAF8F1" : colorant"#1A1A17"
const ELEVATED_BG = THEME == "light" ? colorant"#FFFDF6" : colorant"#242420"
const INK         = THEME == "light" ? colorant"#1A1A17" : colorant"#F0EFE8"
const INK_SOFT    = THEME == "light" ? colorant"#4A4A44" : colorant"#B8B7B0"

const IMPRINT = [
    colorant"#009E73",  # 1 — brand green  (NVDA)
    colorant"#C475FD",  # 2 — purple       (AAPL)
    colorant"#AE3030",  # 3 — red          (AMZN)
    colorant"#4467A3",  # 4 — sky blue     (SPY)
]

# Data: 252 trading days (~1 year) for 4 assets, normalized to 100
const N_DAYS  = 252
const TICKERS = ["NVDA", "AAPL", "AMZN", "SPY"]

# (daily drift, daily volatility) — geometric Brownian motion
const GBM_PARAMS = [
    (0.0018, 0.038),   # NVDA: high-growth tech, elevated vol
    (0.0007, 0.019),   # AAPL: steady large-cap
    (0.0005, 0.023),   # AMZN: moderate growth, higher vol
    (0.0003, 0.012),   # SPY:  broad-market benchmark
]

prices = Matrix{Float64}(undef, N_DAYS, 4)
for (j, (μ, σ)) in enumerate(GBM_PARAMS)
    p = fill(100.0, N_DAYS)
    for i in 2:N_DAYS
        p[i] = p[i-1] * (1.0 + μ + σ * randn())
    end
    prices[:, j] = p
end

days = 1:N_DAYS

# Approximate month tick positions (≈21 trading days per month, 2024)
month_ticks  = [1, 22, 43, 64, 85, 106, 127, 148, 169, 190, 211, 232]
month_labels = ["Jan", "Feb", "Mar", "Apr", "May", "Jun",
                "Jul", "Aug", "Sep", "Oct", "Nov", "Dec"]

# Semi-transparent colors for grid and reference line
ink_r = Float32(red(INK))
ink_g = Float32(green(INK))
ink_b = Float32(blue(INK))
grid_col = RGBAf(ink_r, ink_g, ink_b, 0.15f0)
ref_col  = RGBAf(ink_r, ink_g, ink_b, 0.40f0)

# Figure
fig = Figure(
    size            = (1600, 900),
    fontsize        = 14,
    backgroundcolor = PAGE_BG,
)

ax = Axis(
    fig[1, 1];
    title              = "line-stock-comparison · julia · makie · anyplot.ai",
    titlesize          = 20,
    titlecolor         = INK,
    xlabel             = "2024 (Daily Close)",
    ylabel             = "Rebased Performance (Start = 100)",
    xlabelcolor        = INK,
    ylabelcolor        = INK,
    xlabelsize         = 14,
    ylabelsize         = 14,
    xticklabelcolor    = INK_SOFT,
    yticklabelcolor    = INK_SOFT,
    xticklabelsize     = 12,
    yticklabelsize     = 12,
    xtickcolor         = INK_SOFT,
    ytickcolor         = INK_SOFT,
    backgroundcolor    = PAGE_BG,
    topspinevisible    = false,
    rightspinevisible  = false,
    leftspinecolor     = INK_SOFT,
    bottomspinecolor   = INK_SOFT,
    xgridvisible       = false,
    ygridcolor         = grid_col,
    xminorgridvisible  = false,
    yminorgridvisible  = false,
    xticks             = (month_ticks, month_labels),
)

# Horizontal reference line at 100 (common starting point)
hlines!(ax, [100.0]; color = ref_col, linewidth = 1.2, linestyle = :dash)

# Stock series lines
for j in 1:4
    lines!(ax, days, prices[:, j];
        color     = IMPRINT[j],
        linewidth = 2.5,
        label     = TICKERS[j],
    )
end

# End-of-series value labels (final rebased performance)
xlims!(ax, 1, N_DAYS + 25)
for j in 1:4
    final_val = prices[end, j]
    text!(ax, N_DAYS + 3, final_val;
        text     = string(round(Int, final_val)),
        color    = IMPRINT[j],
        fontsize = 11,
        align    = (:left, :center),
    )
end

# Legend (right column, external to plot)
Legend(fig[1, 2], ax;
    labelcolor      = INK,
    framevisible    = false,
    backgroundcolor = ELEVATED_BG,
    labelsize       = 12,
)

# Save
save("plot-$(THEME).png", fig; px_per_unit = 2)
Runnable source as JSON, for any HTTP client: https://api.anyplot.ai/specs/line-stock-comparison/makie/code. Any spec id and library id listed in llms-full.txt fit the same URL shape; every URL below is complete and callable.
{
  "spec_id": "line-stock-comparison",
  "language": "julia",
  "library": "makie",
  "page": "https://anyplot.ai/line-stock-comparison/julia/makie",
  "hub": "https://anyplot.ai/line-stock-comparison",
  "code_json": "https://api.anyplot.ai/specs/line-stock-comparison/makie/code",
  "spec_json": "https://api.anyplot.ai/specs/line-stock-comparison",
  "render_light_png": "https://storage.googleapis.com/anyplot-images/plots/line-stock-comparison/julia/makie/plot-light.png",
  "render_dark_png": "https://storage.googleapis.com/anyplot-images/plots/line-stock-comparison/julia/makie/plot-dark.png",
  "quality_score": 89.0,
  "license": "MIT",
  "guide": "https://anyplot.ai/llms.txt"
}
Part of Stock Price Comparison Chart on anyplot.ai.