The same plot in 14 other libraries — JavaScript: Chart.js, D3.js, Apache ECharts, MUI X Charts; Python: Altair, Bokeh, lets-plot, Matplotlib, Plotly, plotnine, Pygal, Seaborn; R: ggplot2; Julia: Makie.jl. Compare all 15 side by side: Stock Price Comparison Chart in Python, R, Julia and JavaScript.
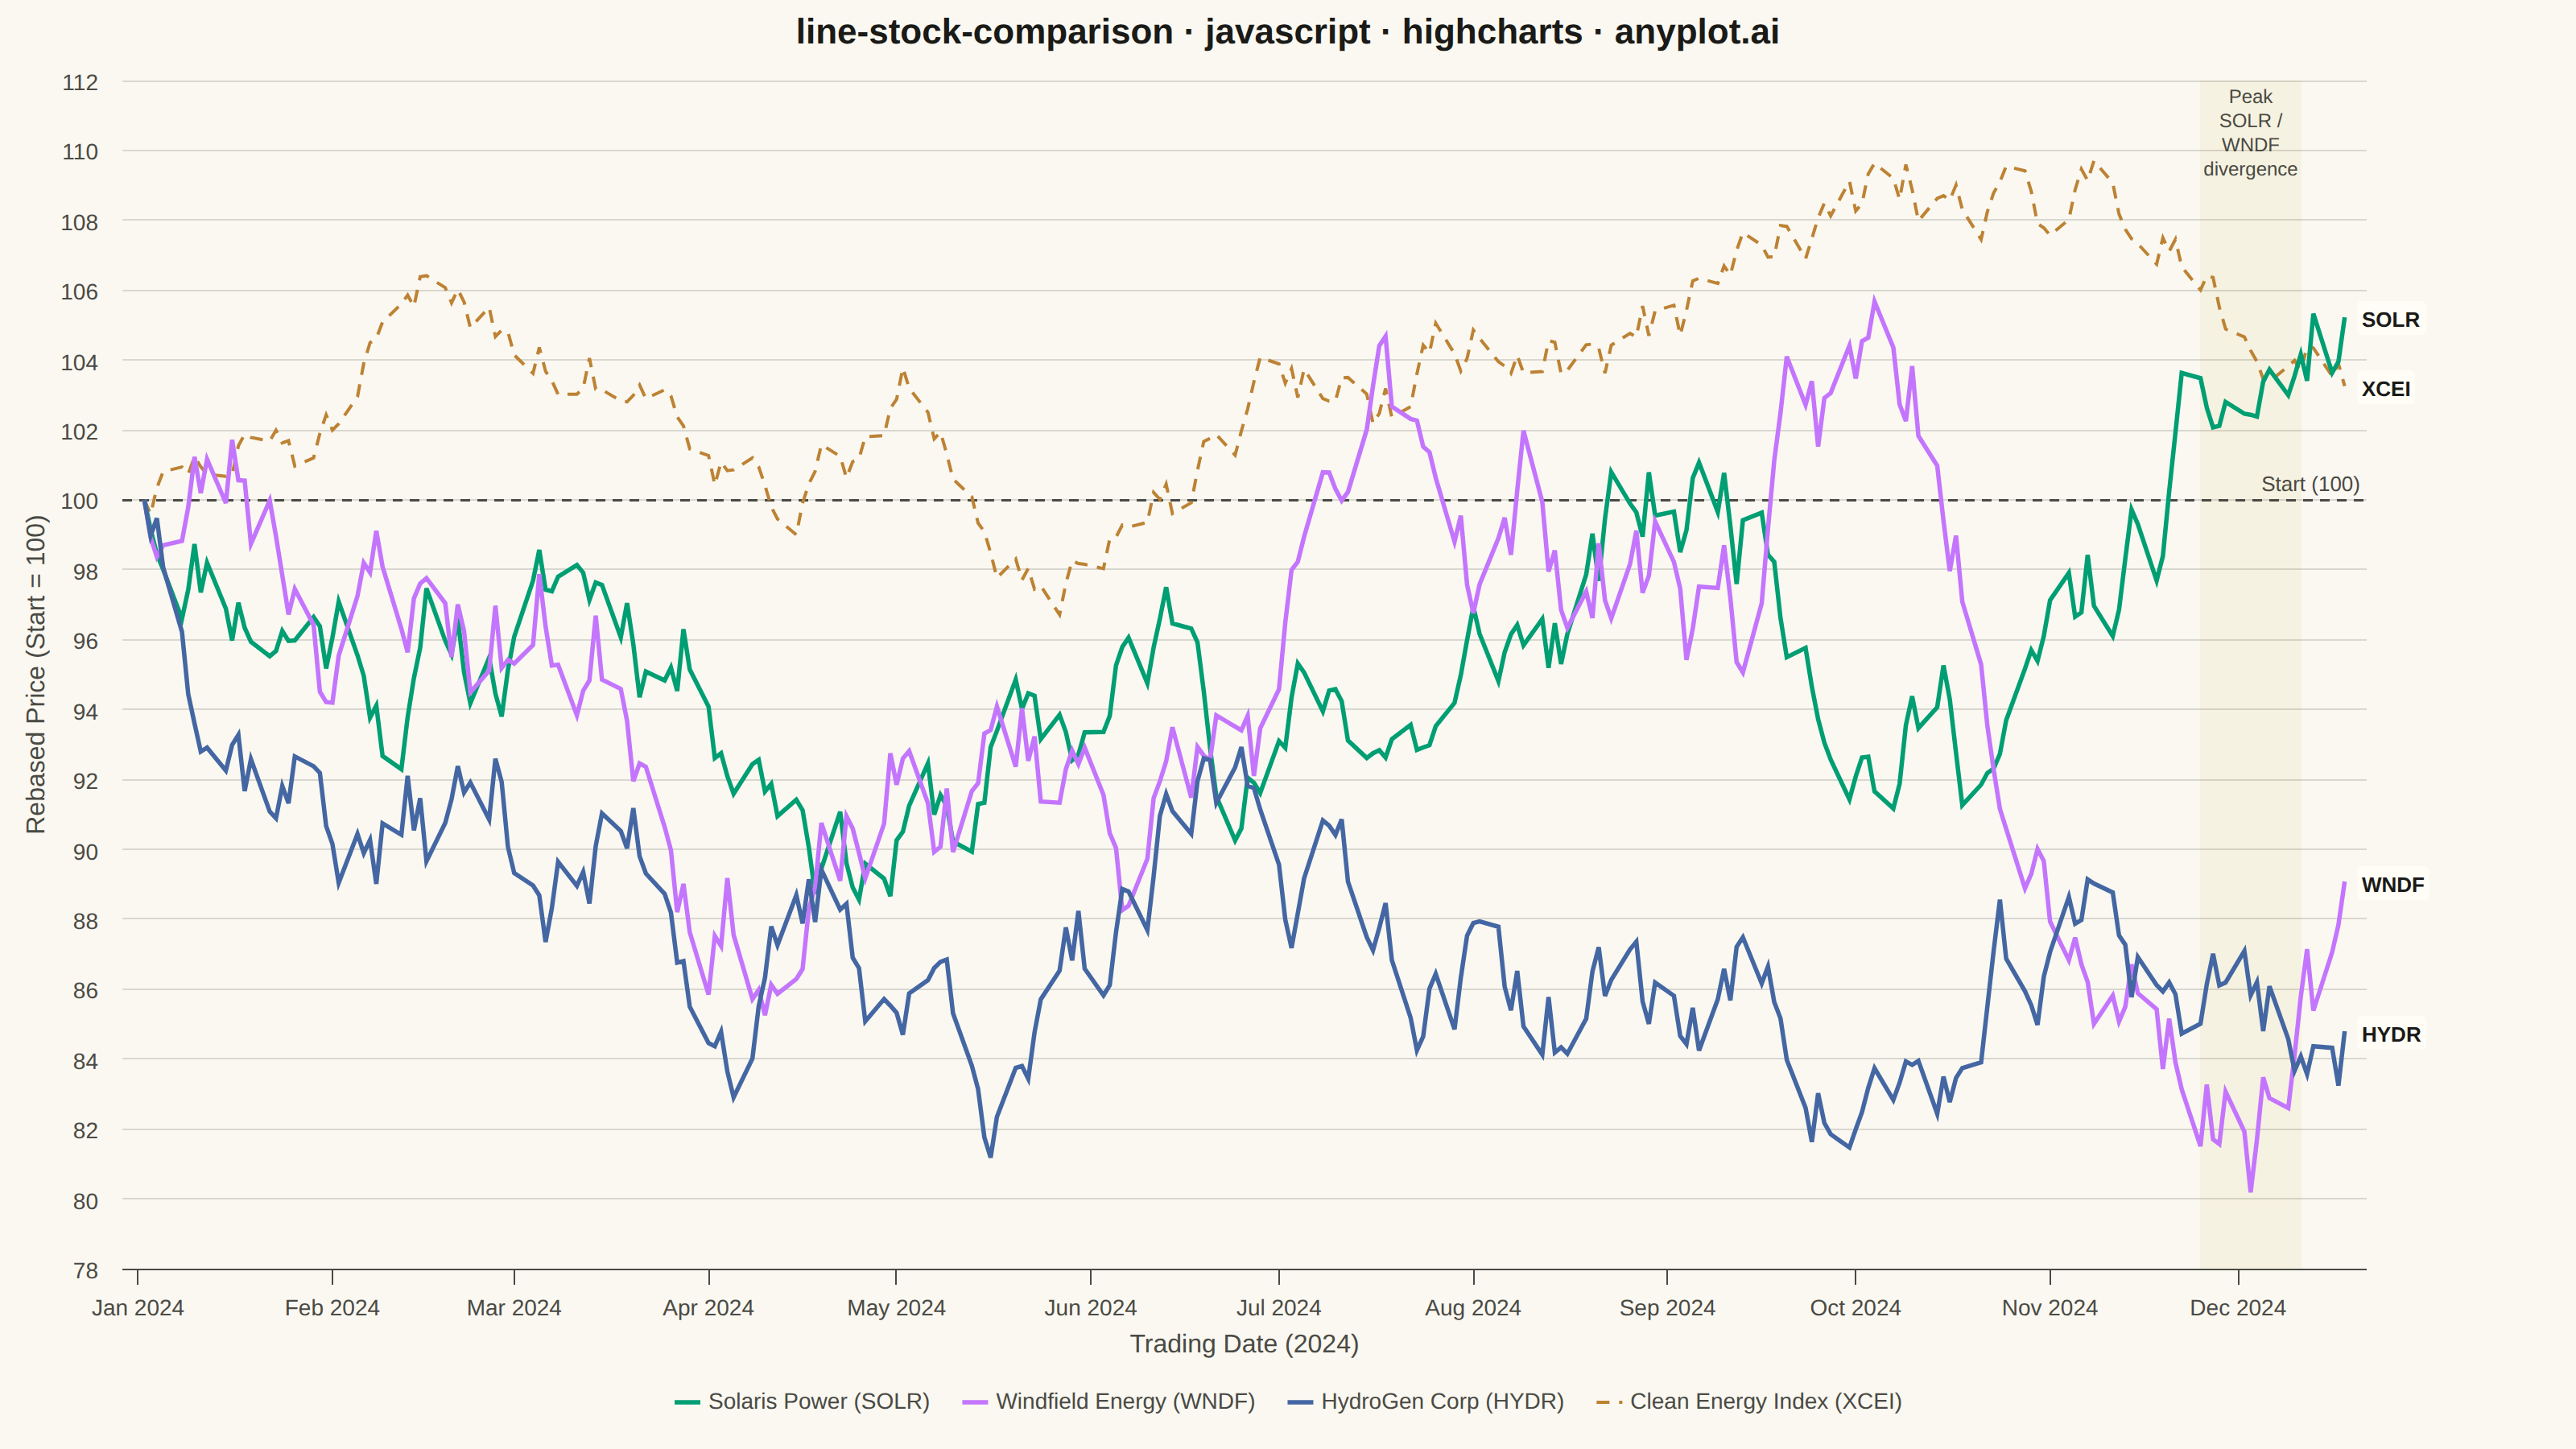
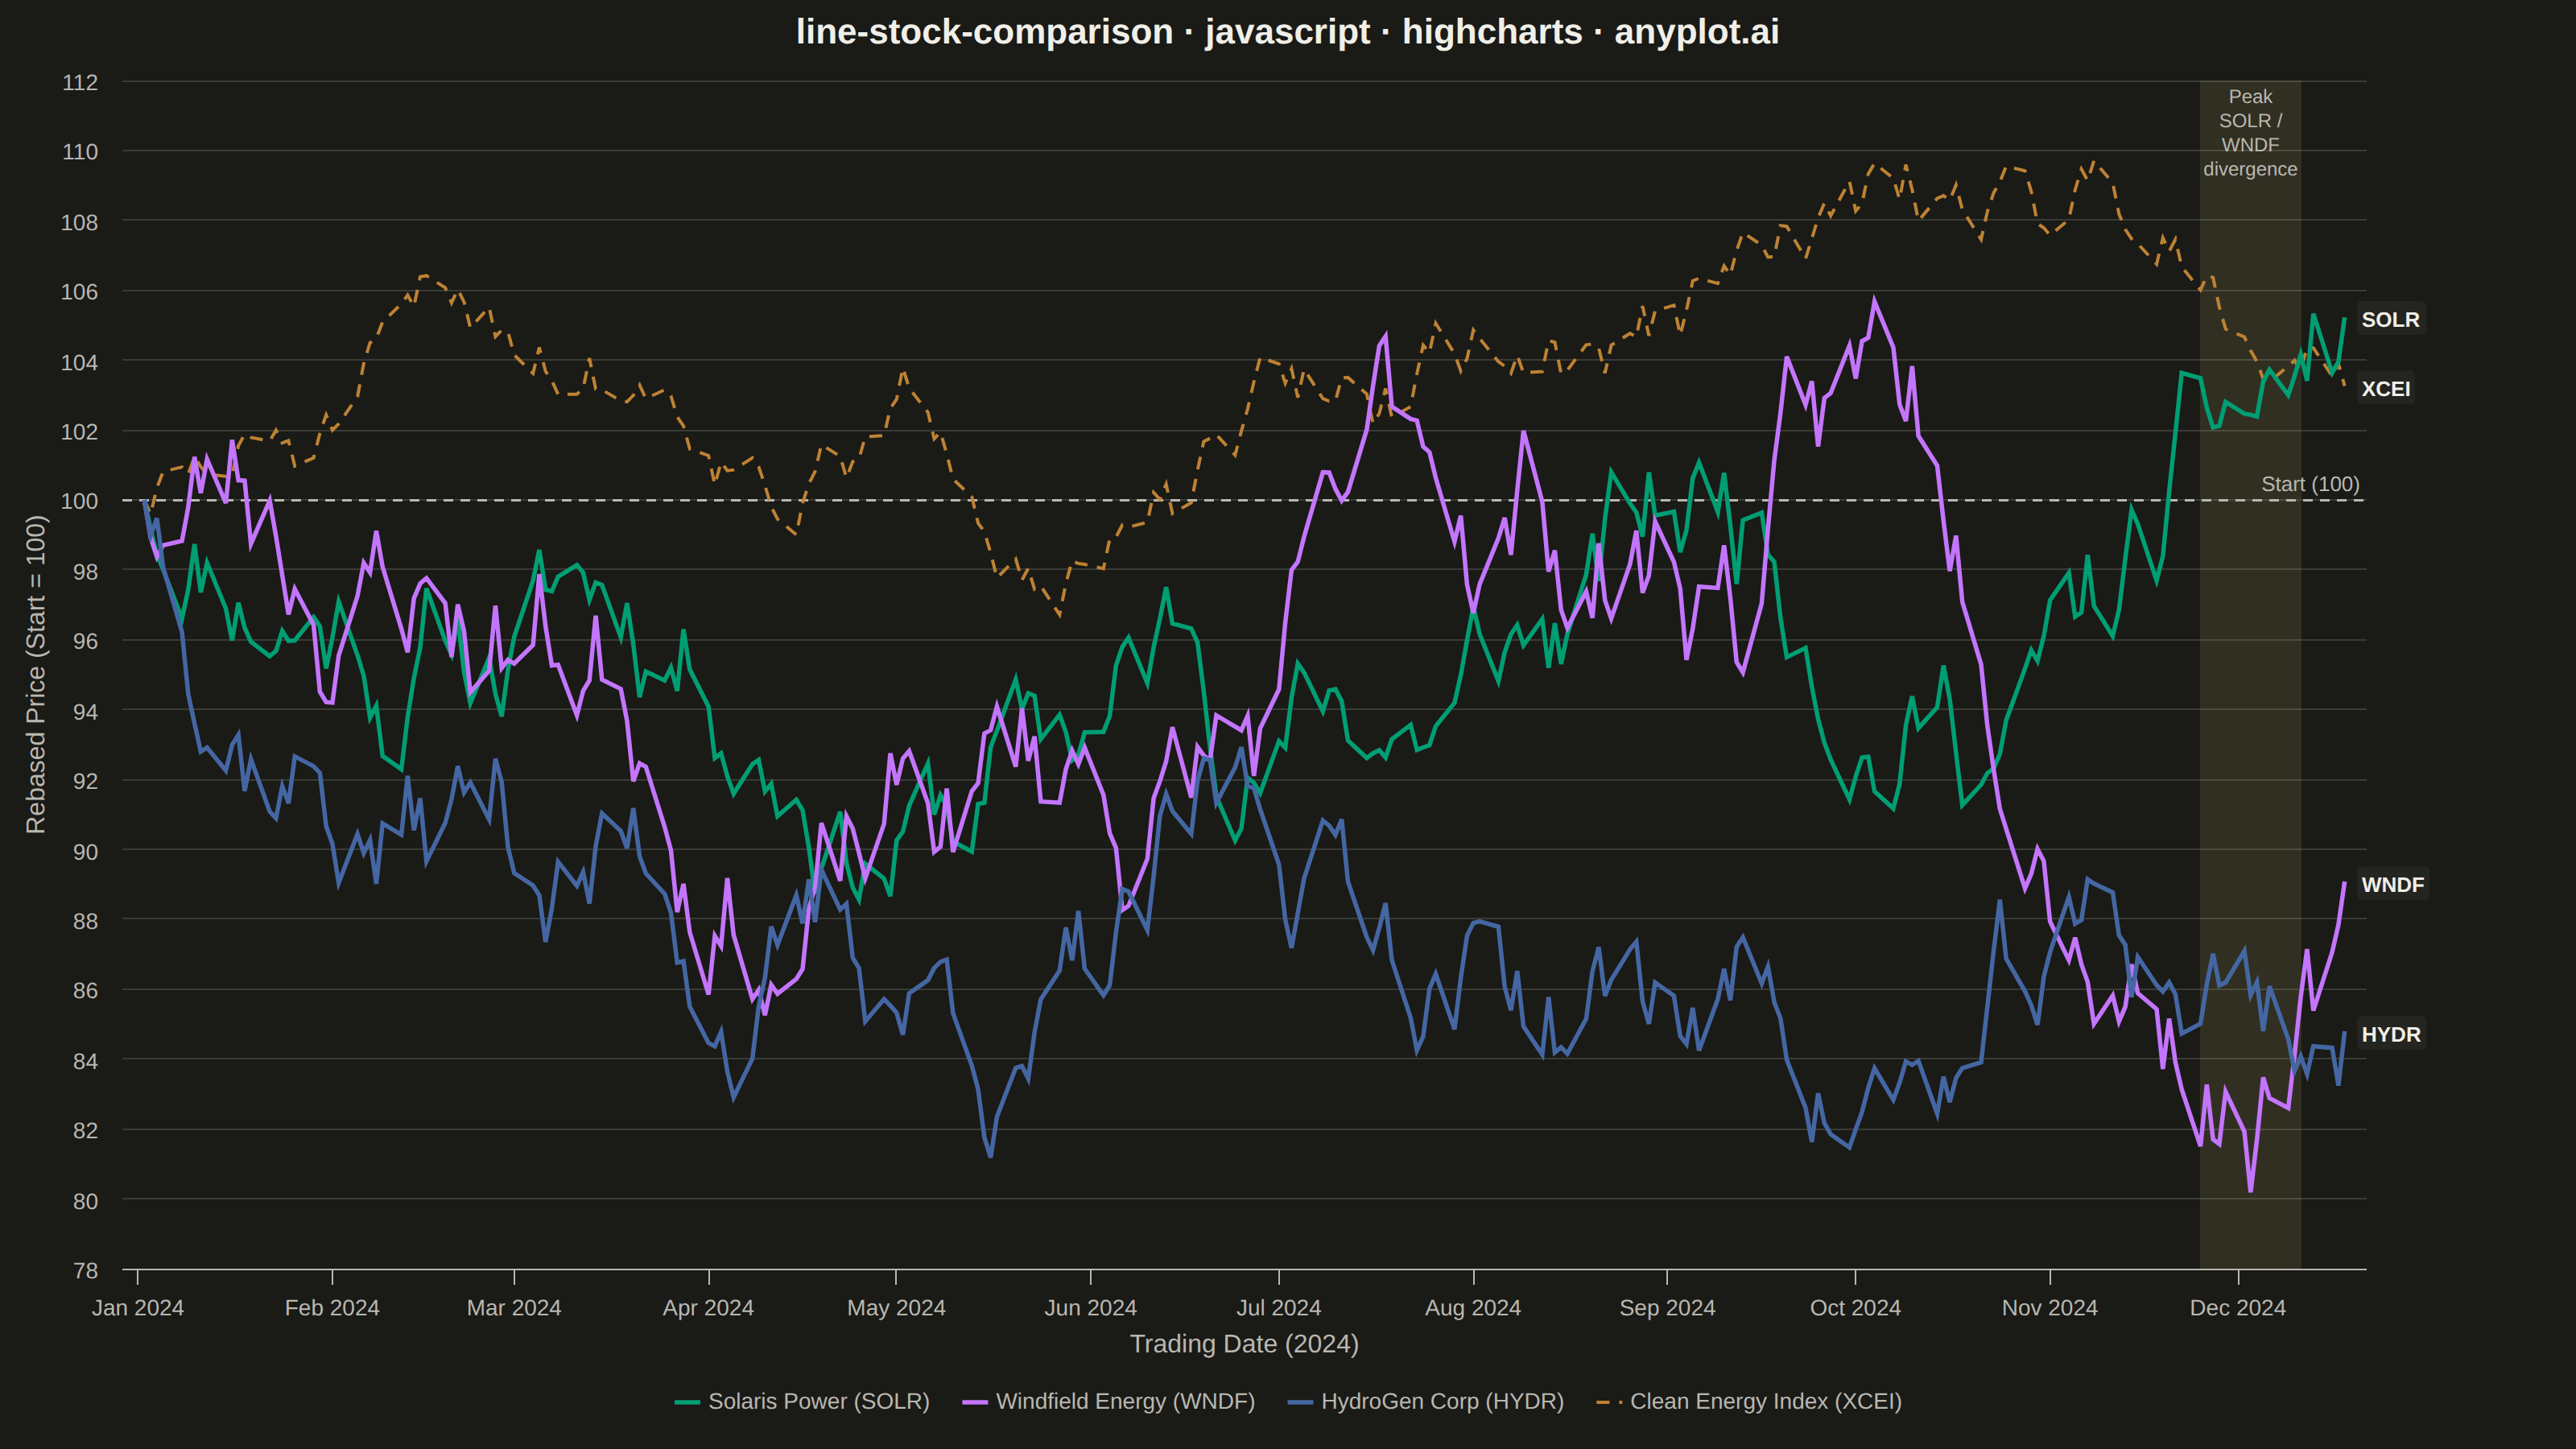
A multi-line chart comparing multiple stock price series normalized to a common starting point (rebased to 100) for direct performance comparison over time. By rebasing all series to the same initial value, investors can easily compare relative returns regardless of absolute price differences. This visualization reveals which stocks outperformed or underperformed relative to each other, making it essential for portfolio analysis and benchmark comparisons.
// anyplot.ai
// line-stock-comparison: Stock Price Comparison Chart
// Library: highcharts 12.6.0 | JavaScript 22.23.2
// Quality: 90/100 | Created: 2026-08-26

const t = window.ANYPLOT_TOKENS;

// --- Data (in-memory, deterministic) ----------------------------------------
// Three clean-energy stocks plus a sector benchmark index, one trading year
// (2024), rebased to 100 at the first date so relative performance is
// directly comparable regardless of starting price.

const MS_PER_DAY = 86400000;

function tradingDays(year, count) {
  const days = [];
  let cursor = Date.UTC(year, 0, 2);
  while (days.length < count) {
    const weekday = new Date(cursor).getUTCDay();
    if (weekday !== 0 && weekday !== 6) days.push(cursor);
    cursor += MS_PER_DAY;
  }
  return days;
}

function makeLcg(seed) {
  let state = seed >>> 0;
  return () => {
    state = (state * 1664525 + 1013904223) >>> 0;
    return state / 4294967296;
  };
}

function priceWalk(seed, start, drift, volatility, n) {
  const rng = makeLcg(seed);
  const prices = [start];
  for (let i = 1; i < n; i++) {
    const shock = (rng() - 0.5) * 2 * volatility;
    prices.push(prices[i - 1] * (1 + drift + shock));
  }
  return prices;
}

const dates = tradingDays(2024, 252);

const stocks = [
  { name: "Solaris Power (SOLR)", ticker: "SOLR", seed: 11, start: 42, drift: 0.0009, vol: 0.018 },
  { name: "Windfield Energy (WNDF)", ticker: "WNDF", seed: 23, start: 58, drift: 0.0004, vol: 0.022 },
  { name: "HydroGen Corp (HYDR)", ticker: "HYDR", seed: 37, start: 76, drift: -0.0003, vol: 0.02 },
  { name: "Clean Energy Index (XCEI)", ticker: "XCEI", seed: 51, start: 100, drift: 0.0003, vol: 0.009 },
];

const rebasedPrices = stocks.map((s) => {
  const prices = priceWalk(s.seed, s.start, s.drift, s.vol, dates.length);
  const basePrice = prices[0];
  return prices.map((p) => (p / basePrice) * 100);
});

// Storytelling: locate the trading day where SOLR and WNDF diverge the most
// and shade that window via core-Highcharts xAxis.plotBands (no annotations
// module needed) — computed from the data, not hardcoded, so the highlight
// stays correct if the walk parameters above change.
let peakIdx = 0;
let peakGap = -Infinity;
for (let i = 0; i < dates.length; i++) {
  const gap = Math.abs(rebasedPrices[0][i] - rebasedPrices[1][i]);
  if (gap > peakGap) {
    peakGap = gap;
    peakIdx = i;
  }
}
const divergenceBand = {
  from: dates[Math.max(0, peakIdx - 6)],
  to: dates[Math.min(dates.length - 1, peakIdx + 6)],
};

const series = stocks.map((s, i) => {
  const values = rebasedPrices[i];
  const isBenchmark = i === stocks.length - 1;
  const data = values.map((y, idx) => {
    if (idx !== values.length - 1) return [dates[idx], y];
    // Connector-style end label so each line's final ranking reads at a
    // glance without cross-referencing the legend below the plot.
    return {
      x: dates[idx],
      y,
      dataLabels: {
        enabled: true,
        format: s.ticker,
        align: "left",
        x: 8,
        verticalAlign: "middle",
        crop: false,
        overflow: "allow",
        style: { color: t.ink, fontSize: "13px", fontWeight: "600", textOutline: "none" },
        backgroundColor: t.elevatedBg,
        borderRadius: 3,
        padding: 3,
      },
    };
  });
  return {
    name: s.name,
    data,
    lineWidth: isBenchmark ? 2 : 2.75,
    dashStyle: isBenchmark ? "Dash" : "Solid",
    // Benchmark recedes behind the individual stocks so the dashed line
    // doesn't compete for attention at small (mobile-preview) sizes.
    zIndex: isBenchmark ? 1 : 2,
  };
});

// --- Chart -------------------------------------------------------------------
Highcharts.chart("container", {
  chart: {
    type: "line",
    backgroundColor: "transparent",
    animation: false,
    marginRight: 130,
    style: { fontFamily: "inherit" },
  },
  credits: { enabled: false },
  colors: t.palette,
  title: {
    text: "line-stock-comparison · javascript · highcharts · anyplot.ai",
    style: { color: t.ink, fontSize: "22px", fontWeight: "600" },
  },
  xAxis: {
    type: "datetime",
    lineColor: t.inkSoft,
    tickColor: t.inkSoft,
    gridLineColor: t.grid,
    labels: { style: { color: t.inkSoft, fontSize: "14px" } },
    title: { text: "Trading Date (2024)", style: { color: t.inkSoft, fontSize: "16px" } },
    plotBands: [
      {
        from: divergenceBand.from,
        to: divergenceBand.to,
        color: Highcharts.color(t.amber).setOpacity(0.12).get("rgba"),
        label: {
          text: "Peak SOLR / WNDF divergence",
          align: "center",
          verticalAlign: "top",
          y: 14,
          style: { color: t.inkSoft, fontSize: "12px" },
        },
      },
    ],
  },
  yAxis: {
    title: { text: "Rebased Price (Start = 100)", style: { color: t.inkSoft, fontSize: "16px" } },
    lineColor: t.inkSoft,
    tickColor: t.inkSoft,
    gridLineColor: t.grid,
    labels: { style: { color: t.inkSoft, fontSize: "14px" } },
    plotLines: [
      {
        value: 100,
        color: t.inkSoft,
        dashStyle: "Dash",
        width: 1.5,
        zIndex: 3,
        label: {
          text: "Start (100)",
          align: "right",
          x: -4,
          y: -6,
          style: { color: t.inkSoft, fontSize: "13px" },
        },
      },
    ],
  },
  legend: {
    itemStyle: { color: t.inkSoft, fontSize: "14px" },
    itemHoverStyle: { color: t.ink },
  },
  tooltip: { xDateFormat: "%b %e, %Y", valueDecimals: 1 },
  plotOptions: {
    series: { animation: false, marker: { enabled: false } },
  },
  series,
});
Runnable source as JSON, for any HTTP client: https://api.anyplot.ai/specs/line-stock-comparison/highcharts/code. Any spec id and library id listed in llms-full.txt fit the same URL shape; every URL below is complete and callable.
{
  "spec_id": "line-stock-comparison",
  "language": "javascript",
  "library": "highcharts",
  "page": "https://anyplot.ai/line-stock-comparison/javascript/highcharts",
  "hub": "https://anyplot.ai/line-stock-comparison",
  "code_json": "https://api.anyplot.ai/specs/line-stock-comparison/highcharts/code",
  "spec_json": "https://api.anyplot.ai/specs/line-stock-comparison",
  "render_light_png": "https://storage.googleapis.com/anyplot-images/plots/line-stock-comparison/javascript/highcharts/plot-light.png",
  "render_dark_png": "https://storage.googleapis.com/anyplot-images/plots/line-stock-comparison/javascript/highcharts/plot-dark.png",
  "interactive_light_html": "https://storage.googleapis.com/anyplot-images/plots/line-stock-comparison/javascript/highcharts/plot-light.html",
  "interactive_dark_html": "https://storage.googleapis.com/anyplot-images/plots/line-stock-comparison/javascript/highcharts/plot-dark.html",
  "quality_score": 90.0,
  "license": "MIT",
  "guide": "https://anyplot.ai/llms.txt"
}
Part of Stock Price Comparison Chart on anyplot.ai.